
記住我


In this longitudinal research, the dataset was derived from the CHARLS, covering a period from 2011 to 2018. The study’s sample was drawn from a broad cross-section of the population, encompassing 450 communities within 150 counties across 28 provinces. Utilizing a systematic methodology, CHARLS gathered biennial data encompassing demographic characteristics, nutritional habits, and overall health statuses of residents, family units, and larger community settings. In the baseline survey in 2011–2012, we included 17,708 participants (Wave 1). Data on exposure variables and all covariates were measured in 2011–2012. Participants received three follow-up visits in 2013–2014 (Wave 2), 2015–2016 (Wave 3), and 2017–2018 (Wave 4). Our study included participants if they attended any of the Wave 2, Wave 3, and Wave 4 follow-ups.
Study populationAuthorization for conducting the CHARLS was officially obtained from the Biomedical Ethics Review Board of Peking University, with all subjects providing written consent in accordance with ethical standards [14]. Our study was conducted in strict alignment with the ethical guidelines set forth by the Declaration of Helsinki, ensuring compliance with all relevant regulations and legal requirements during the research process.
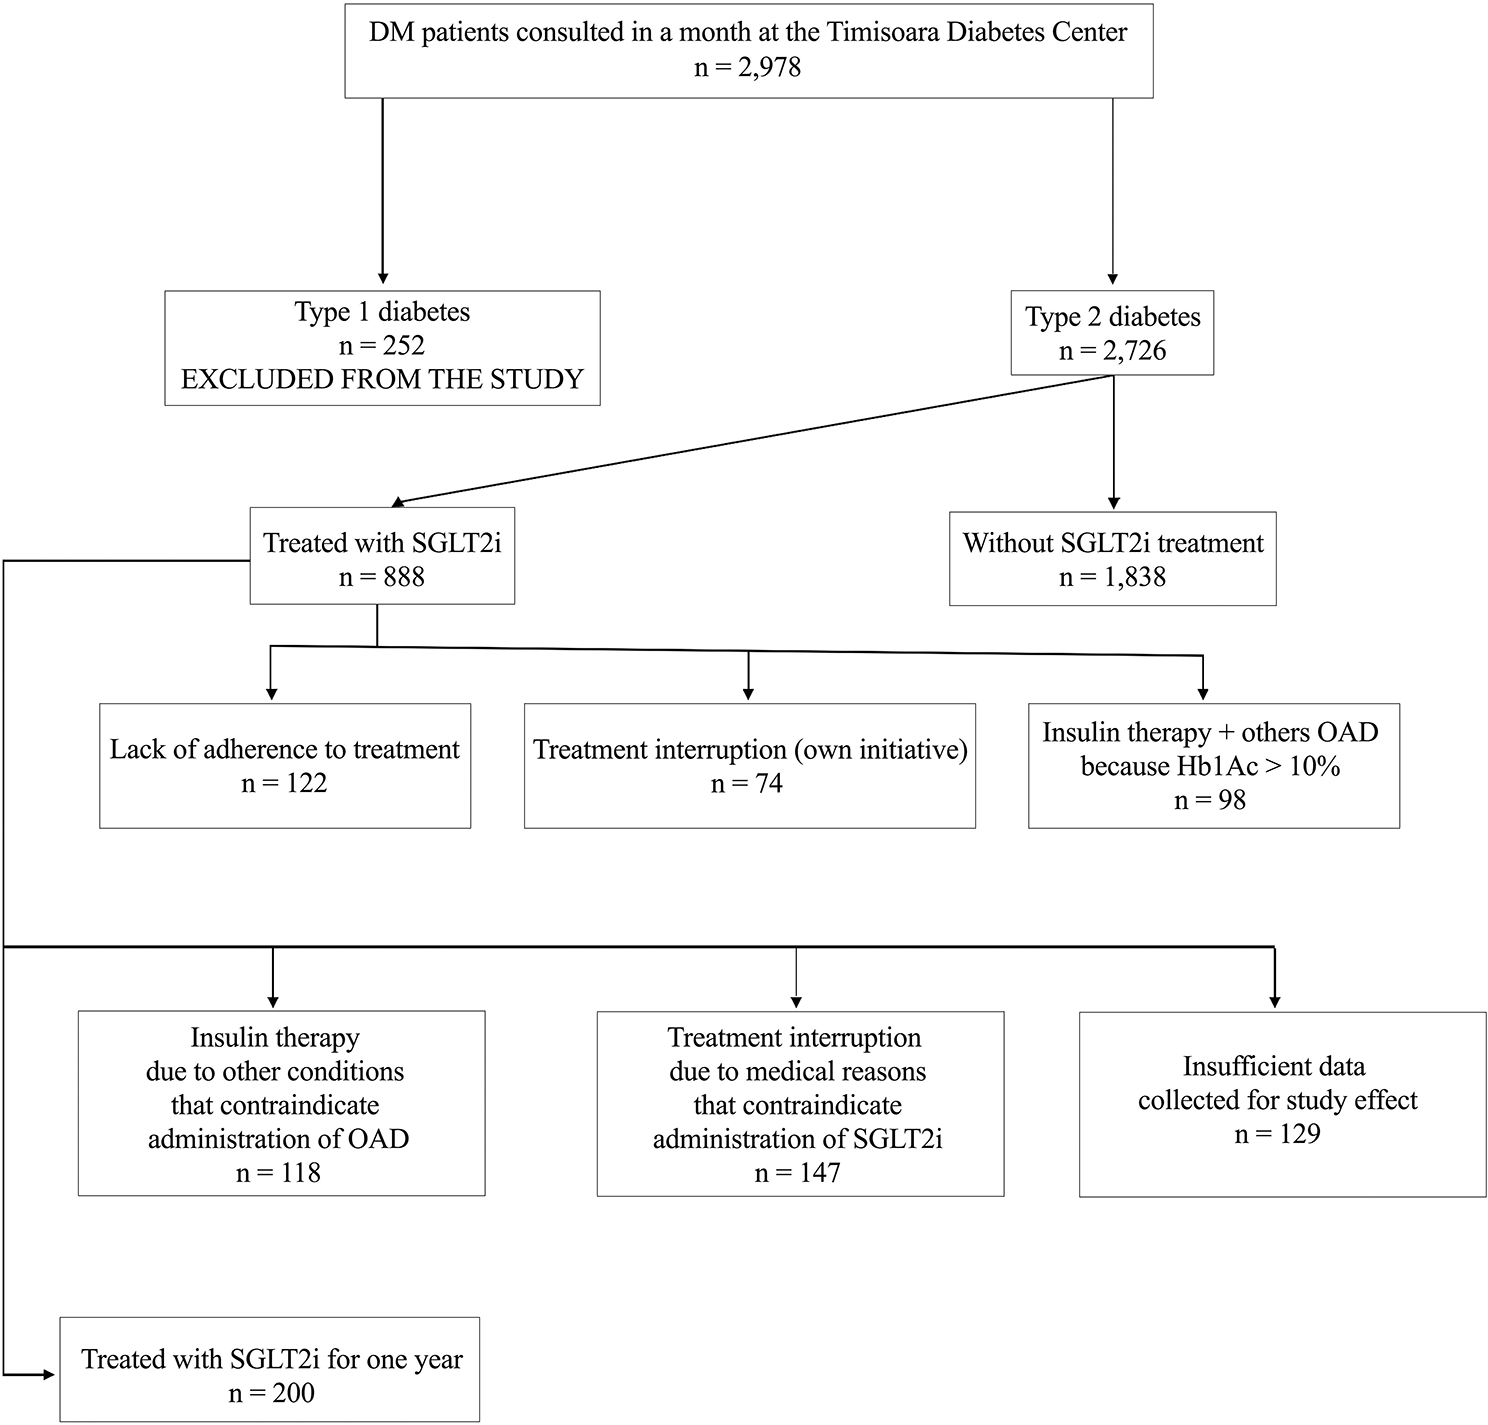
Criteria for exclusion from the participant pool included individuals with less than 2 years of follow-up, a pre-existing stroke condition, incomplete stroke data, being treated or having been treated for stroke at baseline, those under the age of 45, missing baseline data for HDL-C or TG, and TG/HDL-C ratios that were outliers (beyond three standard deviations from the mean). After applying these criteria, the cohort for our final analysis was comprised of 10,164 subjects. The methodology and flow of participants through the study are depicted in Fig. 1.
Fig. 1 TG/HDL-C ratio
Serum TG level (mg/dL) divided by HDL-C level (mg/dL) was used to compute the TG/HDL-C ratio.
Diagnosis of strokeIn our study, the outcome of interest in this study was the occurrence of stroke during the follow-up period. We identified incident cases as participants who, being devoid of stroke at the commencement of the study, subsequently reported experiencing a stroke during the follow-up assessments. Data pertaining to the occurrence of stroke were meticulously collected through a structured self-reported questionnaire [14, 15], designed to elicit comprehensive information on three critical aspects: (1) Were you informed of a stroke diagnosis by a medical professional? (2) When did you initially receive or become aware of the diagnosis? (3) Do you have any therapy for your stroke at this time? Affirmative responses during follow-up were classified as first-time stroke diagnoses, with the reported date marking the onset. The interval between the stroke onset and baseline assessment was calculated to establish the timing of the stroke. For those without reported strokes during follow-up, we determined follow-up duration by the interval between the baseline assessment and their final survey date.
Data collectionHealthcare professionals and skilled surveyors collected a range of data from participants, including demographic details, body measurements, and health indicators. Systolic blood pressure (SBP), age, height, drinking habits, sex, diastolic blood pressure (DBP), smoking habits, weight and physical activity were all recorded. Physical activity was defined as engaging in either moderate-intensity exercise for at least 2.5 h weekly, vigorous exercise for a minimum of 1.25 h weekly, or a combination that equates to 600 or more metabolic equivalent minutes each week [16]. Smoking status was categorized into three distinct groups according to individuals’ smoking behavior: current smokers, individuals who have smoked in the past, and individuals who have never smoked. Similarly, drinking status was classified into three categories based on individuals’ drinking behavior: current drinkers, individuals who have previously consumed alcohol, and individuals who have never consumed alcohol. Weight/Height2 (kg/m2) was used to compute BMI. Hypertension was defined as SBP ≥ 140 mmHg, DBP ≥ 90 mmHg (average of 3 measurements), or hypertension history. Blood samples were taken by the medical staff from the Chinese Center for Disease Control and Prevention after an overnight fast. These samples were analyzed in a central laboratory to measure various biomarkers, including total cholesterol (TC), glycosylated hemoglobin (HbA1c), C-reactive protein (CRP), LDL-C, serum creatinine (Scr), HDL-C, serum cystatin C, TG, fasting plasma glucose (FPG), and uric acid (UA).
Missing data processingThe dataset used in the study exhibited missing values for several clinical variables, constituting a small fraction of the overall dataset. Specifically, missing values were observed for gender in 8 individuals (0.08%), BMI in 1503 individuals (14.62%), DBP in 1463 individuals (14.24%), hypertension in 55 individuals (0.54%), drinking status in 11 individuals (0.11%), SBP in 1463 individuals (14.24%), physical activity in 6011 individuals (58.49%), smoking status in 169 individuals (1.64%), FPG in 14 individuals (0.14%), TC in 3 individuals (0.03%), CRP in 1 individual (0.01%), LDL-C in 21 individuals (0.20%), Scr in 18 individuals (0.18%), HbA1c in 80 individuals (0.78%), Cystatin C in 2472 individuals (24.05%), and UA in 1 individual (0.01%). To address the missing clinical variables, multiple imputations via chained equations were employed for modeling purposes. The imputation model incorporated the following variables: smoking status, DBP, SBP, gender, physical activity, drinking status, age, hypertension, drugs for cardiovascular prevention, BMI, FPG, TC, Scr, CRP, LDL-C, Cystatin C HbA1c, and UA. The analysis of missing data followed the assumption of missing-at-random to ensure the validity of the imputation process [17].
Statistical analysisStatistical computations were performed utilizing the R software environment along with Empower Stats. The initial categorization of baseline characteristics segmented the dataset into four groups based on quartiles of the TG/HDL-C ratio. We presented categorical variables using frequency counts and percentages, whereas median and interquartile ranges (25th–75th percentile) or mean values with standard deviations (SD) were used for continuous variables. To examine differences among the four groups, we utilized the Kruskal–Wallis H test for data with a skewed distribution, the One-Way ANOVA test for normally distributed data, or the χ2 test for categorical data.
We constructed multivariate Cox proportional hazards regression models in a three-tiered approach to test the correlation between the TG/HDL-C ratio and stroke: (1) Model I: this Model did not incorporate any covariates; (2) Model II: this Model adjusted for socio-demographic factors, including smoking status, gender, physical activity, drinking status, age, and BMI; (3) Model III: this Model adjusted for all factors, including smoking status, gender, physical activity, drinking status, age, BMI, hypertension, drugs for cardiovascular prevention, FPG, TC, Scr, CRP, LDL-C, Cystatin C HbA1c, and UA. We reported both adjusted and unadjusted hazard ratios (HR) with their 95% confidence intervals (CI).
The sensitivity analyses were conducted to check the validity of our findings. We categorized the TG/HDL-C ratio into groups based on its quartile distribution. We then determined the P-value for the trend to evaluate the significance of the TG/HDL-C ratio when considered a continuous variable and to examine its potential non-linear relationship with stroke risk. Because hypertension and drugs for cardiovascular prevention may influence the relationship between TG/HDL-C and stroke, we performed additional sensitivity analyses by excluding individuals with hypertension or drugs for cardiovascular prevention to investigate the connection between the TG/HDL-C ratio and stroke in subgroups.
To evaluate the non-linear relationship between the TG/HDL-C ratio and the occurrence of stroke, we utilized the Cox proportional hazards regression model, incorporating cubic spline functions and smooth curve fitting techniques. Upon detection of a non-linear correlation, we pinpointed the inflection point through recursive techniques. Subsequently, we applied a two-piecewise Cox proportional hazards regression model to each segment divided by the inflection point. The determination of the most suitable model to clarify the link between the TG/HDL-C ratio and stroke risk relied on the outcomes of a log-likelihood ratio test.
The subgroup analysis was performed through the utilization of the Cox proportional hazard model. The following variables were converted into categorical variables: BMI (< 25 kg/m2, ≥ 25 kg/m2) and age (< 65 years, ≥ 65 years) according to clinical cutoffs. With the exception of the stratification variable, each stratification was given a fully adjusted analysis. The likelihood ratio test was performed to validate the interactions between subgroups. All results follow the STROBE statement [18]. Statistical significance was established using a two-tailed test with a threshold of P < 0.05.
留言 (0)