
記住我
Liver cirrhosis is a chronic liver disease characterized by diffuse fibrosis of liver tissue and the formation of regenerating nodules [1,2]. Chronic hepatitis B virus (CHBV) infection accounts for 42% of cirrhosis worldwide [3]. The total number of deaths from cirrhosis worldwide increased by 8.1% in 2019 (1.43 million people) compared to 2017 (1.323 million people) [4]. Esophageal variceal hemorrhage (EVH) is a leading cause of death in patients with cirrhosis due to its acute onset and high mortality rate [5]. Esophageal varices occur in approximately 25–35% of patients with cirrhosis, 40% of patients with compensated cirrhosis, and 85% of patients with decompensated cirrhosis [6]. Hemorrhage from esophageal varices due to cirrhosis occurs in approximately 10–15% of cases presented annually [7]. In the standard care of endoscopic treatment of EVH, the mortality rate of EVH remains high [6]. There are no better available options to significantly improve the treatment outcomes. EVH endangers the lives of patients and reduces the quality of life of patients. Therefore, screening the risk factors for the occurrence of EVH, accurately assessing the risk of EVH before the occurrence of EVH, and taking corresponding interventions in advance can reduce the incidence of EVH-related mortality and related complications, and improve the quality of life of patients. The endoscopy remains the gold standard for the current diagnosis of EVH [8]. However, endoscopy is invasive, intolerable to some patients, and carries the risk of iatrogenic injury, which does not allow early prediction of the presence of EVH and is not conducive to long-term monitoring and follow-up of EVB [9]. The establishment of a non-invasive prediction model can avoid unnecessary endoscopy in patients with low EVH risk. The patients with high risk can be diagnosed with non-invasive methods and treated in earlier findings of EVH. The existing non-invasive models for predicting EVH cannot meet the clinical needs. We, therefore, sought to analyze the accuracy of the non-invasive prediction NMs with a combination of several different simple routinely available noninvasive tests, including spleen length, and other laboratory parameters, to determine their utility in predicting EV hemorrhage.
Materials and methods Ethics statementEthics approval and consent to participate: This study was registered at the Chinese Clinical Trial Registry (registration number: ChiCTR2000034735). The study protocol was approved by the Ethics Review Committee of the Second People’s Hospital of Fuyang City (reference number: 2019006). This research was conducted in accordance with the ethical standards of the institutional and national research committees, and with the 1964 Declaration of Helsinki.
Patients and study designIn this case-control study, 241 patients with confirmed cirrhosis and esophageal varices (EVs) were recruited from January 2021 to April 2023 at the Second People’s Hospital of Fuyang City. Cases included patients who experienced EV hemorrhage (EVH+) while controls were patients without hemorrhage (EVH−). All patients had endoscopically confirmed EVs, and diagnosis was in accordance with the standards established by the American Association for the Study of Liver Diseases (AASLD) [10]. The inclusion criteria were as follows: (1) age 18–75 years, (2) presence of cirrhosis with HBV infection, and (3) gastroscopy that confirmed EVs. Patients with the following conditions were excluded: (1) liver cirrhosis caused by other reasons, such as alcoholic cirrhosis, other hepatitis virus-related liver cirrhosis, autoimmune liver cirrhosis, etc.; (2) history of liver resection or splenectomy; (3) presence of diseases that may affect the imaging indexes of the spleen; (4) hematological diseases and (5) malignant tumors.
Patient information and laboratory testsPatient general information including age, gender, height (cm), weight (kg) was recorded. Laboratory parameters obtained included white blood cells (WBC), platelets (PLT), platelet distribution width (PDW), albumin (ALB), globulin (GLB), albumin/globulin (A/G), alanine aminotransferase (ALT), aspartate aminotransferase (AST), γ-glutamyl transpeptidase, alkaline phosphatase (ALP), total bilirubin (total bilirubin (TBIL), alphafetoprotein (AFP), Golgi apparatus protein 73 (GP73); International Normalized Ratio, electrolytes, hemoglobin, and hematocrit. Complete blood count was measured using the SYSMEX CA5100 automatic clotting analyzer (Siemens Healthcare, Erlangen, Germany) [11,12]. Liver function tests were assessed using the Hitachi 7600 fully automatic biochemical analyzer [11,12]. Serum GP73 was quantified using the UPT 3A-1800 Immunoassay Analyzer. Spleen size was routinely measured and reported on ultrasound examinations (Philips Ultrasound Machines) at The Second People’s Hospital, Fuyang by experienced medical doctors. The diagnosis of EVs was based on the 2008 Hangzhou consensus proposed by the Chinese Society of Gastroenterology, Chinese Society of Hepatology, and Chinese Society of Digestive Endoscopy. These criteria were derived from the AASLD practice guidelines, Baveno consensus, and Japanese Society for Portal Hypertension guidelines [13–16]. The calculation formula utilized is as reported below: BMI = weight (kg) ÷ height (m)2; ALBI=ALB/TBIL; APRI = AST×ULN/platelet(109/L)×100; FIB-4 = Age (years)×AST (U/L)/platelet(109/L)×ALT(U/L).
Statistical analysisData were analyzed using IBM SPSS Statistics for Windows, version 25 (IBM Corp., Armonk, NY, USA). The normalized distribution of continuous data was expressed as mean ± SD (x ± s), and independent samples t-test was used for comparison between the two groups. NCSS-PASS software15 (NCSS LLC., Kaysville, UT, USA) was used to estimate sample size. Continuous data are expressed as medians with interquartile range (IQR) and categorical data as frequencies. Continuous variables were compared using the Mann–Whitney U test, while categorical data were compared with the Chi-squared test. Kruskal–Wallis H test was used for further comparison between multiple groups and further pairwise comparison. Logistic regression was used to screen the high-risk factors for EVH. P < 0.05 indicated that the difference was statistically significant.
Construction and evaluation of nomogram modelThe R language package (R Core Team, 2023, R4.2.3) of the regression modeling strategies was used to build the nomogram. The software package of ‘rmda’ was used in decision curve analysis (DCA). Independent risk factors with a P < 0.05 in multivariate regression analysis were selected to construct the nomogram models (NMs) to assess the risk of EVH. The calibration curve was plotted to illustrate the prediction and observation probability of EVH predicted by the nomogram. DCA was used to determine the clinical relevance of nomograms. MedCalc Statistical Software version 20.027 (MedCalc Software Ltd, Ostend, Belgium; https://www.medcalc.org; 2022) was used to plot the receiver operating characteristic (ROC). ROC curve was used to predict model for EV hemorrhage, with the area under the curve (AUC) value used for the NMs prediction. AUC is an effective way to summarize the overall diagnostic accuracy of the test. It takes values from 0 to 1 (100%), where a value of 0 indicates an inaccurate test and a value of 1 (100%) reflects a perfectly accurate test. P < 0.05 indicated that the difference was statistically significant.
Results Patient characteristicsBaseline patient demographic and clinical characteristics are presented in Table 1. A total of 241 patients with hepatitis B-induced cirrhosis were recruited and randomly assigned into the prediction group (PG) (160 patients) and the validation group (VG) (81 patients) at the 7:3 ratio (Table 1). There were no significant differences between the two groups for the 28 tested clinical indicators (Table 1).
Table 1. - General characteristics of patients in the prediction and validation group Characteristic Prediction group Validation group Statistic P-value (n = 160) (n = 81) EVH (+) (%) 75 (46.9%) 39 (48.1%) χ2 = 0.035 0.852 Male [example (%)] 115 (71.9%) 53 (65.4%) χ2 = 1.057 0.304 Age (year) 53 (48–58.75) 53 (48.5–58.5) Z = −0.104 0.917 BMI (kg/m2) 24.04 (21.65–25.74) 23.81 (21.04–27.09) Z = −0.464 0.643 WBC (109/L) 3.27 (2.24–4.41) 3.29 (2.17–4.69) Z = −0.127 0.899 RBC (1012/L) 3.60 (3.0–4.21) 3.60 (2.7–4.25) Z = −0.376 0.707 HB (g/L) 105.50 (79.00–125.75) 109.00 (75.00–127.50) Z = −0.166 0.868 MCV (%) 15.15 (14.20–17.28) 15.10 (13.90–17.00) Z = −0.748 0.454 PLT (109/L) 61.00 (41.50–95.50) 63.00 (43.50–96.50) Z = −0.171 0.864 PDW (%) 13.10 (11.30–16.10) 14.60 (11.45–16.75) Z = −1.419 0.156 ALB (g/L) 35.55 ± 5.62 35.10 ± 6.66 t = 0.552 0.581 GLB (g/L) 27.85 (24.83–32.90) 28.70 (25.45–31.30) Z = −0.455 0.649 A/G 1.30 (1.00–1.50) 1.30 (1.00–1.50) Z = −0.279 0.78 ALT (U/L) 0.0028 (20.00–35.75) .0030 (18.5–40.5) Z = −0.943 0.346 AST (U/L) 31.00 (24.00–45.75) 34.00 (24.00–47.00) Z = −0.855 0.392 GGT (U/L) 37.00 (21.00–68.00) 0.0035.00 (20–65.00) Z = −0.412 0.68 ALP (U/L) 88.50 (71.00–119.75) 91.00 (67.00–111.00) Z = −0.397 0.691 TBIL (µmol/L) 20.55 (15.25–28.68) 18.80 (12.05–28.70) Z = −1.359 0.174 AFP (ng/ml) 2.29 (1.57–3.81) 2.60 (1.67–4.42) Z = −1.161 0.246 GP73 (ng/ml) 120.64 (79.98–198.16) 123.91 (82.05–225.58) Z = −0.734 0.463 PVD (mm) 13 (11–15) 13 (11–15) Z = −0.748 0.454 Peak portal flow rate (cm/s) 15.00 (12.45–17.10) 14.20 (12.30–16.75) Z = −1.571 0.116 SW (mm) 55 (44–61) 54 (45–59.5) Z = −0.754 0.451 SPL (mm) 148.80 ± 33.74 146.16 ± 29.83 t = 0.596 0.552 The Child-Pugh classification [example (%)] χ2 = 5.029 0.17 A 65 (51.2) 44 (38.6) B 56 (44.1) 65 (57.0) C 6 (4.72) 5 (4.39) MELD grade 8.15 (6.40–10.22) 8.18 (6.45–10.62) Z = −1.029 0.303 AST/ALT 1.18 (0.90–1.47) 1.14 (0.94–1.53) Z = −0.049 0.961 ALBI 1.70 (1.17–2.43) 1.75 (1.02–3.06) Z = −0.979 0.328Values are expressed as medians with interquartile range (IQR, 25–75%). The P-values of all parameters in the table were all greater than 0.05, there was no significant difference in the baseline data between the two groups.
A/G, albumin/globulin; AFP, alphafetoprotein; ALB, albumin; ALBI, albumin-bilirubin; ALP, alkaline phosphatase; ALT, alanine aminotransferase; AST, aspartate aminotransferase; C-P, Child-Pugh score (A/B/C); GGT, γ-glutamyl transpeptidase; GLB, globulin; GP73, Golgi apparatus protein 73; HB, hemoglobin; MCV, mean corpuscular volume; MELD, model for end-stage liver disease grade; PDW, platelet distribution width; PLT, platelets; PVD, portal vein diameter; RBC, red blood cell; SPL, spleen length; SW, spleen width; TBIL, total bilirubin; WBC, white blood cells.
The PG (160 patients) were further classified into EVH (+) subgroup (75 patients) and EVH (−) subgroup (85 patients). There were significant differences between the EVH+ and EVH− subgroups in WBC, RBC, HB, CV, PLT, PDW, ALB, GLB, PVD, SW, SPL, and ALBI for 28 tested clinical indicators (P < 0.05) (Table 2). Logistic regression analysis with EVH as the dependent variable in univariate analysis further indicated that low PDW and high SPL were independent risk factors for EVH in patients with HBV cirrhosis (P < 0.05; Table 3).
Table 2. - Results of one-factor analysis of the prediction group Characteristic EVH (+) EVH (−) Statistic P-value (n = 75) (n = 85) Male [example (%)] 56 (74.7%) 59 (69.4%) χ2 = 0.544 0.461 Age (year) 52.76 ± 8.56 54.24 ± 9.71 t = −1.013 0.312 BMI (kg/m2) 24.51 (22.04–25.79) 23.73 (21.47–25.74) Z = −0.573 0.567 WBC (109/L) 2.80 (1.92–3.96) 3.55 (2.59–4.59) Z = −2.912 0.004** RBC (1012/L) 3.33 ± 0.73 3.70 ± 0.74 T = −3.152 0.002** HB (g/L) 92.00 (75.00–115.00) 115.00 (92.00–129.50) Z = −3.979 <0.001*** MCV (%) 15.90 (14.70–18.90) 14.60 ((13.50–16.35) Z = −3.925 <0.001*** PLT (109/L) 49.00 (34.00–65.00) 82.00 (51.50–110.50) Z = −5.425 <0.001*** PDW (%) 11.54 (10.30–14.70) 14.10 (12.05–17.00) Z = −4.313 <0.001*** ALB (g/L) 34.52 ± 5.19 36.45 ± 5.86 t = −2.191 0.03* GLB (g/L) 26.70 (24.60–30.60) 29.00 (25.95–34.25) Z = −2.472 0.013* A/G 1.30 (1.10–1.50) 1.30 (1.00–1.50) Z = −0.467 0.64 ALT (U/L) 29.00 (21.00–36.00) .0026 (18.50–35.50) Z = −0.476 0.634 AST (U/L) .0032 (23.00–46.00) .0030 (24.00–45.50) Z = −0.234 0.815 GGT (U/L) .0034.00 (20–67.00) 37.00 (21.50–68.50) Z = −0.617 0.537 ALP (U/L) 86.00 (64.00–116.00) 90.00 (71.50–128.00) Z = −1.115 0.265 TBIL (µmol/L) 22.50 (15.80–30.50) 19.40 (12.45–27.35) Z = −1.554 0.12 AFP (ng/ml) 2.12 (1.51–3.05) 2.31 (1.69–4.90) Z = −1.775 0.076 GP73 (ng/ml) 122.70 (84.21–182.90) 115.90 (79.25–213.24) Z = −0.145 0.884 PVD (mm) 14 (12–16) 12 (11–14) Z = −3.271 0.001** Peak portal flow rate (cm/s) 14.60 (12.30–16.00) 15.10 (12.60–17.45) Z = −1.067 0.286 SW (mm) 59.05 ± 10.20 47.67 ± 11.55 t = 6.569 <0.001*** SPL (mm) 168.45 ± 26.92 131.46 ± 29.45 t = 8.253 <0.001*** The Child-Pugh classification [example (%)] χ2 =5.444 0.142 A 29 (38.7) 46 (54.1) B 43 (57.3) 34 (40.0) C 3 (4.0) 5 (5.9) MELD grade 8.27 (5.89–10.41) 7.76 (6.40–9.97) Z = −0.701 0.483 AST/ALT 1.17 (0.93–1.36) 1.21 (0.88–1.57) Z = −0.162 0.39 ALBI 1.56 (1.08–2.21) 2.02 (1.24–2.86) Z = −2.098 0.036*Values are expressed as medians with interquartile range (IQR, 25–75%). *P < 0.05, **P < 0.01, ***P < 0.001.
A/G, albumin/globulin; AFP, alphafetoprotein; ALB, albumin; ALBI, albumin-bilirubin; ALP, alkaline phosphatase; ALT, alanine aminotransferase; AST, aspartate aminotransferase; C-P, Child-Pugh score (A/B/C); GGT, γ-glutamyl transpeptidase; GLB, globulin; GP73, Golgi apparatus protein 73; HB, hemoglobin; MCV, mean corpuscular volume; MELD, model for end-stage liver disease grade; PDW, platelet distribution width; PLT, platelets; PVD, portal vein diameter; RBC, red blood cell; SPL, spleen length; SW, spleen width; TBIL, total bilirubin; WBC, white blood cells.
Values are expressed as medians with interquartile range (IQR, 25–75%). **P < 0.01.
ALB, albumin; ALBI, albumin-bilirubin; GLB, globulin; HB, hemoglobin; MCV, mean corpuscular volume; PDW, platelet distribution width; PLT, platelets; PVD, portal vein diameter; RBC, red blood cell; SPL, spleen length; SW, spleen width; WBC, white blood cells.
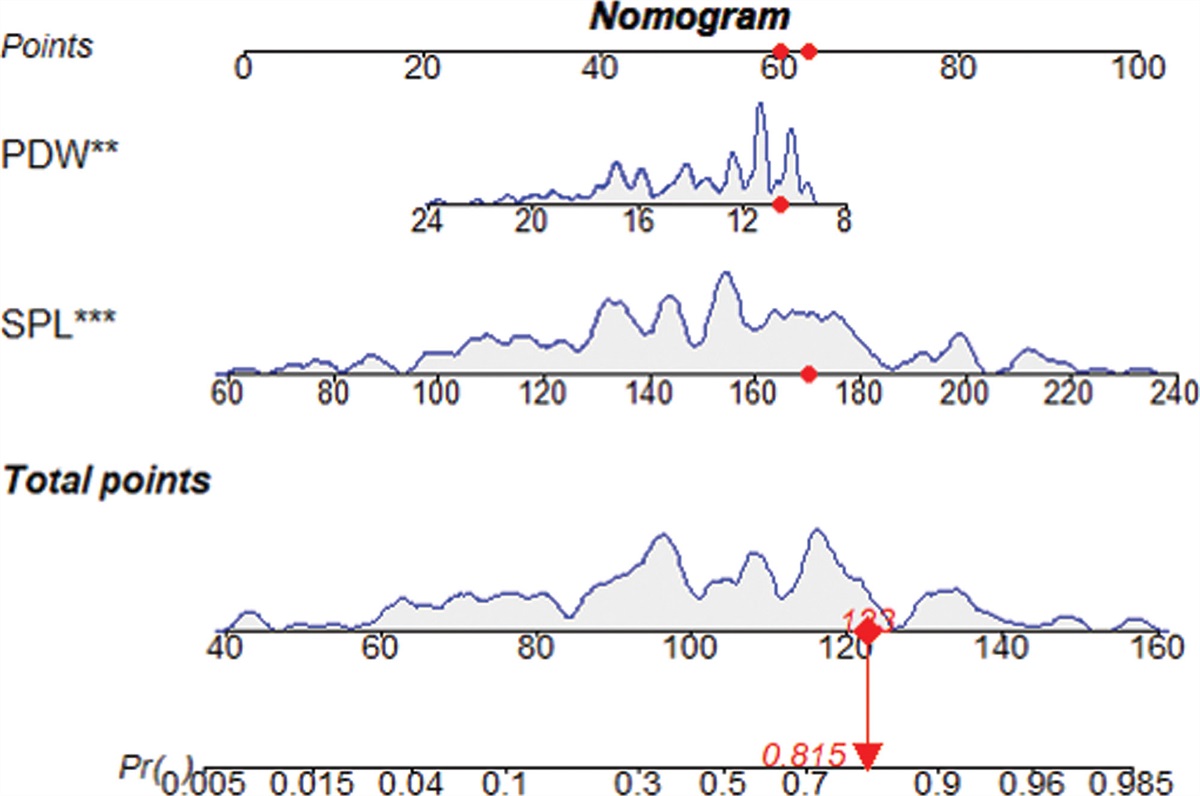
The variables of P < 0.05 in multivariate analysis were included in the nomogram. This nomogram is used to predict the risk of EVB in patients with hepatitis B cirrhosis. The scores of the different variables in the nomogram were added together to obtain the total score, and a line was drawn from the total score axis to the bottom line to determine the probability of combining EVB risks (Fig. 1).
 Fig. 1.:
 Nomogram for predicting the risk of EVH. The levels of platelet distribution width (PDW) and Spleen length (SPL) measured, the corresponding scores and their density plots when assessing the probability of risk of EVH occurrence. Each variable axis has patient-specific points, and each point has a corresponding score; the scores for all variables are summed to obtain the total score, from which the probability of EVH occurrence is calculated for each patient. The red dot in the graph shows a total score of 123 for hepatitis B cirrhosis with a PDW of 10.6% and an SPL of 170 mm, with an 81.5% risk of developing EVH.
Evaluation of nomogramsThe calibration curves of the nomograms in both prediction and the VGs were close to the standard curves, indicating that the nomograms are well calibrated (Fig. 2a and b). The nomogram curves indicated that the NM predicted the EVH risk accurately and reliability (Fig. 2). The AUC score in the nomogram of the PG EVH was 0.842 (95% CI 0.776–0.895), and the AUC of the VG EVH was 0.771 (0.664–0.857) respectively (Fig. 3). Both PG and VG AUC scores in the nomograms were higher than the AUC scores of APRI or FIB-4. Our NM based on spleen length (SPL) and PDW has higher AUC score indicated better accuracy and performance in predicting the risk of EVH in patients with hepatitis B cirrhosis compared to the previous model (Fig. 3). DCA is a graphical tool that allows for the assessment of clinical utilities and strategies by evaluating their net benefit across different P value thresholds. We performed DCA analysis to confirm the clinical value of nomogram in predicting EVH in HBV-induced cirrhosis. We found that the DCA curves of the nomogram of both PG and VG were above the zero net benefit line, indicating that the nomogram achieved clinical benefit. The nomogram DCA curves for both PG and VG were above lines of the existing non-invasive seroprediction models that based on APRI and FIB-4 values (Fig. 4a and b). These findings indicated that nomogram has the advantage to predict the risk of EVH in HBV-induced cirrhosis patients compared to the non-invasive seroprediction models that based on APRI and FIB-4. Based on the nomogram prediction outcomes, it will obtain clinical benefit to take early treatment interventions on the risky EVH patient with HBV-induced cirrhosis.
 Fig. 2.:
 Calibration and correction curves of the nomograms. (a) Calibration curves of the nomograms evaluated by the prediction group; (b) Calibration curves of the nomograms evaluated by the validation group. The red indicates the original calibration curve, and the green represents the corrected calibration curve.
 Fig. 3.:
 Comparison of the diagnostic accuracy between the combination of nomogram and single predictor for the prediction of esophageal variceal hemorrhage. The ROC curve was used to represent the prediction model for hemorrhage using multiple clinical markers, with the AUC indicating the value of the prediction model. (a) Comparison of ROC curves using nomograms, APRI, and FIB-4 to predict EVB in patients in the prediction group. (b) Comparison of ROC curves using nomograms, APRI, and FIB-4 to predict EVB in patients in the validation group. Different colors represent different predictors.
 Fig. 4.:
 Comparison of DCA curves between the nomogram and APRI, FIB4. (a) Comparison of DCA curves between the nomogram model and APRI, FIB 4 in the prediction group. (b) Comparison of DCA curves between the nomogram model and APRI, FIB 4 in the validation group. The gray slash represents the clinical benefit from the intervention in all CHBV patients with EVH. The horizontal black line represents the clinical benefit of all CHBV patients with EVH. Colored line: Clinical benefit from interventions in CHBV patients with EVH derived from the nomogram model, APRI and FIB 4. The red line represents the DCA obtained from the nomogram. The green line represents the DCA obtained from the APRI; Blue color represents the DCA obtained according to FIB 4.
DiscussionChronic HBV infection remains the leading cause of cirrhosis worldwide [17,18]. In 2019, the global number of cirrhosis-related deaths was estimated at 1.472 million, an increase of 10% compared with 2010 [19]. Patients with liver cirrhosis usually have varicose veins in multiple locations where esophageal varices are the most common types [20]. Approximately one-third of patients with cirrhosis die from EVH [21]. About 12–20% of patients with cirrhosis die within 6 weeks of acute EVH, and 60% of patients with cirrhosis may rupture and bleed again within 1 year [5,20,22]. Early screening and intervention measures of HBV-induced cirrhosis patients with high risk of EVH can reduce the EVH-induced damage, improve quality of patient life, and increase the survival rate of HBV-induced cirrhosis patients with EVH. The invasiveness and bleeding risk of endoscopy limit its application in EV screening. In this study, we conducted univariate analysis and multivariate logistic regression analysis based on clinical laboratory test results and imaging parameters of HBV-induced cirrhosis patients. We found that PDW and SPL are independent risk factors for predicting EVH risk in HBV-induced cirrhosis patients. Based on the above risk factors, a prediction model for HBV-induced cirrhosis was established. We established a new non-invasively NM to predict HBV-induced cirrhosis patient EVH risk. This nomogram can accurately predict EVH risk in HBV-induced cirrhosis patients and has a high clinical net benefit.
The PDW is an indicator (presented as a percentage or absolute value) to measure platelet volume distribution. PDW value reflects the degree of variability in platelet size, and the width of platelet volume distribution [23]. PDW is known association with many symptoms including inflammatory, ischemic, and thrombotic [24,25]. For example, there were several reports that high PDW levels was an independent risk factor for gastrointestinal bleeding [26]. The low platelet level and spleen size have been reported as determinants to assess the predictive factors for bleeding in esophageal variceal disease [27]. However, the PDW value association with esophageal variceal bleedings in HBV-induced cirrhosis patients are not well studied. We found that PDW value reduction significantly increased the risk of HBV-induced cirrhosis patients in esophageal variceal bleeding. We speculated that different bleeding sites (gastric variceal or esophageal variceal) may affect PDW value variation outcomes. We hypothesized that in HBV-induced cirrhosis patients with portal hypertension, spleen increased the clearance of platelets, reduced platelet number and subsequently decreased the PDW value. In addition, portal hypertension may also lead to abnormal platelet function, further affecting platelet volume distribution and PDW value. Spleen has a wide variety of functions that may be affected by many conditions including infection, malignancies, and liver disease. Splenomegaly is an enlargement of the spleen. Spleen length (SPL) has been used
留言 (0)