
記住我


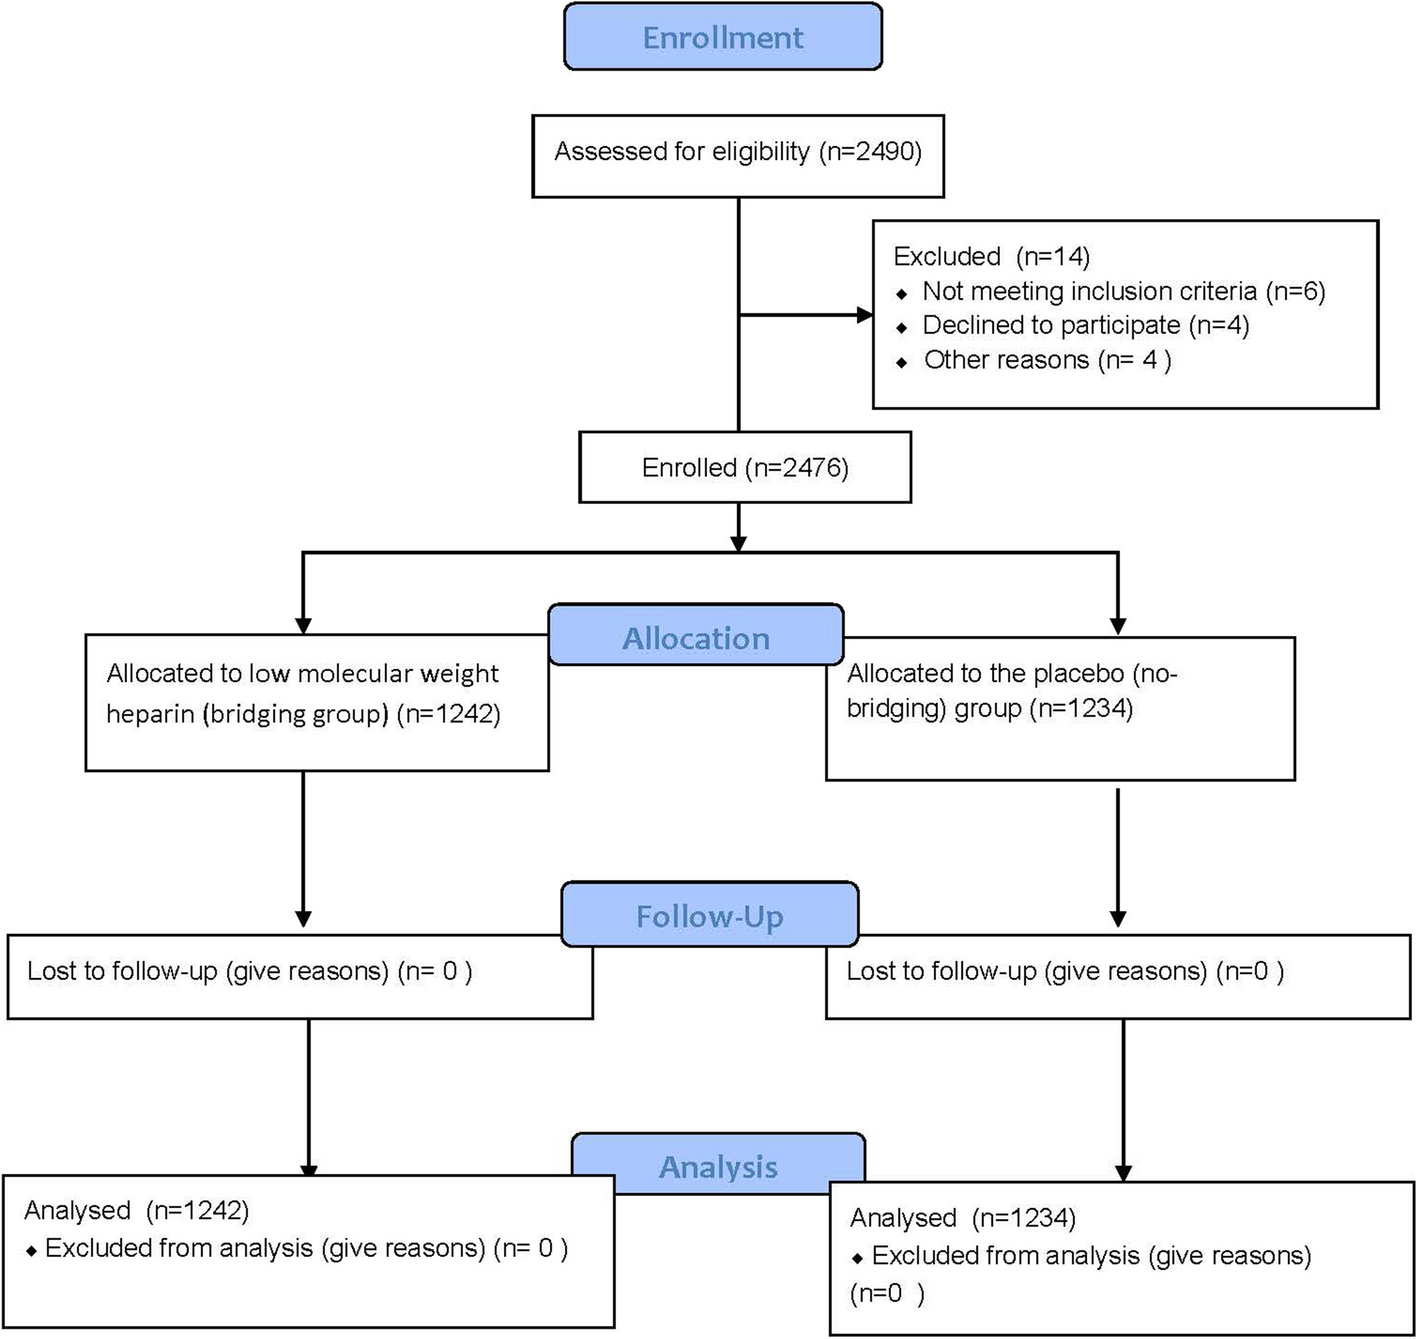

One hundred and eleven patients with advanced NSCLC who met the inclusion criteria were enrolled in this study. A flowchart of the patient inclusion/exclusion process is shown in Fig. 1. The clinicopathological characteristics of the enrolled patients in the different treatment groups are shown in Table 1.
Fig. 1
Flow diagram of patient enrollment
Table 1 Characteristics of enrolled patients in different treatment groups (N = 111)Post-osimertinib treatment, referring to subsequent treatment after osimertinib failure, were classified as following patterns: chemotherapy (n = 45, 40.5%), chemotherapy plus anti-angiogenic therapy (n = 14, 12.6%), chemotherapy plus osimertinib (n = 5, 4.5%), chemotherapy plus immunotherapy (n = 8, 7.2%), osimertinib monotherapy (n = 24, 21.6%), osimertinib plus anti-angiogenic therapy (n = 11, 9.9%), and best supportive care (n = 4, 3.6%). LCT was administered to 20 patients (18.0%) in this cohort. Among the baseline clinicopathological characteristics, a statistical difference was observed only in the source of the biopsy specimens (P = 0.01) between the different treatment groups. No statistical differences were found according to the other characteristics in the different treatment groups.
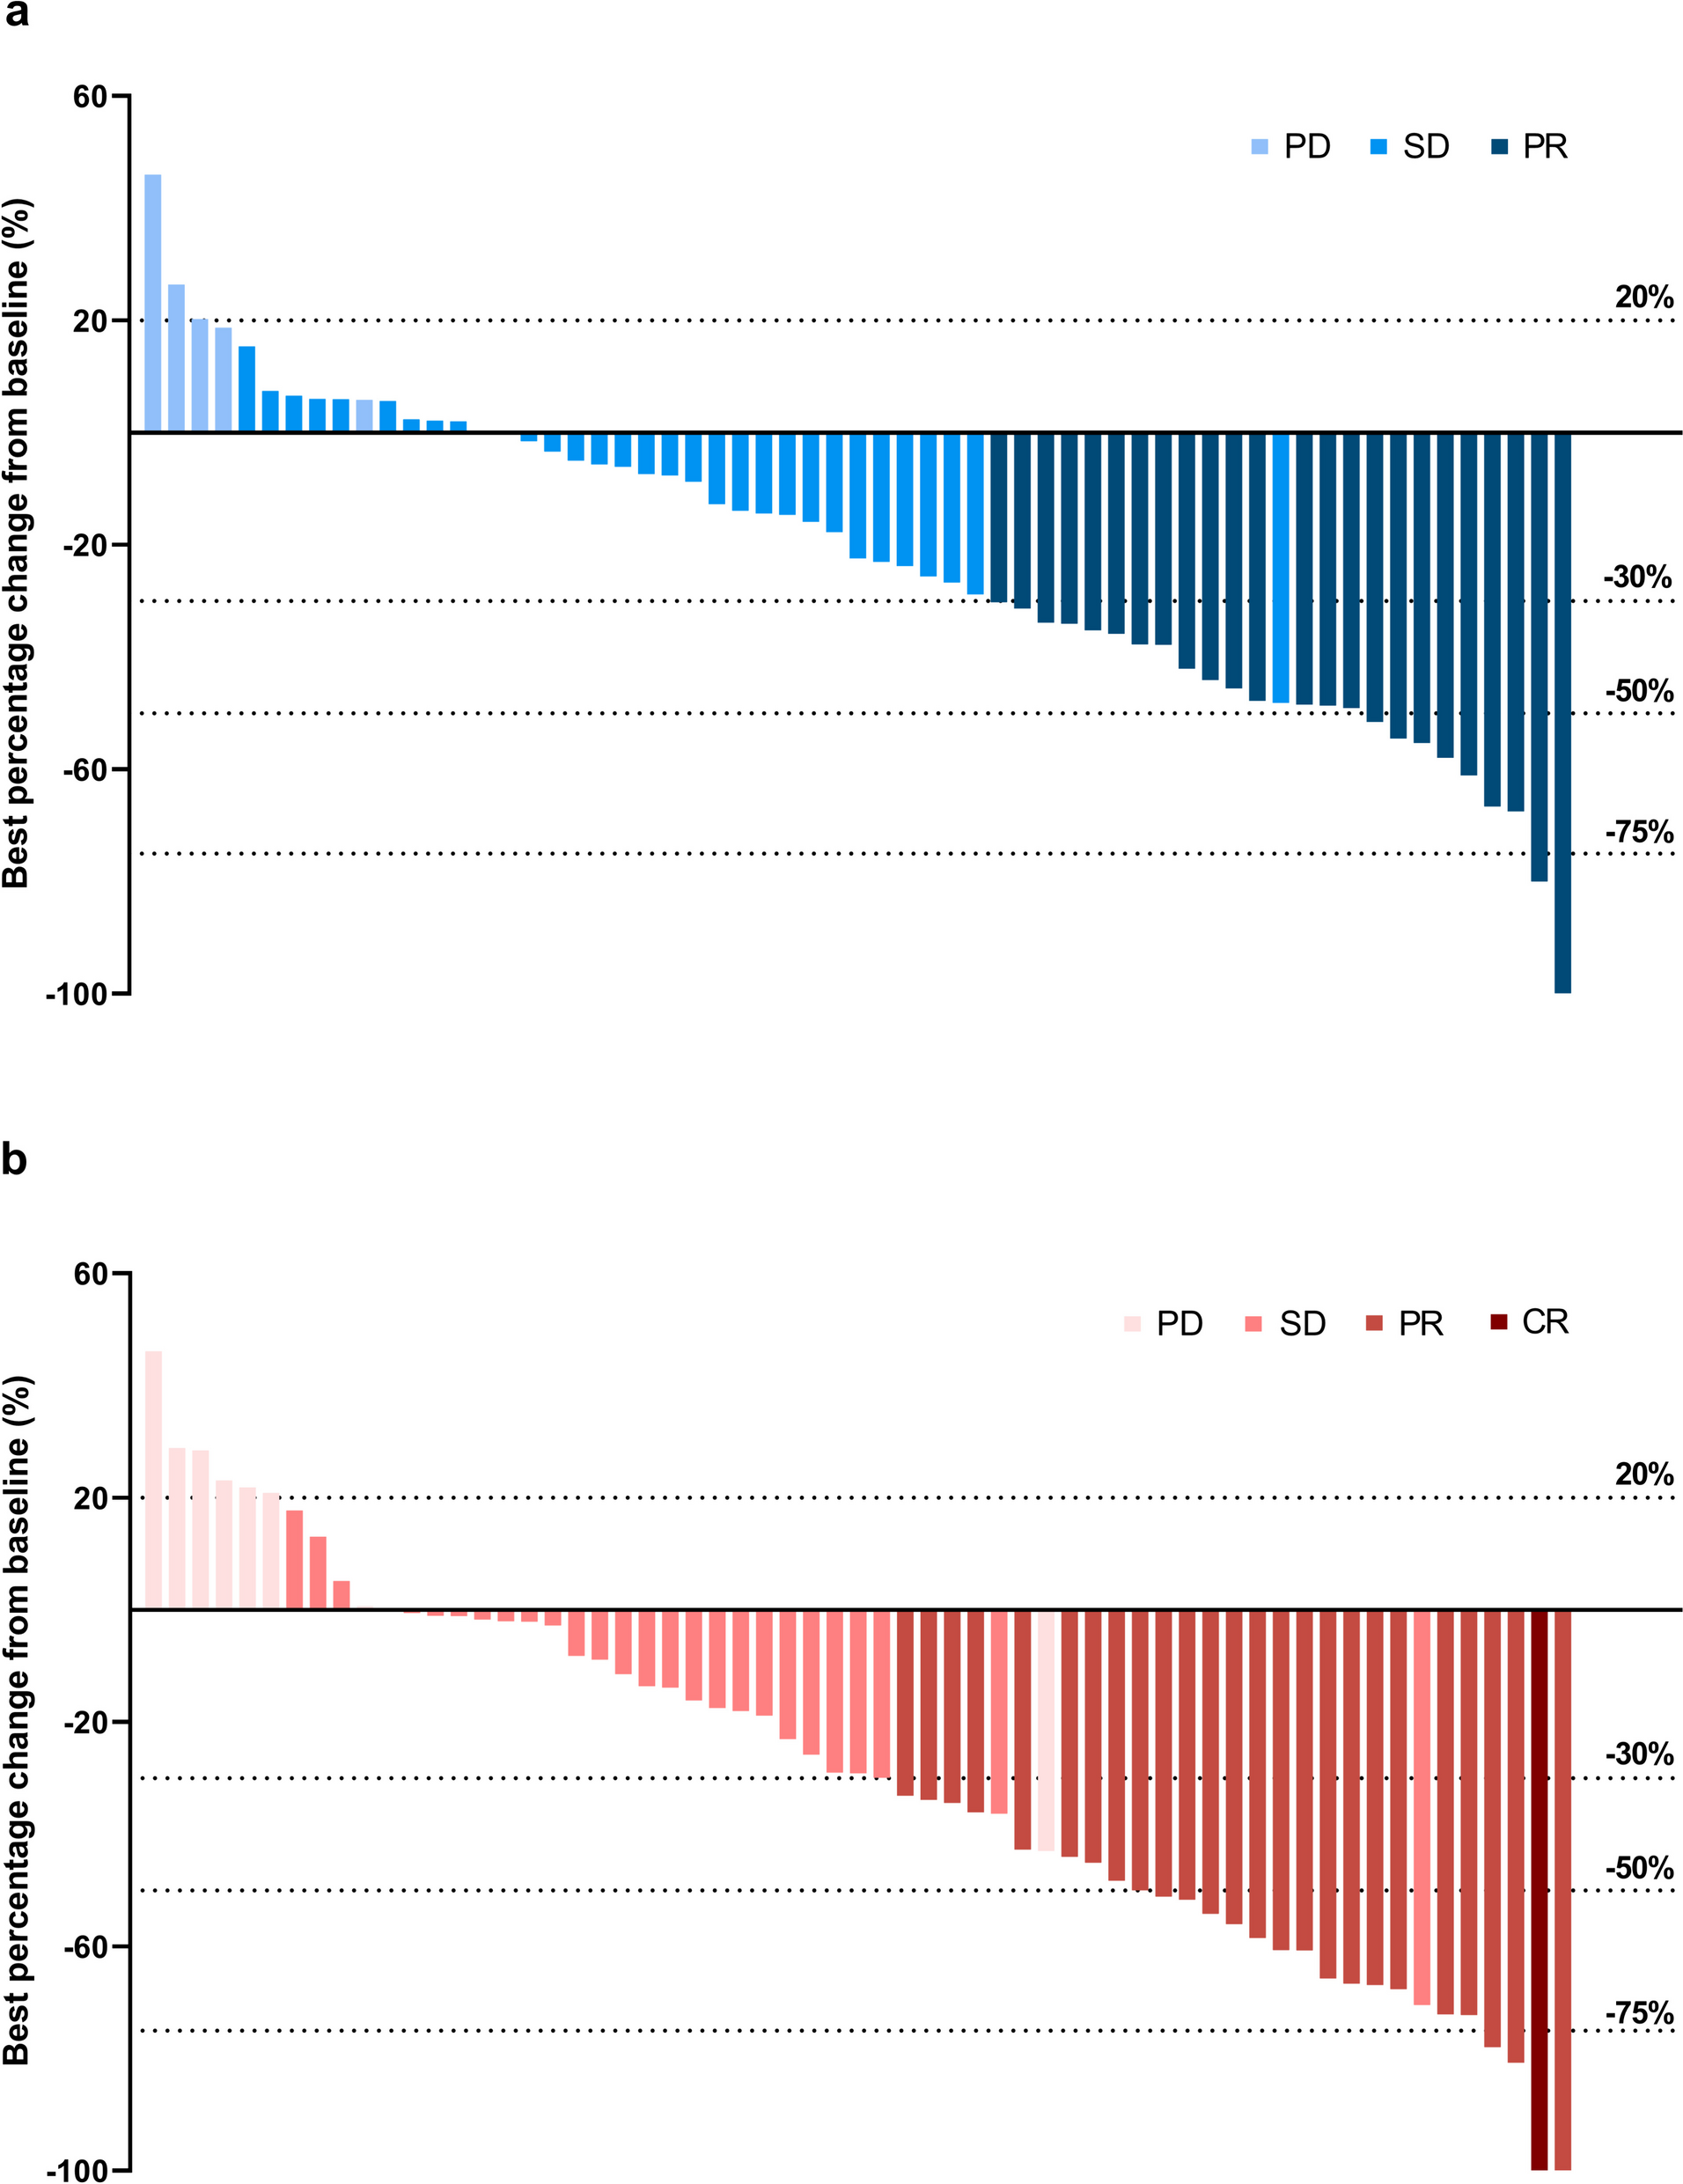
Osimertinib plus anti-angiogenesis therapy demonstrated better prognosis after osimertinib resistanceA summary of the best responses to diverse treatment patterns following osimertinib resistance is presented in Table 2. Regardless of treatment pattern, PR, SD, and PD were the best responses in 30 (27.0%), 66 (59.5%), and 15 (13.5%) patients, respectively. The calculated ORR was 27.0% within the entire cohort and the calculated DCR was 86.5%. Statistically significant differences were found among the different treatment groups in the ORR (P < 0.01) and DCR (P < 0.01). In particular, the group with the best ORR was chemotherapy plus osimertinib (60.0%), and the DCR of chemotherapy plus either osimertinib or immunotherapy (100.0%) was superior to that of other treatment patterns.
Table 2 Summary of the best responses to different post-osimertinib treatmentsThe median duration of follow-up time was 7.6 months. The mPFS duration of and the Kaplan-Meier survival curves of patients undergoing various treatment patterns after osimertinib failure are displayed in Fig. 2A. The mPFS among 111 patients was 6.3 months (95% CI 5.4–7.2 months), and a statistically significant difference was confirmed among the groups (P < 0.001). Specifically, the longest mPFS was 9.84 months (95% CI 7.0–12.6 months) in the osimertinib plus anti-angiogenesis group, and significantly longer than that in the chemotherapy group (5.76 months, 95% CI 4.6–6.92 months, P = 0.012), the osimertinib monotherapy group (4.92 months, 95% CI 3.68–6.16 months, P = 0.003), and the BSC group (1.96 months, 95% CI 0.81–3.11 months, P < 0.001). Moreover, the mPFS of chemotherapy plus anti-angiogenesis was significantly superior to that of chemotherapy plus immunotherapy (6.63 vs. 5.76 months, P = 0.003). To further understand the predictive value of clinical parameters for treatment efficacy, we conducted Cox regression analyses of clinicopathological characteristics associated with mPFS after osimertinib failure using the Cox proportional hazards model. All variables with P < 0.1 in the univariate analysis were further included in the multivariate analysis. The related Cox regression data are presented in Additional file 1: Table S3 and Fig. 2B. Multivariate analysis demonstrated that ECOG PS ≥ 2 (vs. ECOG PS 0–1, P = 0.02), lymph node biopsy specimens (vs. pulmonary tissue, P = 0.02), and BSC as subsequent therapy after osimertinib resistance (vs. chemotherapy, P < 0.01) were independently associated with shorter mPFS. Conversely, chemotherapy plus anti-angiogenesis as subsequent therapy after osimertinib resistance (vs. chemotherapy, P < 0.01) was independently associated with a longer mPFS (Fig. 2C).
Fig. 2
The analysis of mPFS in different post-osimertinib treatment groups. A The mPFS stratified by different post-osimertinib treatment. B Univariate COX regression analysis by baseline characteristics for mPFS. C Multivariate COX regression analysis by baseline characteristics for mPFS
The mOS duration of each patient and the Kaplan-Meier survival curves of patients undergoing diverse treatment patterns after osimertinib failure are presented in Fig. 3A. The median mOS among 111 patients was 12.3 months (95% CI 10.9–13.6 months), and no statistically significant difference was found among the groups (P = 0.23). Similarly, the longest mOS was 16.79 months (95% CI 14.97–18.61 months) in the osimertinib combining anti-angiogenesis group, and significantly better than that in the chemotherapy group (11.0 months, 95% CI 8.9–13.2 months, P = 0.026), the chemotherapy plus osimertinib group (12.1 months, 95% CI 10.1–14.0 months, P = 0.021), the chemotherapy plus immunotherapy group (9.2 months, 95% CI 6.4–12.1 months, P = 0.006), and the BSC group (6.6 months, 95% CI 1.24–12.0 months, P = 0.004). Similarly, Cox regression analysis was performed for mOS (Additional file 1: Table S4 and Fig. 3B). However, none of the parameters showed a predictive effect on mOS in our cohort.
Fig. 3
The analysis of mOS in different post-osimertinib treatment groups. A The mOS was stratified by different post-osimertinib treatments. B Univariate COX regression analysis by baseline characteristics for mOS
Osimertinib combined with anlotinib exhibited promising efficacy in xenograft mice modelsHumanized mice were established and checked for the percentage of hCD45+ in peripheral blood before tumor xenograft (Additional file 2: Fig S1). Tumor-bearing mice generally grew well without GVHDs and significant weight loss of body weight among the groups (Fig. 4A). Compared to the osimertinib-sensitive H1975 engraft (n=2), the growth inhibitory effect of osimertinib on drug-resistant H1975OR tumors (n=2) was significantly weakened (P<0.01) (Fig. 4B,C). In addition, the efficacy of osimertinib combined with anlotinib in H1975OR tumors (n=2) was significantly more robust than that of osimertinib alone (all P<0.05), indicating that combination therapy could effectively inhibit the growth of osimertinib-resistant tumors (Fig. 4B,C).
Fig. 4
Efficacy of osimertinib combined with anlotinib for osimertinib-resistant xenografts in vitro. A The weight curve of humanized mice in each group during treatment. B The tumor volume curve of humanized mice during treatment. C Measurement of fresh xenograft tumor tissues after the mice were euthanized at the end of treatment (*, P<0.05; **, P<0.01)
Alterations in host immunity with the combinational treatment of osimertinib and anlotinibTo clarify the differences in overall immune construction between the osimertinib treating osimertinib-resistant engraft tumors (R-O) group (n=2) vs. the osimertinib treating osimertinib-sensitive engraft tumors (S-O) group (n=2), and the osimertinib plus anlotinib treating the osimertinib-resistant engraft tumors (R-O+A) (n=2) group vs. the R-O group, we analyzed the phenotype and function of T cells, macrophages, and MDSCs in the peripheral blood (Fig. 5A). Overall, there were no significant differences in primary immune cells, including CD45+ cells, CD3+ T cells (including CD4+ T cells, CD8+ T cells, and Foxp3+CD25+ Tregs), CD19+ B cells, and CD11b+ myeloid cells (including CD68+ macrophages and HLA-DR−CD33+ MDSCs) among the groups (Fig. 5B). The proportion of middle-activated CD25+CD8+ T cells was significantly higher in the S-O group than in the R-O group (P<0.05) and R-A group (P<0.05), but was statistically equivalent between the S-O group and the R-O +A groups (Additional file 2: Fig S2A). Meanwhile, there was no difference in the levels of secreted IFN-γ, granzyme B, and the expression levels of immune checkpoints on CD8+ T cells among the groups (Additional file 2: Fig S2A). No significant differences were observed between the M1 and M2 type macrophages (Additional file 2: Fig S2B).
Fig. 5
Flow cytometry of immune cells in peripheral blood of mice demonstrated a successful immune reconstitution. A Gating strategy of lymphocytes including T cells and B cells. Total leukocytes were gated with CD45+, in total lymphocytes were gated with CD3+. Then the CD4+ helper T cells, CD8+ cytotoxic T cells, and CD19+ B cells were then delineated in CD3+ lymphocytes, respectively. Next, CD4+ T cells were further divided into early activation (CD69+), middle activation (CD25+), late activation (HLA-DR+); exhausted (PD1+/CTLA-4+/TIM3+/TIGIT+), as well as immunosuppressive Treg (FOXP3+CD25+) T cells. Similarly, we also applied the above gating strategy in CD8+T cells. In addition, we checked IFN-γ and Granzyme B, which were related to killing functions. B Gating strategy of myeloid cells involving macrophages and MDSCs. Among CD45+ leukocytes, overall myeloid lineage cells were delineated with CD11b+. Total macrophages were gated with CD68+; classically activated M1 macrophages were gated with CD86+; conditionally activated M2 macrophages were gated with CD206+; and immunosuppressive MDSCs were circled with HLA-DR-CD33+. C Comparison of the proportion of major cell components of tumor-infiltrating immune cells in each treatment group
Furthermore, we detected the infiltration of immune cells into the tumor microenvironment. The T cell panel design and gating strategy were the same as those in the peripheral blood (Additional file 2: Fig S3). Here, we additionally detected the cytokines secreted by CD68+ macrophages, including IL-6, TNF-α, IL-10, TGF-β, and VEGF (Fig. 6A). The results are shown in Fig. 6B–D. Compared to the S-O group, the proportion of CD25+ middle-activated, PD1+ exhausted CD4+ T cells was significantly decreased (all P<0.05), and TGF-β secretion by CD68+ macrophages were significantly increased (P<0.001) in R-O group. When compared with the R-O group, combination therapy significantly increased the infiltration of CD4+ T cells (P<0.05), CD25+ activated CD4+ T cells (P<0.001), and the expression of PD-1 on CD8+ Tc cells (P<0.05) in the R-O+A group. There were no differences in the other cell proportions or markers of activation, exhaustion, and function of T cells and macrophages among the groups.
Fig. 6
Flow cytometry detection of infiltrating immune cells in tumors. A In addition to the panel used in blood, we further detected cytokines secreted by CD68+ macrophages in tumors. B Analysis of tumor-infiltrating immune cells. C Comparative analysis of tumor-infiltrating T cells. D Tumor-infiltrating macrophages and their functional analysis
Cellular components and functional annotation in humanized mice xenograft tumorsUMAP plots demonstrated that 40,395 cells from humanized mouse xenograft tumors could be clustered into 12 cell subsets by dimensionality reduction (Fig. 7A). These are (epithelial), endothelial (endothelial), cancer-associated fibroblasts (CAFs), mast cells (MAST), proliferating mast cells (prof. MAST), and monocyte-like macrophages (TAM. mo), microglia-like macrophages (TAM.mg), microglia-like macrophages with high CCL7 expression (CCL7.TAM.mg), CD8+ T cells, and proliferating T cells (pro. T) and CD4+ T cells. TAM account for the most significant proportion of tumor-infiltrating immune cells. Specific marker genes for the cell clusters are shown in Fig. 7B.
Fig. 7
Cell type annotation and function enrichment analysis by scRNA sequencing of tumor tissues. A Cell Clusters Visualization by UMAP dimension reduction analysis. B Specific markers for cell annotation. C Heatmap of Top5 differential genes between cell types. D Function enrichment analyses on DEGs
Top5 differential expression genes (DEGs) in clusters were screened and are shown in Fig. 7C. GO and KEGG pathway enrichment analyses were performed on these DEGs, and most cell functions were similar to those in previous reports (Fig. 7D). Here, we highlighted the functional enrichment of TAM.mg and CCL7. Ribosomes, the cGMP-PKG pathway, the oxytocin signaling pathway, long-term potentiation, and endocytosis were significantly upregulated in TAM.mg. However, MAST, TAM.mo, and monocytes are mainly enriched in phagosome formation, osteoclast differentiation, oxidative phosphorylation, and NOD-like receptor signaling pathways, which are closely related to the recognition of pathogen-associated molecular patterns (PAMPs). Thus, TAM.mg and CCL17.TAM.mg and CCL7.TAM.mg were distinguishable from classical monocytes and macrophages, which seemed to play a similar promoting function on neural pathways with microglia.
Cellular compartment, function, and communication dynamics between the R-O vs. the S-O groups and the R-O+A vs. R-O groupRegarding the cell components between the R-O and S-O groups, CD4+ T, CD8+ T, and pro. T in the S-O group were more abundant than those in the R-O group, whereas all types of TAMs in the R-O group were higher than those in the S-O group (Fig. 8A). With the addition of anlotinib, CD8+ T cells, pro. T, CCL7_TAM.mg in the R-O+A group was higher than that in the R-O group, while TMA.mo and monocyte were lower (Fig. 8A).
Fig. 8
Differences in TME between R-O and S-O groups and between R-O+A and R-O groups. A The relative abundance of cell components was compared. B Differences in cell communication among the above cells. C Differences in function enrichment in those cell types
Regarding intercellular communication, TAM.mo and monocytes showed increased communication with other cells. Interactions of T cells with other cells were decreased in the R-O group compared to those in the S-O group (Fig. 8B). Comparing cell communications of the R-O+A and R-O groups, most cell-to-cell interactions were upregulated in the R-O+A group (Fig. 8B).
Compared to the S-O group, the DEGs of monocytes in the R-O group were mainly upregulated and involved in the complement and coagulation cascades, lysosomal components, antigen processing, presentation functions, and IL-17 signaling pathways (Fig. 8C). Downregulated DEGs in the R-O group were mainly enriched in the ribosome, focal adhesion, ECM receptor interaction (epithelial), lysosome (CD4+ T), and viral proteins interacting with cytokines (TAM.mo) (Fig. 8C). However, the number of DEGs, mainly in TAM.mo, was downregulated in the R-O+A group compared with that in the R-O group (Fig. 8C). The DEGs of macrophages were mainly enriched in the TNF and IL-17 signaling pathways, Toll-like receptors, NOD-like receptors, and C-type lectin receptor signaling pathways associated with innate immune PAMP recognition. A similar downward trend was observed for monocytes. On the other hand, the upregulated DEGs in the R-O group were mainly enriched in the ECM receptor function and tight junction function of CAFs and epithelial cells and the antigen processing and presentation of the pro. T cells (Fig. 8C).
As mentioned above, the differential proportion and function of immune cells in the TME between the different groups were mainly concentrated in T cells and TAMs. Thus, we further analyzed the subtypes of T cells and TAMs.
The combination of osimertinib and anlotinib promoted cytotoxic T cell infiltrationT cells were further clustered into eight subtypes according to their specific marker genes (Fig. 9A) and could be classified into five categories: cytotoxic, exhausted, naive, NK, and Treg (Fig. 9B). Interestingly, all annotated subtypes of T cells in the R-O group were fewer than those in the S-O group (Fig. 9C), whereas with the combination of anlotinib, the number of 1_CD8. CY, 6_CD8. CY, CD8. The number of NK and CD8 cells in the R-O+A group was higher than that in the R-O group (Fig. 9C). Compared to the S-O group, the functional enrichment of DEGs in the R-O group was mainly downregulated in CD8. NK, 0_CD8. CY and 6_CD8. CY were mainly enriched in the T cell receptor signaling pathway, Th1 and Th2 cell differentiation, and PI3K-Akt signaling pathways (Fig. 9D). Meanwhile, the upregulated DEGs in the R-O+A group were mainly related to apoptosis, leukocyte transendothelial migration, tight junctions, and other functions of 0_CD8. The CY subtype was compared with the R-O group (Fig. 9D).
Fig. 9
T cells subtype analysis between R-O and S-O groups and between R-O+A and R-O groups. A T Cell subtype cluster visualization by UMAP dimension reduction analysis. B Function clusters of specific markers for subtype annotation. C The relative abundance of various subtype T cell components was compared. D Differences in function enrichment were noted in those cell subtypes
Suppressive immune microenvironment primed by macrophagesMacrophages clustered into ten subtypes (Fig. 10A), according to four specific marker genes: regulation, cytokine secretion, cell stimulation, and surface markers (Fig. 10B,C). The proportions of monocyte-derived IL1β secreting TAM (IL1β.mo) and monocyte-derived CCL18 secreting TAM (CCL18.mo) in the R-O group were higher than those in the other three groups. These two subtypes have low expression of the M1 surface marker (CD86) and high expression of M2 surface markers (MRC1 and CD163) (Fig. 10B,C). Moreover, we noted that they were both highly expressed along with VEGFA.
Fig. 10
Macrophage subtype analysis between R-O and S-O groups and between R-O+A and R-O groups. A Macrophage subtype cluster visualization by UMAP dimension reduction analysis. B Function clusters of specific markers for M1 type macrophage annotation. C Function clusters of specific markers for M2 type macrophage annotation. D The relative abundance of various subtype macrophages was compared. E Differences in function enrichment in those cell subtypes were also noted
Furthermore, we compared the proportion and function of macrophage subtypes between the two groups (R-O vs. S-O, R-O+A vs. R-O). The number of macrophage subsets in the R-O group was higher than that in the S-O group, especially proliferating (pro.TAM) microglia-like macrophages with a high expression of S100A4 (S100A4.mg), CCL18.mo, and IL-1β.mo (Fig. 10D). We also noted that the number of pro.TAM, CCL18.mo, and IL-1β.mo in the R-O+A group were lower than those in the R-O group (Fig 10D).
Furthermore, compared to the S-O group, the upregulated DEGs on pro.TAM in the R-O group were related to the lysosome, complement, and coagulation cascade. The upregulated DEGs of S100A4.mg and CCL18.mo were mainly related to the IL-17 signaling pathway, whereas upregulated DEGs were related to CCL18.mo and IL-1β.mo was associated with TNF signaling (Fig. 10E). When comparing the R-O+A group with the R-O group, the DEGs were mainly downregulated and enriched in IL-17, toll-like receptors, and TNF signaling pathways. In addition, the downregulated DEGs in other macrophage subsets were related to lysosomes (Fig. 10E).
留言 (0)