
記住我

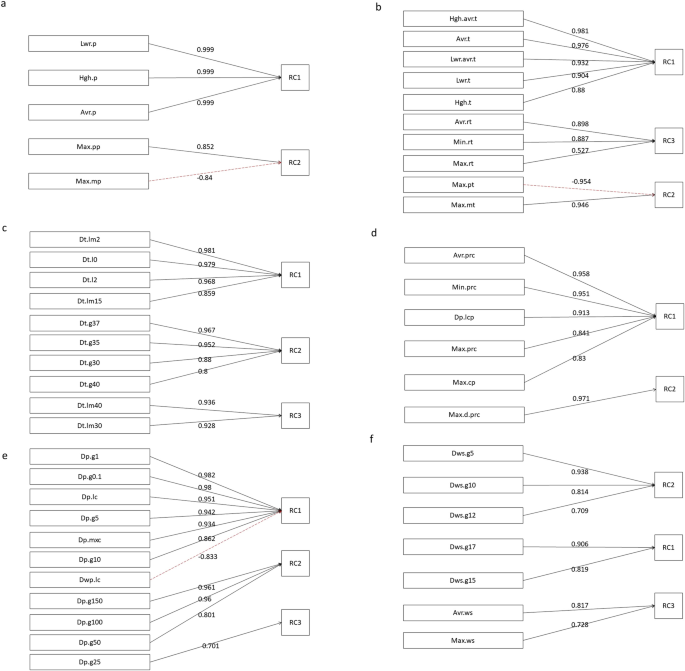

The principal component analysis of the basic indicators of atmospheric pressure revealed that two composite indicators could explain more than 90% of the variance in the original five basic indicators (Supplementary Table 2 and Fig. 1a). RC1 represented the basic atmospheric pressure condition, recorded as atoms_Val, while RC2 represented the difference between the positive and negative atmospheric pressure anomalies, recorded as atmos_an.
Fig. 1: Component analysis of meteorological factors.
a–f represents the principal component analysis of atmospheric pressure factors, temperature measurement factors, temperature duration factors, precipitation measurement factors, precipitation duration factors, wind factors.
Composite indicators of temperatureThe basic temperature indicators were divided into two categories. The first category included indicators of temperature measurements, with three composite indicators extracted via the principal component analysis(Supplementary Table 2 and Fig. 1b). In this analysis, RC1 represented the basic temperature condition, recorded as temp_Val, RC2 represented the difference between the negative and positive temperature anomalies, recorded as temp_anom, and RC3 represented the daily temperature range, recorded as temp_DRg. The second category included temperature duration indicators, with three composite indicators extracted via the principal component analysis(Supplementary Table 2 and Fig. 1c). In this analysis, RC1 represented the duration index of cold days monthly, recorded as CldD (i.e., the comprehensive index of days with temperatures not exceeding 2 °C, 0 °C, –2 °C, and –15 °C). Similarly, RC2 represented the duration index of extremely hot days monthly, recorded as ExtrHtD (i.e., the comprehensive index of days with temperatures not less than 30 °C, 35 °C, 37 °C, and 40 °C). Lastly, RC3 represented the duration index of extremely cold days monthly, recorded as ExtrCldD and reflecting the comprehensive index of days with temperatures not exceeding –30 °C and –40 °C.
Composite indicators of precipitationThe basic indicators of precipitation were divided into two categories. The first category included precipitation measurements, with two composite indicators extracted using principal component analysis (Supplementary Table 2 and Fig. 1d). In this analysis, RC1 represented the monthly precipitation index, recorded as prec_Val_M, while RC2 represented the daily precipitation index, recorded as prec_Val_D. The second category included indicators of precipitation duration, with three composite indicators extracted using principal component analysis(Supplementary Table 2 and Fig. 1e). In this analysis, RC1 represented the duration index of monthly rainy days, recorded as Rainy_Ds and reflecting the comprehensive index of rainy days. RC2 represented the monthly rainstorm days index, recorded as rainform_Ds and reflecting the comprehensive index of days with daily precipitation levels not less than 50 mm, 100 mm, and 150 mm. RC3 represented heavy rain days index monthly, recorded as Hv_Rny_Ds and reflecting the comprehensive index of days with daily precipitation of not less than 25 mm.
Composite wind indicatorsIn the principal component analysis, three composite indicators could be extracted from the basic indicators of wind factors (Supplementary Table 2 and Fig. 1f). In this analysis, RC1 represented the fresh breeze days index monthly, recorded as Fsh_brz_Ds and reflecting the comprehensive index of days with wind speeds of not less than 15 m/s and 17 m/s. RC2 represented the monthly gentle breeze days index, recorded as Gt_brz_Ds and reflecting the comprehensive index of days with wind speeds not less than 5 m/s, 10 m/s, and 12 m/s. RC3 represented the basis of wind speed, recorded as Wnd_spd_val and reflecting the comprehensive index of average and maximum wind speeds.
Effective composite indicators and characteristic indicatorsAll the composite indicators mentioned above are of particular realistic significance (Table 1). The single-factor linear regression analysis revealed a significant linear relationship between the natural logarithm of AE prevalence and the following, which were thus identified as effective composite indicators: atoms_Val, atmos_an, temp_Val, temp_anom, CldD, ExtrHtD, ExtrCldD, prec_Val_M, prec_Val_D, Rainy_Ds, rainstorm_Ds, Gt_brz_Ds, Fsh_brz_Ds, Wnd_spd_val, DEM respectively (Table 2). Among these, atoms_Val, atmos_an, temp_Val, and ExtrHtD were negatively correlated with the natural logarithm of AE prevalence. In contrast, temp_anom, ExtrCldD, prec_Val_M, prec_Val_D, Rainy_Ds, rainstorm_Ds, Gt_brz_Ds, Fsh_brz_Ds, Wnd_spd_Val, and DEM were positively correlated with the natural logarithm of AE prevalence (Table 2, Supplementary Fig. 1, Supplementary Fig. 2). These 15 effective composite indicators were used as characteristic indicators.
Table 1 The meanings of the composite indicators.Table 2 Single-factor linear regression analysis.Key indicatorsIn the 10-fold cross-validation, the λ corresponding to the minimum of the mean error of the LASSO regression was 0.01484477 (Supplementary Fig. 3). In the LASSO regression model based on λ, the variables with non-zero coefficients were atmos_an, temp_Val, temp_anom, CldD, ExtrHtD, prec_Val_M, Fsh_brz_Ds, and DEM, all of which were used as key indicators (Table 3).
Table 3 Coefficients of the LASSO Regression.Establishment of a three-level indicator systemBy calculating and screening the key indicators, characteristic indicators, and related basic indicators, we established a three-level indicator system. This Key-Characteristic-Basic Indicator System (KCBIS) included 50 basic indicators, 15 characteristic indicators, and 8 key indicators (Supplementary Fig. 4). Obviously, the 50 basic indicators could be directly observed at meteorological stations, the 15 characteristic indicators could be produced by linear combination of the basic indicators and showed a linear relationship with AE epidemic, and the 8 key indicators were characteristic indicators with clearer relationships and fewer mixed effects.
Analysis of relative weights for key indicatorsIn the analysis of relative weights for key indicators, we observed a positive correlation between the natural logarithm of AE prevalence and the following, with sequential decreases in the relative weight of each: prec_Val_M, CldD, temp_anom, DEM, Fsh_brz_Ds. Similarly, we observed negative correlations between the natural logarithm of AE prevalence and temp_Val, atoms_an, and ExtrHtD, again with sequential decreases in the relative weight of each (Fig. 2).
Fig. 2
The result of analysis of relative weights for key indicators.
Classification of epidemic levels for Echinococcus multilocularisWhen divided into 6 categories based on the natural logarithm of AE prevalence, prevalence (levels 1–6), the goodness of classification for R2 reached over 95% (Supplementary Fig. 5). The AE prevalence rates represented by levels 1~6 are ~0.01%, ~0.05%, ~0.15%, ~0.38%, ~1.73%, and 1.73%~, respectively (Supplementary Table 3).
Model establishment and comparisonThe multivariable linear regression model and the stepwise regression model, the multinomial logistic regression model, the naive Bayesian classification model, and the CART model was established (the parameters showed in Supplementary Tables 4, 5, 6, and Supplementary Fig. 6 respectively). Among the models compared, the CART model had the highest accuracy, sensitivity, and specificity values, and the multinomial logistic regression model had the highest precision value and F1-Score. According to accuracy and F1-Score, the best predictor for levels 1, 3, 5, and 6 was the multinomial logistic regression model, while the best predictor for levels 2, 4, and 5 was the CART model (Table 4).
Table 4 Comparison of model performance.
留言 (0)