
記住我
We sequenced the genomes of 328 samples over eight years from various body sites, including urine culture (UC) (n = 59) and blood culture (BC) (n = 124) and other sources (n = 140) (Supplemental Figure S1A), taken from 239 patients. The collection demonstrated high diversity, comprising 34 different STs. From 54 patients more than one strain was recovered. In 11 patients, strains from more than one ST group were isolated from the patients. Moreover, in 22 patients, strains with the same ST were recovered from different body sites, showing the extent of within-host diversity and cross-infection. Four STs had more than ten isolates in the collection (ST11 n = 13, ST101 n = 14, ST14 = 45, ST2096 n = 120), which altogether constituted 58% of total population. K-locus diversity shows correspondence of dominant K17, K64, K47, and K2 loci at the frequencies of 100% (14/14), 99% (119/120), 77% (10/13), and 98% (44/45), in ST101, ST2096, ST11, and ST14, respectively. The STs’ absolute and relative frequencies (absolute frequency divided by total absolute frequencies) exhibited variations over time (Supplemental Figure S1B). In 2014 and 2015, ST14 was the most prevalent ST, and it was still detectable in 2022. ST2096 strains were detectable in 2015 and constituted most of the collection in 2016, 2017, and 2018 but declined in 2020. ST101 strains were only detected in 2017 and 2018, while ST11 was first detected in 2020. All dominant STs had been previously reported in outbreaks in Europe and Asia [52,53,54,55]. We extracted the epidemiological clusters (see “Methods”) from the Pathogen Detection database to reveal the recent links between the collection and the global population. We found five STs, i.e., ST307, ST14, ST985, ST2096, and ST101, to be part of broader epidemiological clusters (SNP clusters) (Supplemental Figure S1C). While few environmental strains were found in the ST307 and ST101 clusters, the other strains originated from clinical settings across countries on different continents, indicating that our collection is part of globally circulating clinical clones (Supplemental Figure S1C).
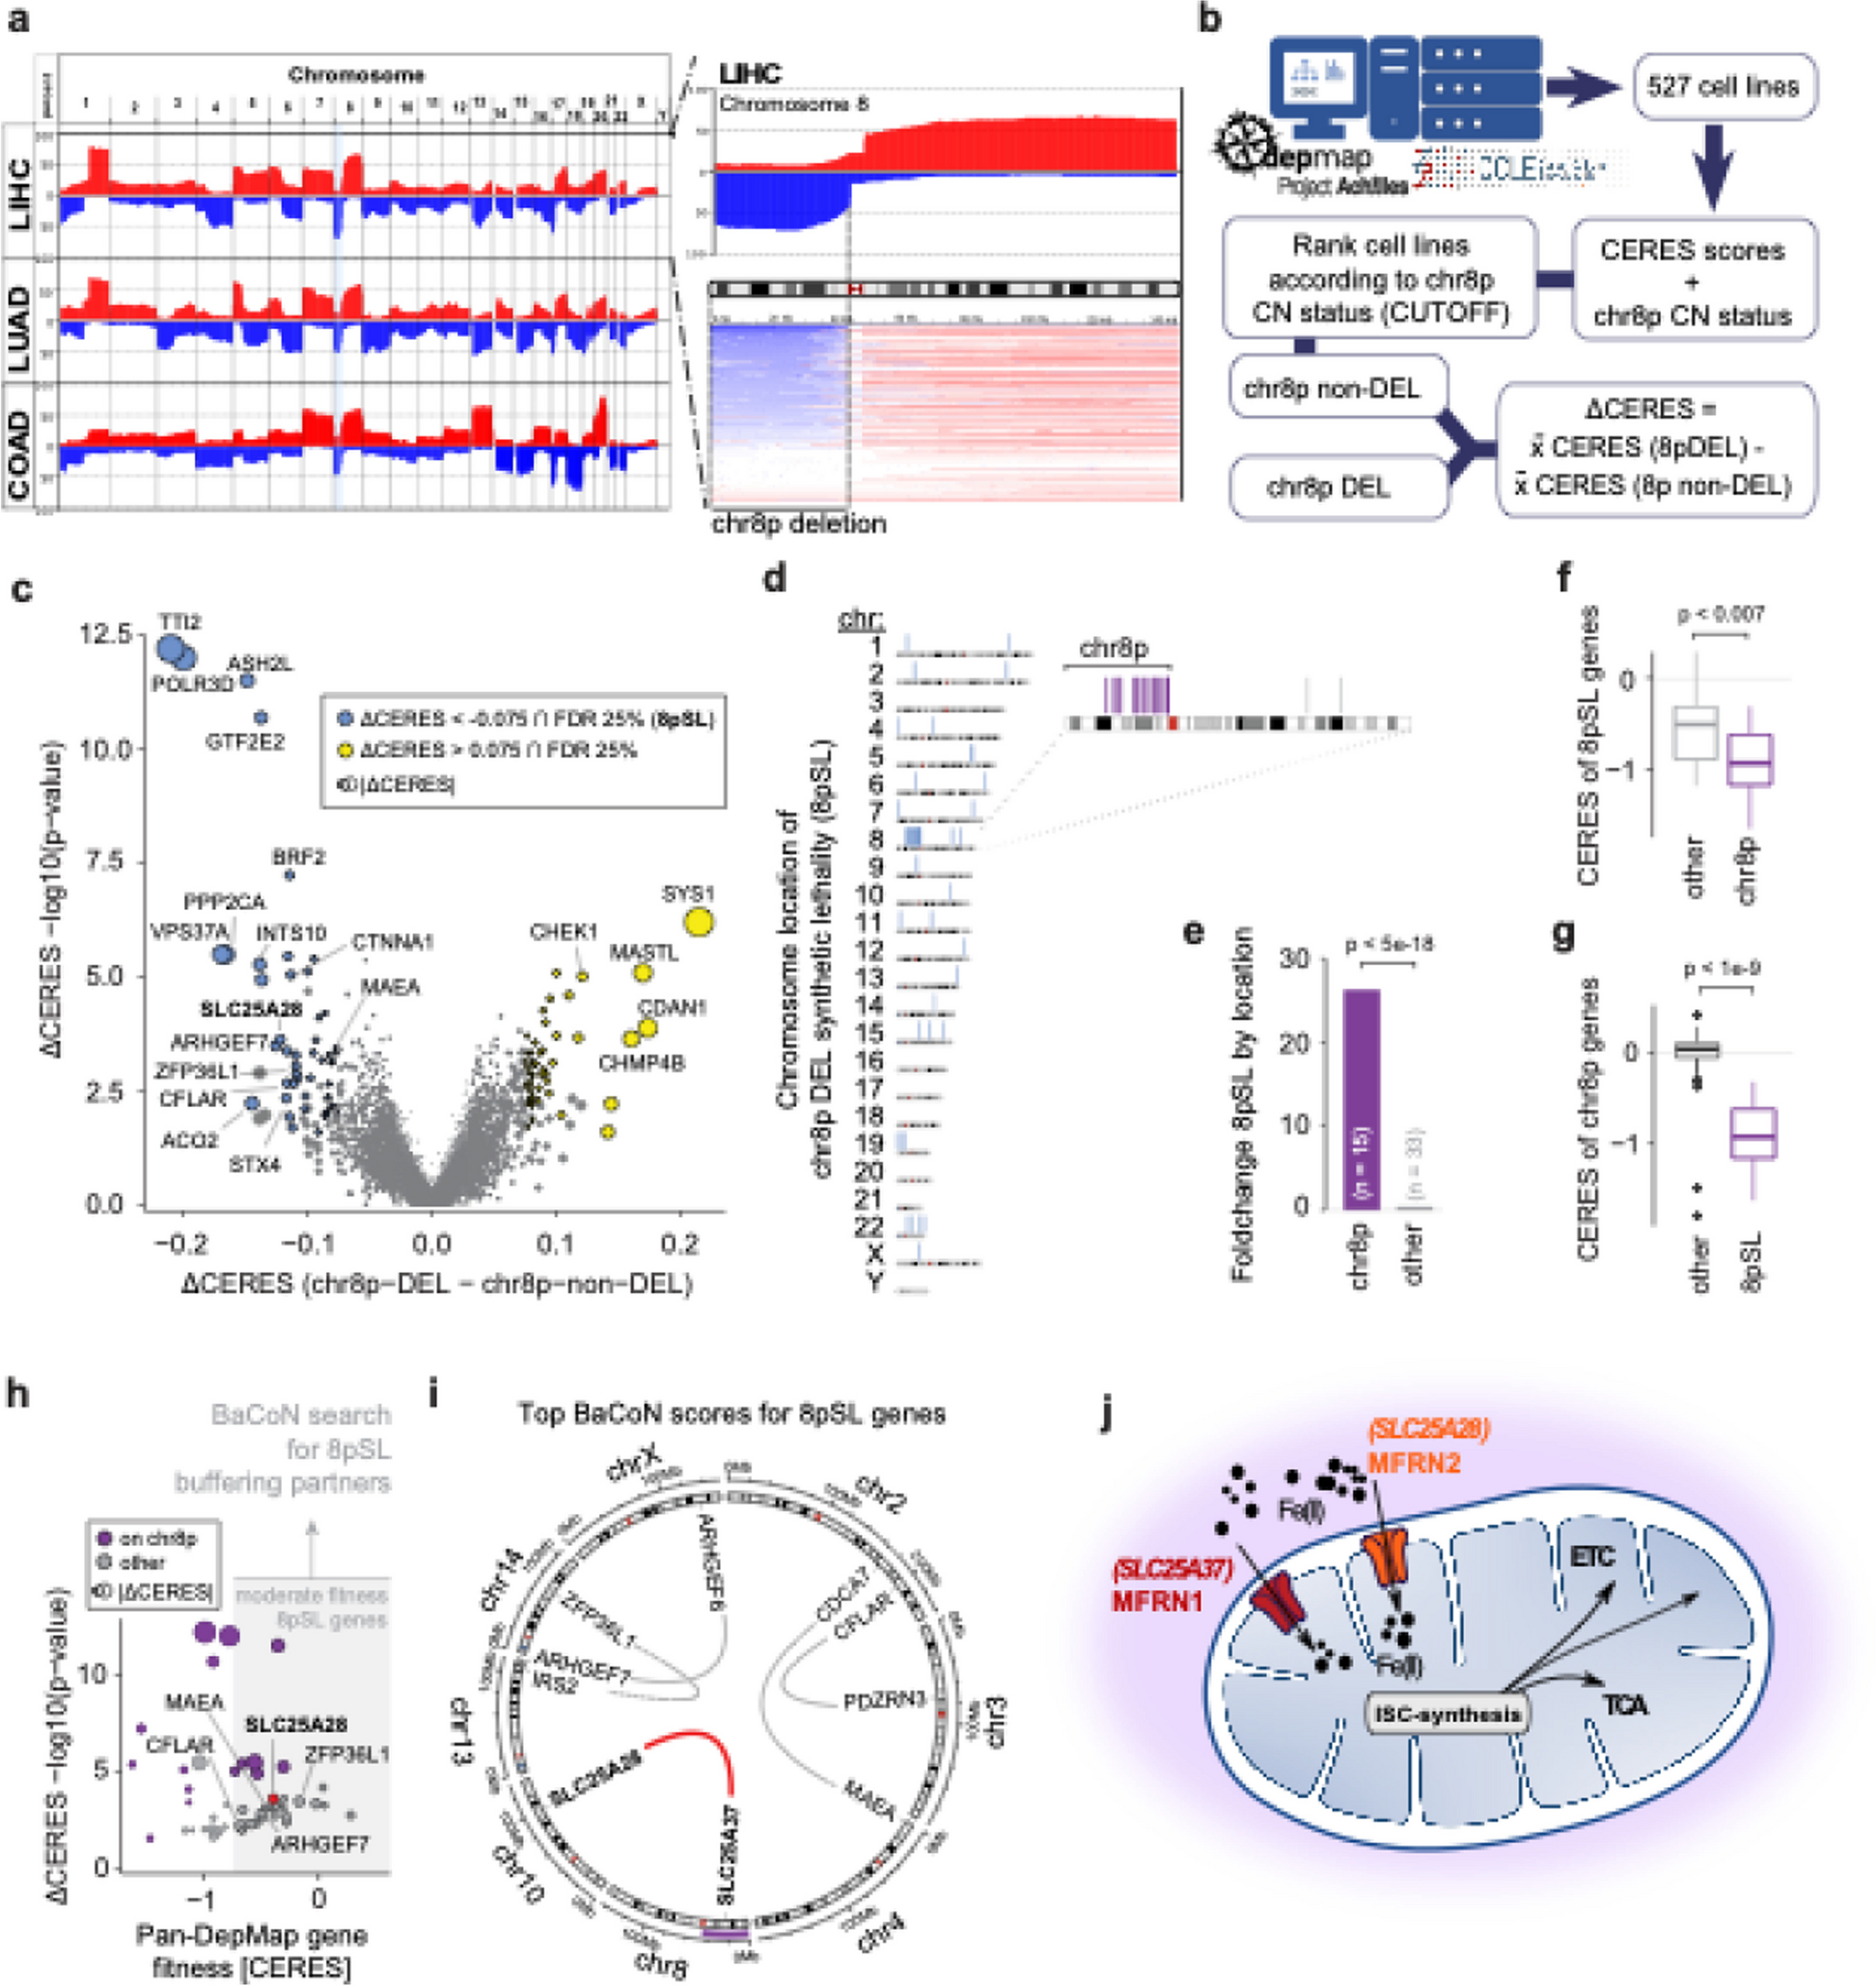
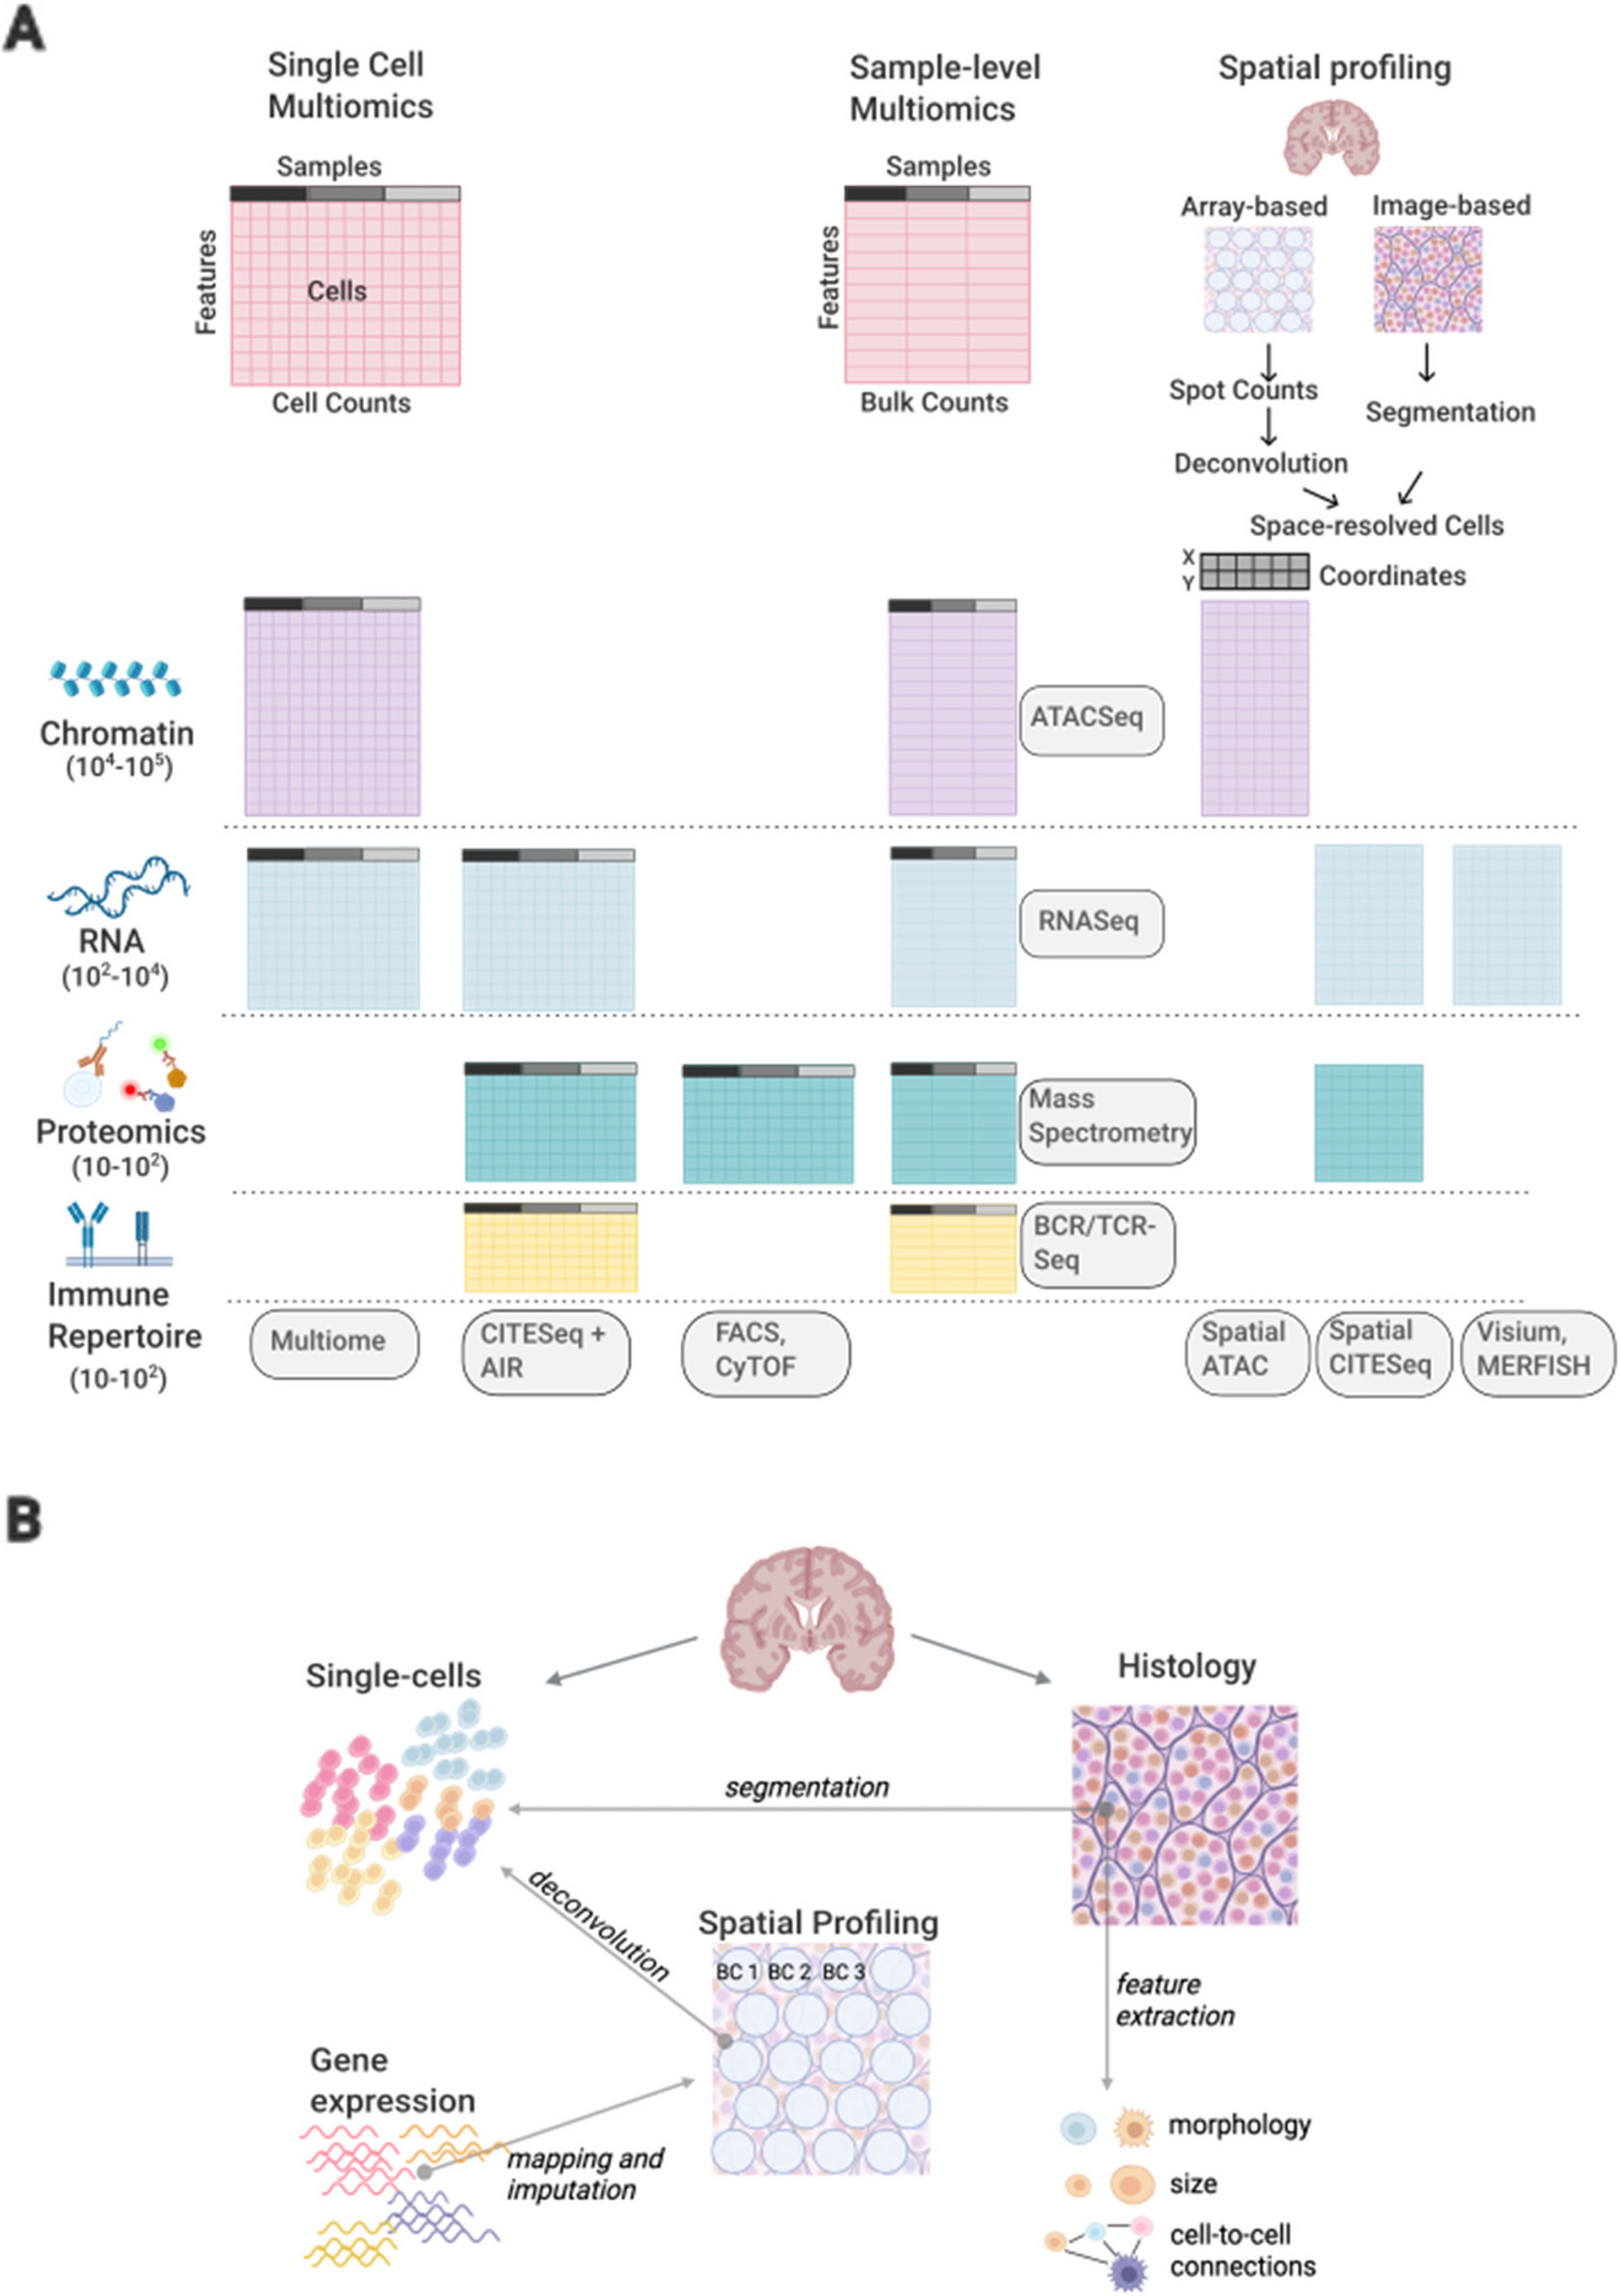
Phylogenetic tree structure and epidemiological features of major clonesThe phylogenetic tree for the 328 K. pneumoniae samples under study implies a diverse population underlying the infections in the hospital, with some lineages undergoing recent clonal expansion (Fig. 1). A total of 282,207 SNP sites were found in the collection after mapping to the reference genome. The major clones of ST2096 (8801 SNPs/73.34 SNPs per isolate/3% of total SNPs), ST14 (10,076 SNPs/223.91 SNPs per isolate/4% of total SNPs), ST11 (10,591 SNPs/814.69 SNPs per isolate/4% of total SNPs), and ST101 (4438 SNPs/317 SNPs per isolate/2% SNP per isolate) constituted major clones. The expanding CC14 clones belonging to STs, i.e., ST14 and ST2096, had a lower SNP count per isolate value and contained a smaller portion of total population variation (p-value from proportion test < 0.001), compared to ST11 and ST101 (Fig. 1). The distribution of epidemiological features for major STs implies that ST2096 formed more recently than other ST11 and the other sister CC14 clade of ST14 (Fig. 1, Figure S2A), as the 95% HPD interval were not overlapping for the estimated most recent common ancestor (MRCA) ages for the clones. Despite a comparable population size for ST2096 compared with other major STs (ST14, ST11, and ST101), the ST2096 showed a lower transmission rate than all other STs and lower clock rates than ST14 and ST11 (Figure S2A).
Fig. 1
Phylogenetic tree of the collection and the metadata. The neighbor-joining tree for 328 genomes under study. The tree was reconstructed from the pairwise sequence (SNP) distance values, by ape package in R. The SNPs were called with Snippy (see “Methods”). We rooted the tree using midpoint rooting. The resistance profile shows the distribution of major resistance determinants, i.e., Carb (carbapenemase), ESBL, AGly (aminoglycosides), Flq (fluroquinolone), and Tet (tetracyclines) (see Supplemental Table S1 for the full list of resistance determinants). The virulence and resistance scores were computed from Kleborate, based on the presence of key virulence and resistance determinants (see “Methods”) [27]. Numbers on the distributions of virulence score and count of resistance genes and classes and resistance score show the absolute value. The terms “mut” and “acq” stand mutations and acquired resistance genes, respectively. The coverage strips show the percentage of sites of the plasmid sequences to which short reads for each strain were mapped
Resistance against multiple antimicrobial classes is commonOur collection of 328 isolates showed a high level of resistance against different classes of antimicrobials. The phenotypic results revealed that across different STs, 72%, 90%, 87%, 90%, and 58% were resistant to aminoglycosides, β-lactams, trimethoprim, ciprofloxacin, and colistin, respectively (Figure S3A). Among the dominant STs, except for ST11, which is susceptible to colistin and tigecycline, a high resistance level was consistently observed across different STs. The prevalence of ESBL genes among the isolates was 58%, which varied across major STs (ST2096: 65%, ST14: 44%, ST11: 69%, ST101: 84%). The most common ESBL gene was blaCTX-M-15 (n = 186/328, 56%). Carbapenem resistance genes occurred in 62% of the strains, with prevalent STs mostly harboring the genes (ST2096: 0.85, ST14: 0.59, ST11: 1.00, ST101: 0.93). Carbapenem resistance genes differed between the clones: for ST2096 strains, blaOXA-48 (21/99) and blaOXA-232 (78/99) were prevalent. blaOXA-48 was the dominant carbapenemase in ST101 (12/14). In contrast, for ST14, blaNDM (21/45) and for ST11 blaKPC-2 (ST11: 9/13) were most prevalent. The integration of genotype and phenotypes for resistance results show significant odds ratio values greater than 1 (95% confidence interval above one) for 4 groups, 5 groups, and 4 groups of β-lactams for acquired β-lactams (other than ESBLs and carbapenemase), acquired carbapenemases, and ESBL genes, respectively (Figure S4A). The presence of acquired β-lactams (other than ESBLs and carbapenemase), acquired carbapenemases, and ESBL genes explained an average of 76%, 71%, and 74% of resistance phenotypes, respectively (Figure S4A). The presence of osmoporin (Omp) mutations is also linked with an odds ratio significantly above 1 (95% confidence interval above 1) to three β-lactam antimicrobials and is present in on average 74% of resistant strains (Fig. S4B). Among the variants in the omp gene, the insertions in the transmembrane β-strand loop in OmpK36 (OmpK36GD) [56] and frameshift mutations in OmpK35 appeared to have significant odds ratio for resistance against five and four drugs and had an average resistance detection rate of 63% and 24%, respectively. These values were higher than those for frameshift mutations in OmpK36, which were not linked to higher resistance for any β-lactam, despite a previous report on the ST258 strain (Figure S4A and B) [57]. The presence of SHV mutations and β-lactamase located on the chromosome are less significant. Fluoroquinolone resistance mutations and aminoglycoside resistance genes were also prevalent in the population at 74% and 84% of the genomes, respectively (Supplemental Figure S3B). The presence of aminoglycoside and fluoroquinolone resistance genes is linked with significantly higher odds ratios for gentamicin and ciprofloxacin, which were present in 76% and 78% of resistant strains, respectively. The odds ratios were weaker for fluoroquinolone resistance-acquired genes, which were found in 27% of the resistant strains (Figure S4B). Colistin resistance mediated by acquired mcr genes occurred in five strains, distributed across multiple STs, while colistin mutations, predominantly in the mgrB gene, were found in 65/328 (20%) of the population, with 23% (27/120) in ST2096, 24% (11/45) in ST14, 15% (2/13) in ST11, and 78% (11/14) in ST101 [58, 59]. Among the acquired resistance genes, blaOXA-1 was found to be significantly associated with resistance to cephalosporins and amoxicillin/clavulanate after accounting for lineage effects (p-value < 0.05 from GWAS analysis). Because the collection was multidrug-resistant (MDR) to different classes of antimicrobials, the known resistance determinants showed associations with lineages and clones. Overall, the phylogenetic distribution of some of the key resistance genes, e.g., ESBLs and resistance genes/mutations for carbapenemases, aminoglycosides, fluroquinolone, tetracycline, and colistin, demonstrated both cases of the acquisition of the genes/mutations for strains within recent clades and the persistence of the genes in the lineages (Fig. 1).
Virulence factors are common, with some clones having genetic hallmarks of hvKpBesides a high resistance level, the collection also included multiple virulence factor genes associated with the hypervirulent phenotype (Figure S3B). Consistent with this, the iuc locus was present in the absolute majority of ST2096 (94/120 or 78%) and, to a lesser extent, in ST11 strains (9/13 or 69%) (Supplemental Figure S2B). However, ST101 and ST14 contained only 2/14 (14%) and 1/45 (2%) iuc-positive strains, respectively, and the prevalence in the background population was similarly as low as 3%. The rmpADC genes were mainly present in ST11 (9/13 or 69%) and 3 strains from other lineages. The yersiniabactin gene (ybt) cluster was observed in most strains (72.0%) (Supplemental Figure 3B). The most prevalent yersiniabactin lineages were lineages ybt14 (158), ybt9 (36), ybt10 (22), and ybt13 (10), which were chromosomally embedded in integrative conjugative elements (ICEKp): ICEKp5, ICEKp3, ICEKp4, and ICEKp2, respectively. The frequency of yersiniabactin in major STs was 92%, 90%, 100%, and 100% for ST2096, ST14, ST11, and ST101, respectively, which was much higher than the rest of the population (47%), indicating that these prevalent STs represent high-risk strains. The occurrence of colibactin (col) and salmochelin (iro) loci was low across the population, at 1% for both loci (3/328) (Figure S3B). The iro1 locus was not observed in the major STs and only occurred in two isolates of ST23. The same strains carried the colibactin locus of clb2 for ST23 and clb3 for ST268. ST23 strains also carried the iuc locus, which rendered them highly virulent (virulence score of 5, i.e., the presence of yersiniabactin, colibactin, and aerobactin loci), although they lacked major resistant genes.
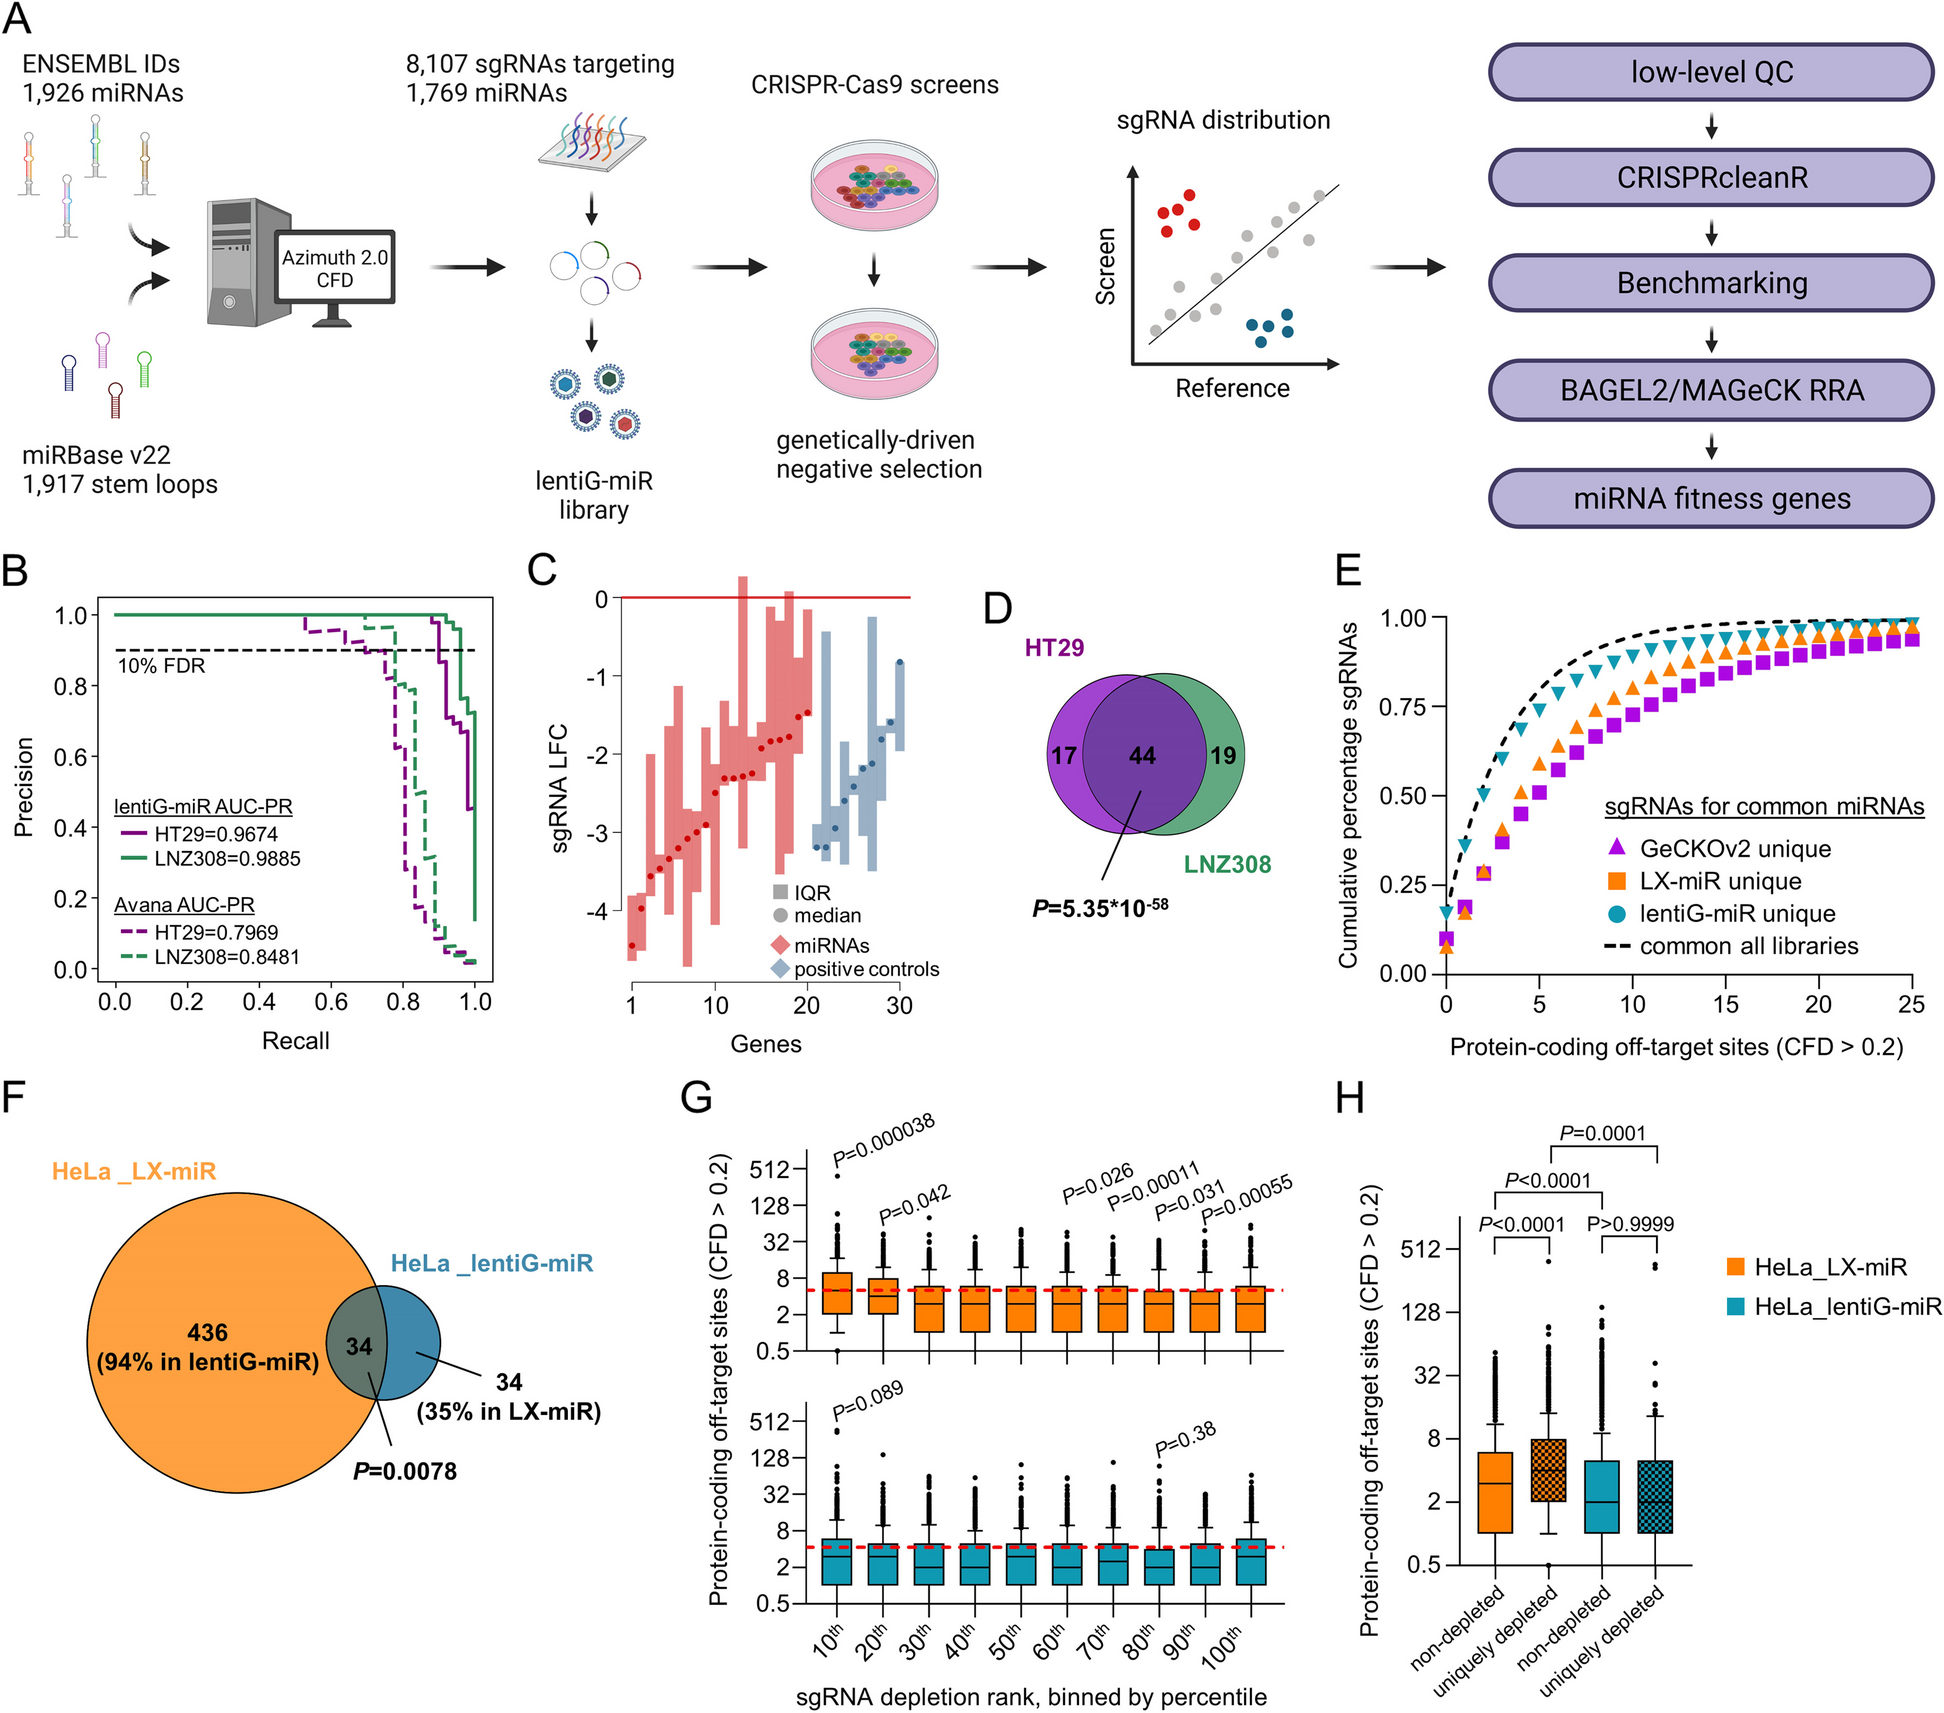
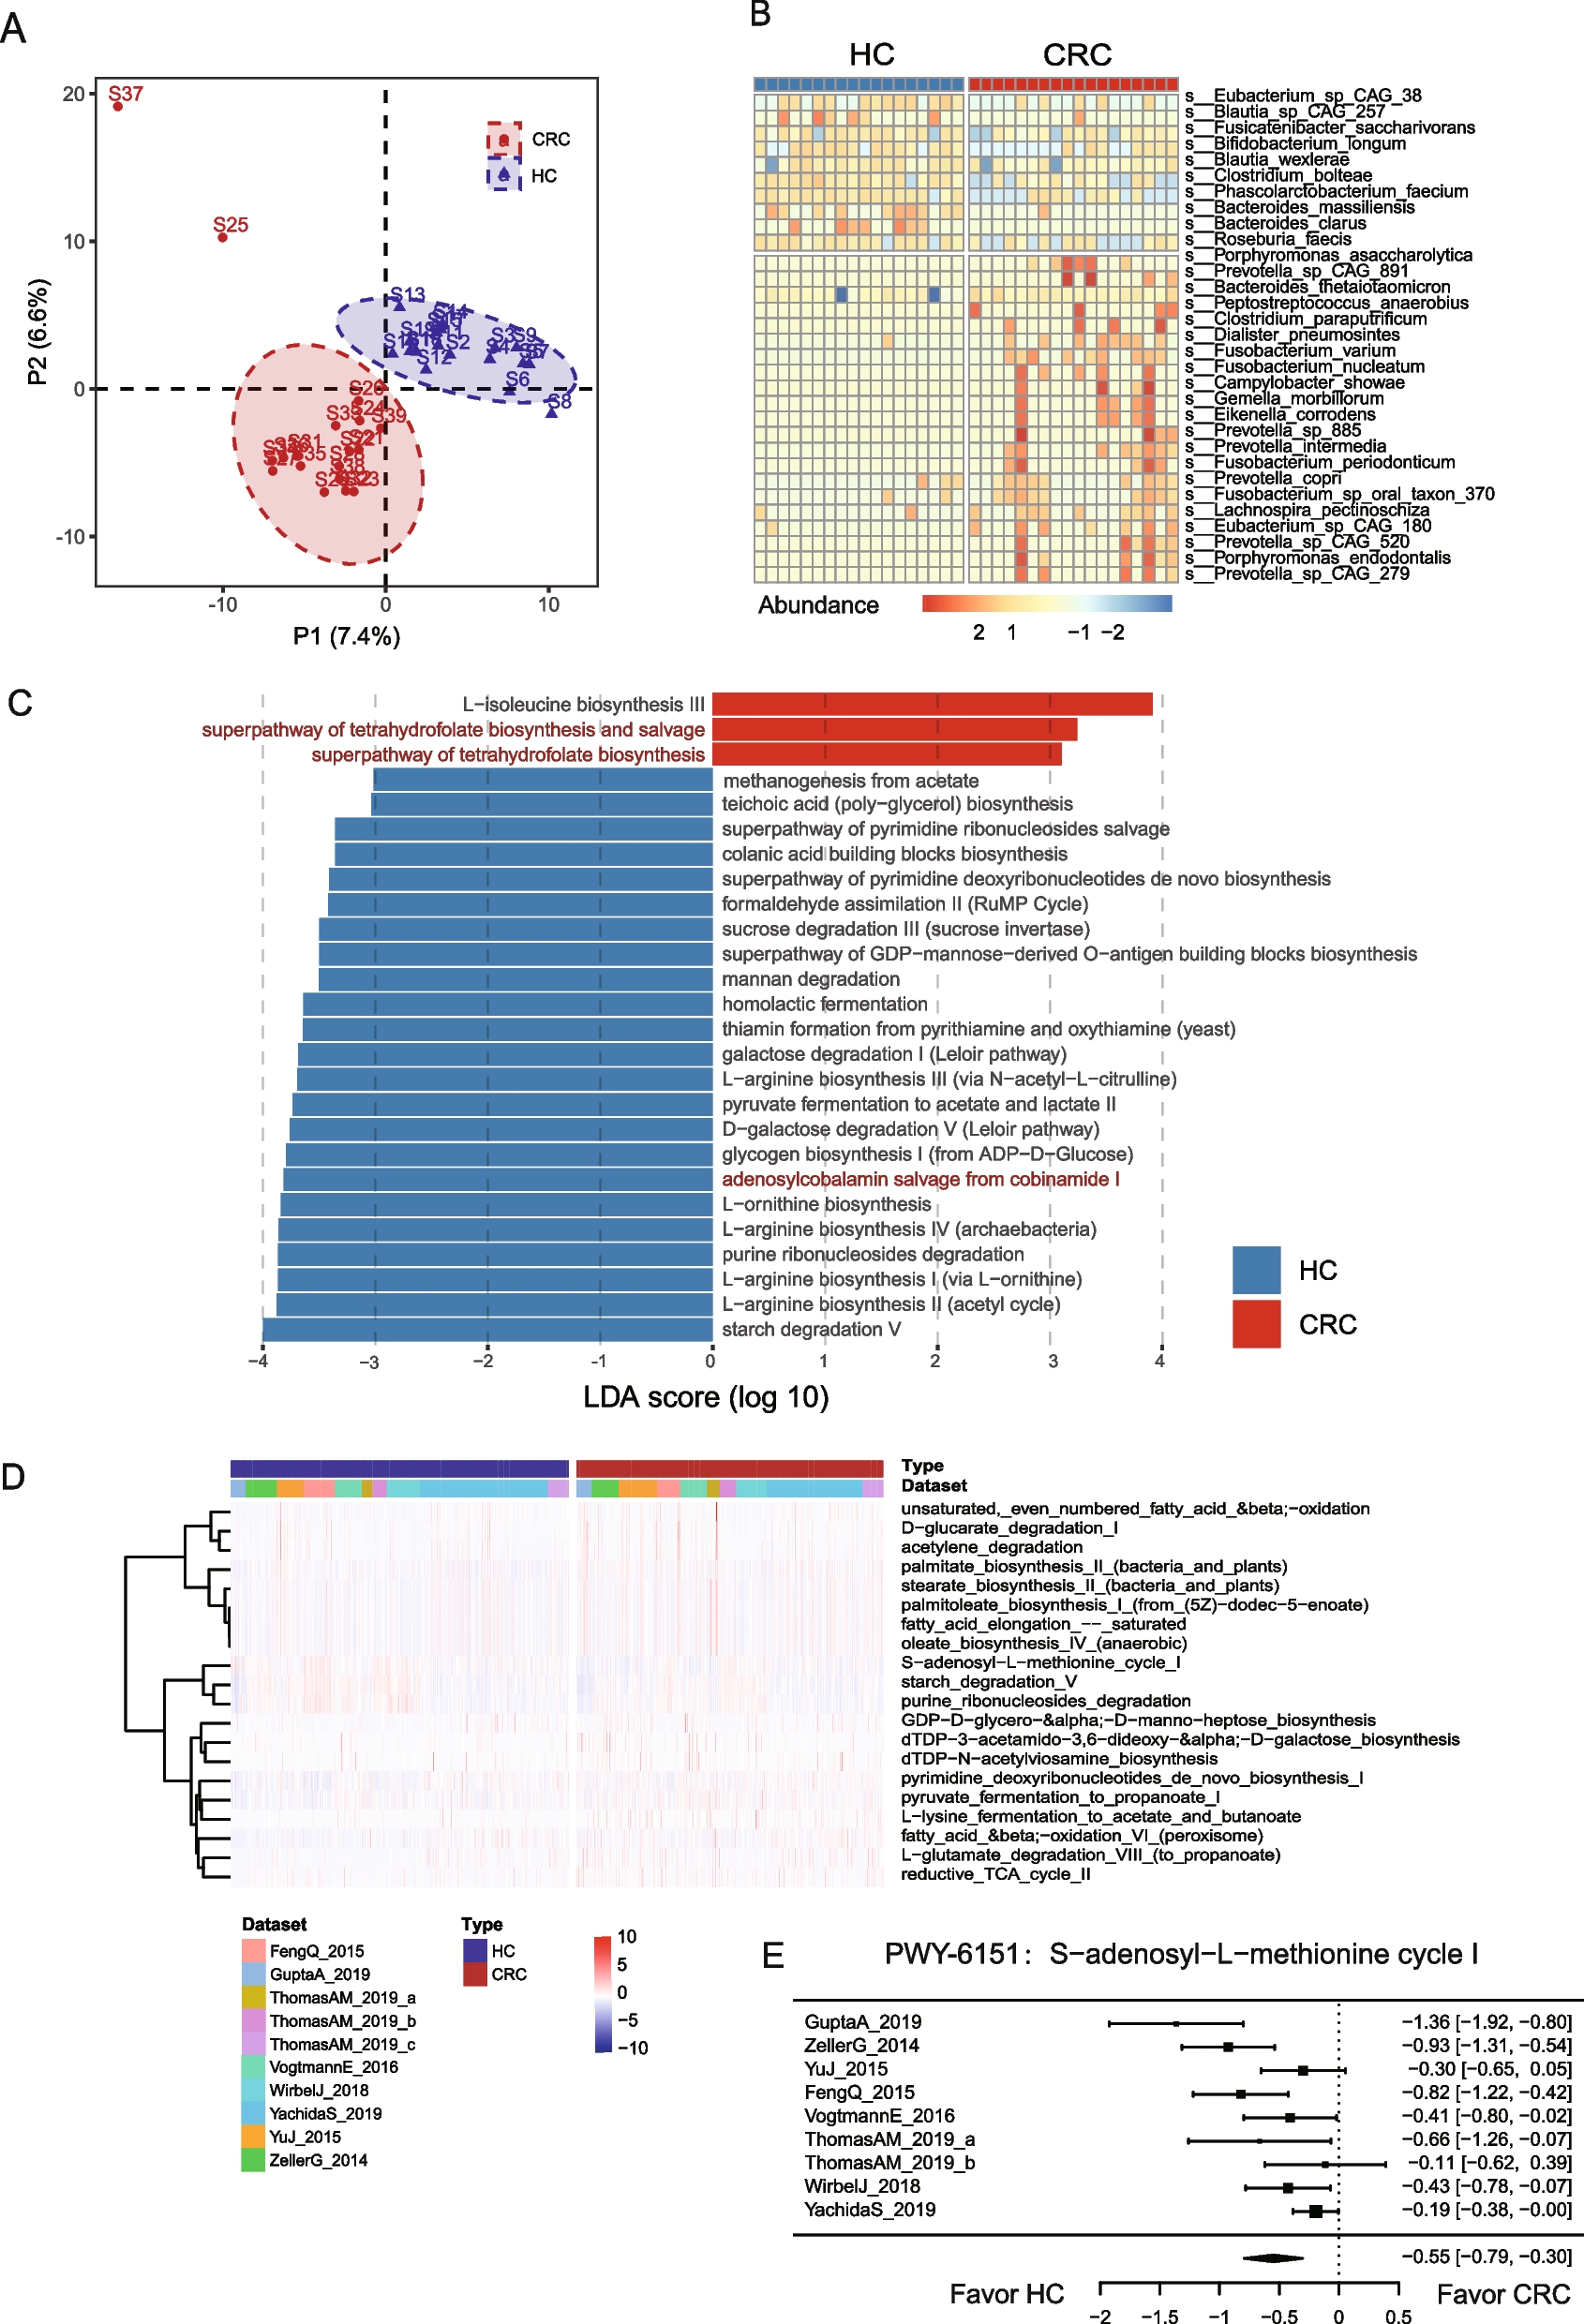
Convergence of virulence and resistance for three common STsThe prevalence of hallmark genes for virulence factors and resistance genes prompted us to dissect the co-occurrence of these elements in the same genome, resulting in strains posing a particular public health threat [15]. The ybt virulence locus was observed in ESBL + strains of major STs (ST2096 n = 58/76, ST14 n = 19/20, ST101 n = 11/12, ST11 n = 3/9) and in carbapenemase-producing (CP) strains of three STs (ST2096 n = 3/99, ST14 n = 15/25, ST101 n = 4/13) (Fig. 2). The prevalence of iuc locus was less common in ESBL strains and was restricted to three STs (ST2096 n = 50/76, ST11 n = 4/9, ST101 n = 1/9), and in carbapenem-resistant strains, it was found in two STs (ST2096 n = 2/99, ST101 n = 4/13). Among ST2096, ST14, ST11, and ST101 strains, the convergence of resistance and hypervirulence (organisms carrying iuc locus plus ESBL and/or carbapenemase-producing, shaded box in Fig. 2) was found in 95/120 (78%), 1/45 (2%), 9/13 (70%), and 1/14 (7%) cases, respectively. The numbers for ST2096, ST11, and ST101 were much higher than for the other STs, which was 2/148 (1%). The ST2096 clone had a higher virulence and resistance scores, and resistance gene and classes count than other non-major STs (p-value Wilcoxon test < 0.001) (Figure S2B). Compared to the major STs, ST2096 has a higher virulence and resistance score and resistance classes than the ST14 clade (p-value Wilcoxon test < 0.05 and < 0.001, respectively) (Figure S2B). ST101 had a significantly higher resistance score than ST2096 (p-value Wilcoxon test < 0.001). In other features, the metric for virulence and resistance genes were comparable between the clones. The findings highlight the high dual resistance and virulence ability of ST2096.
Fig. 2
Genotypic convergence of resistance and virulence. The panel corresponds to genomes with and without ESBL or carbapenemase genes. The bubbles correspond to the distribution of genome harboring virulence genes for the siderophores of aerobactin (iuc) and yersiniabactin (ybt). The genes were identified using Kleborate (see “Methods”). The shaded region shows the strains with convergence of virulence and resistance as per the score computed by Kleborate, based on the virulence and resistance gene profiles
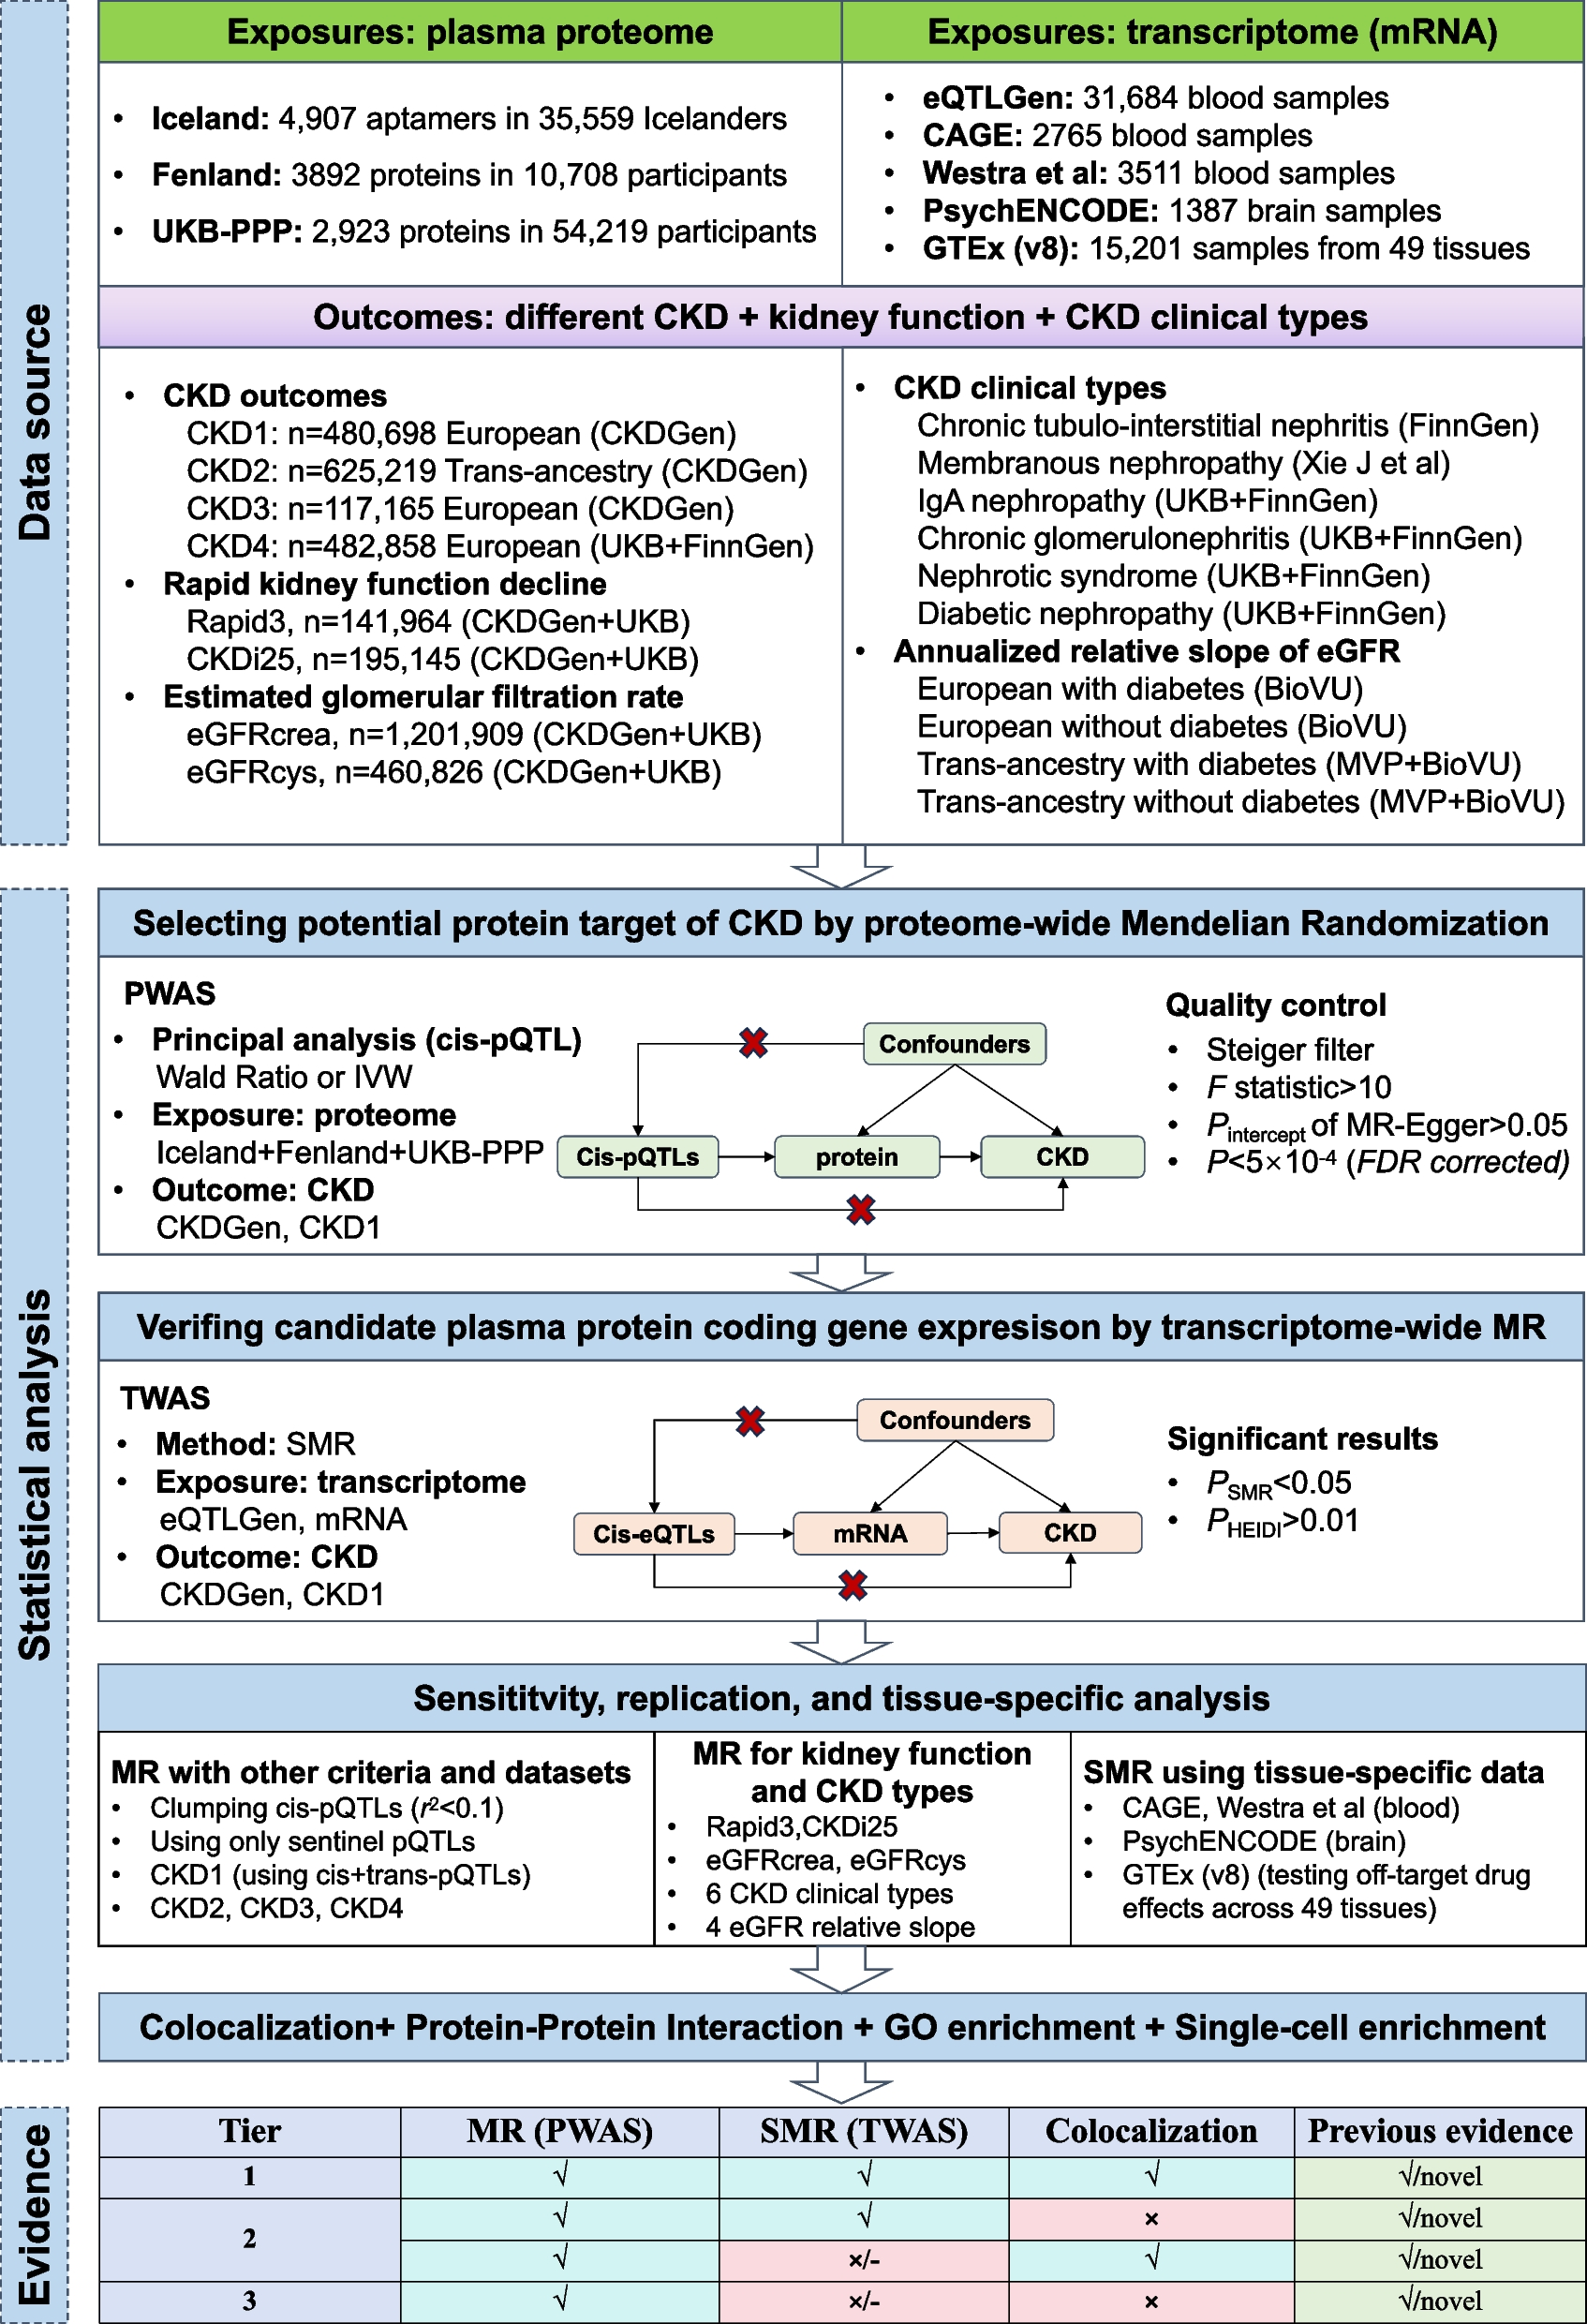
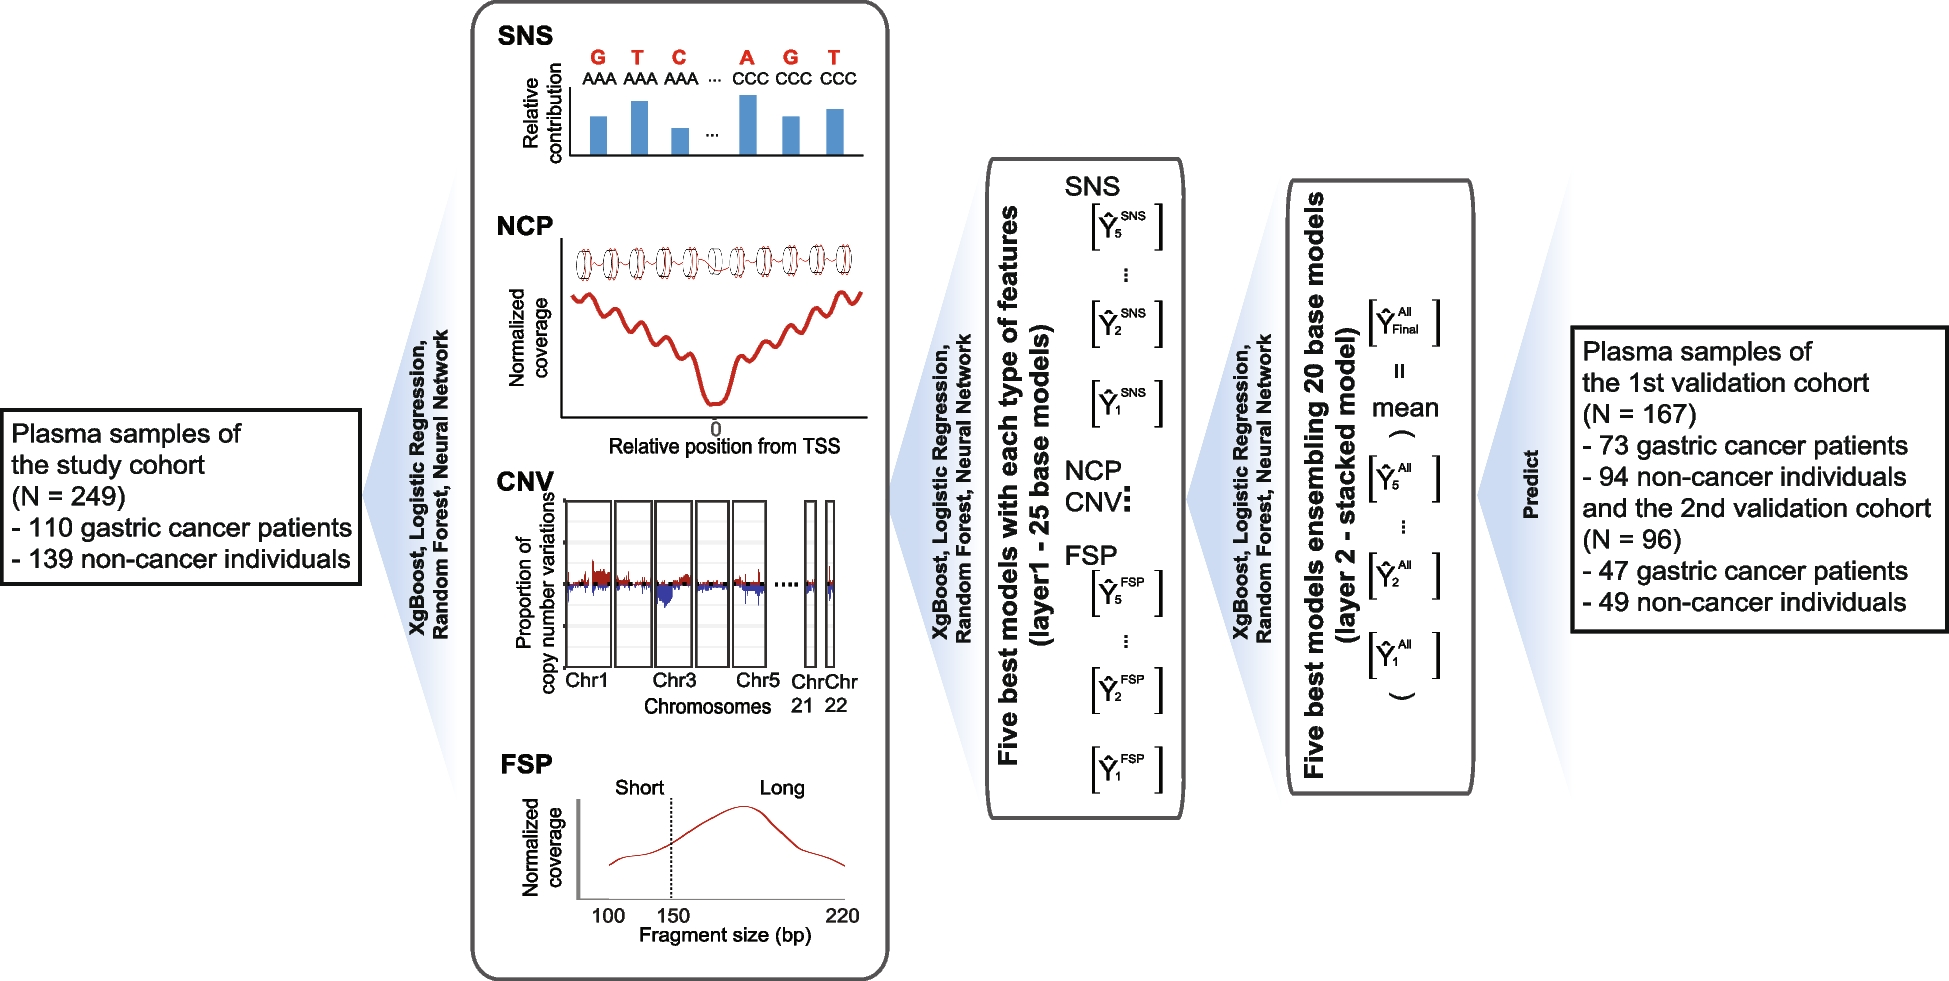
Population dynamics of the ST2096 clones indicate independent emergence of resistance and clonal expansionGiven the significance of the ST2096 clone, our focus for the rest of the study was on this clone. We further examined the population dynamics of the clone that has expanded since 2012 in the hospital (Fig. 3A). The adequate size of the population indicated a rapid initial expansion, followed by a stable population size over time (Fig. 3B). Samples from body sites and patients age groups were distributed across the phylodynamic tree reconstructed from 1207 SNP sites, corresponding to 10.68 SNPs per strain. The variation was also observed within the subclones of the ST2096 clone. We identified four clusters using the BAPS method (Fig. 3C). Clusters 3 (n = 4) and 1 (n = 45) included a total of 49 strains. Clusters 4 and 2, with sizes of 10 and 34, respectively, formed two distinct clades. Although samples belonging to the same patient mostly grouped together on the phylogenetic tree, for 3 out of 16 patients’ samples, lineages for strains from the same patients were mixed with lineages for samples from other patients (Fig. 3A). For three patients, the community routes of infection acquisition were confirmed, i.e., infections were detected within 48 h after the patient’s admission, consistent with previous reports on the occurrence of hvKP in the community [21]. The distribution of resistance genes, along with colistin resistance mutations, suggested high dynamics of gene/mutation acquisition during the relatively short period of 8 years (Fig. 3A). blaOXA-48 was found in cluster 1/3 while blaOXA-232 was found in all clusters, except cluster 3. Ancestral state reconstruction of these genes indicated that the blaOXA-232 gene was lost in some lineages over time, while one expanding lineage acquired the blaOXA-48 gene (Fig. 3C). Notably, isolates with the blaOXA-232 gene predominantly harbored the ESBL blaCTX-M-15 gene. Except for one instance of the gain of the mcr gene, colistin resistance primarily occurred through multiple mutations in mgr, including four stop-gains, five missenses, two frameshifts, and one start-loss mutation, in independent lineages (Fig. 3A). This pointed to the intense selective pressure for these resistance variants from antimicrobial treatment (Fig. 3A).
Fig. 3
The phylodynamic of ST2096 strains. A The Bayesian phylodynamic tree for the ST2096 strains. The horizontal red lines show 95% Highest Posterior Distribution (HPD) for the age of the internal node. We showed the distribution of carbapenemase, ESBL positive, with the acquired genes for aminoglycoside and the distribution of missense, stop gained, and frameshift mutations in the mgr gene and the acquired mcr gene. Colors on the patient panel show whether the isolates were retrieved from the same patients. We did not show the results for patients with one representative strain. B Bayesian skyline plot for the size of the population over time. The shaded region corresponds to 95% confidence interval. C Ancestral state reconstruction for the presence of the carbapenemase genes for the ST2096 clone. The pie charts represent the likelihood of the ancestral state. The tree is a Bayesian tree in (A). The tree tips show the presence/absence status of the genes. The clade colors show the BAPS clusters in (A). D Contextualization of the ST2096 clone with the global population. The neighbor-joining tree was reconstructed from the SNP distance matrix for the ST2096 cluster. Five divergent strains were removed before reconstructing the tree
Mixing of ST2096 samples with global samplesThe ST2096 clone in the collection under study was part of a SNP cluster (cutoff to define the cluster 50 SNPs, see “Methods”) with samples predominantly isolated from the Middle East and South Asia, including India, and a few cases collected from countries further afield (Fig. 3D). Remarkably, the Saudi strains appeared to be ancestral to a substantial clade of samples from Turkey that were reported in 2022. This observation suggests multiple instances of the strains being introduced inside and outside Saudi Arabia, indicating the rapid dissemination of these strains and highlighting the global clinical significance of ST2096. Moreover, ST2096, with its similar resistance and virulence characteristics, has been recently reported as a cause of hospital outbreaks in Turkey [60] and isolated from both community and clinical settings in India [15, 24]. The phylodynamic of the total global ST2096 isolates shows that on five occasions, as shown in the phylodynamic tree, samples from Saudi Arabia appear to serve as ancestors to those from Turkey (Figure S5). All these findings underscore the importance of ST2096 as an emerging strain of global clinical significance.
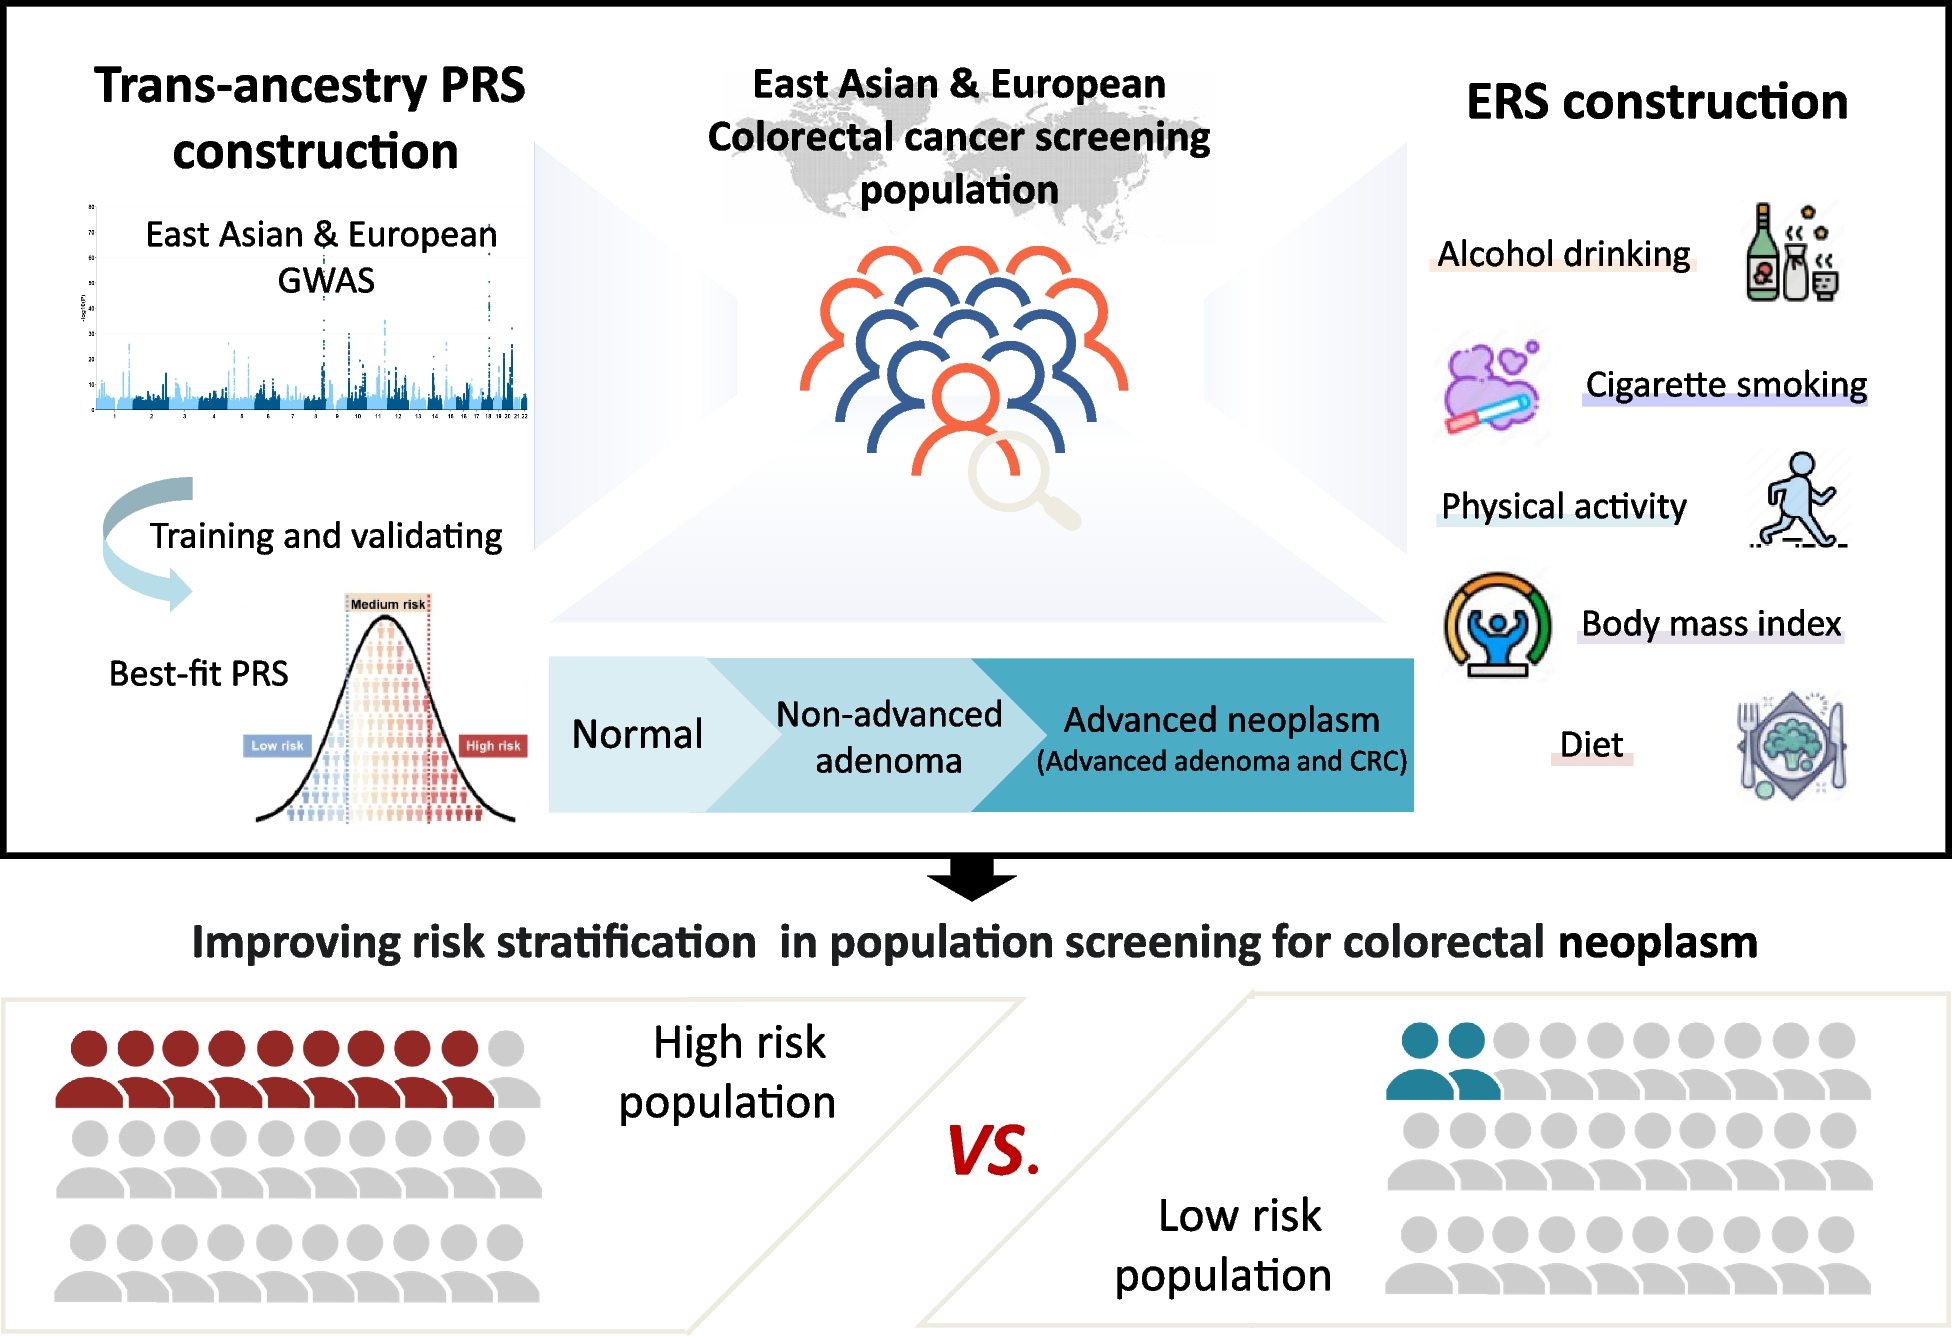
ST2096 spreads across wards with a higher transmission rate between bloodstream infection and deceased patientsTo examine the dynamics of the ST2096 clone in the hospital setting, we reconstructed the transmission network from the dated Bayesian transmission tree generated with a structured coalescent inference method (see “Methods”). Figure 4A illustrates the transmissions network in which transmissions with a probability greater than 0.1 across hospital wards are filtered. Out of the 14 patients in this network, the majority (nine) had bloodstream infections, and 4 four survived by the end of the treatment. There was no clustering of links based on the ward of admission; instead, patients admitted to distant wards constituted the transmission routes. This pattern was consistent regardless of the probability cutoff used for the transmission network. Stronger transmission links between patients with ST2096 occurred more frequently between patients who reported a hospital death and those with bloodstream infections (Fig. 4B). The distribution of hospital wards did not appear to influence the transmission probability, indicating that the strains spread freely across wards (Fig. 4B). This pattern was also observed for other major ST clones, which appeared to circulate across different wards (Figure S6). However, in contrast to ST2096, no link was found between a patient’s in-hospital status or site of infection and the probability of transmission for other ST clones, as the distribution of isolates in the network remained the same for the other STs, regardless of different cutoff values for the probability of transmission routes (Figure S6). Our results also indicated a strong link between the length (duration) of hospitalization and the role of the patient as the spreader in the transmission networks for the ST2096 clone (Figure S6). We observed a significant relationship between both the node degree (the number of incoming and outgoing potential transmission links) and betweenness centrality (which corresponds to the degree to which a patient stands between transmission routes) and the number of days of hospitalization (p-value for the significance of the slope < 0.01) (Fig. 4C). A high node degree indicates high connectivity, observed for hyper-spreaders, i.e., an individual with the potential to infect a disproportionately large number of people compared to the average infected person, whereas nodes with high centrality are bridges for transmission across the network. The regression analysis indicated that a single day of hospitalization increased the number of connections and betweenness score by an average of 0.05 (standard deviation: 0.01) and 0.15 (standard deviation: 0.03), respectively. Altogether, these results demonstrate a distinctive in-hospital epidemiology pattern for ST2096, compared to other frequent clones, and suggest a higher transmissibility for the ST2096 strains for patients with a more extended hospitalization period.
Fig. 4
Transmission dynamics of ST2096 clone. A Inferred transmission network of ST2096 in the hospital under study (for indirect transmission). Nodes and edges represent patients and indirect transmission routes with a probability more significant than the cutoff of 0.1, respectively. The thickness of the edges corresponds to the probability transmission. Patients who survived until the end of hospital treatment are marked with blue circles. Other patients had a deceased status. B The distribution of patient status, body site, and admission hospital ward in networks with different cutoffs for the transmission routes. C The relationship between the total node degree and betweenness centrality with hospitalization length, measured in days. The red line shows the fitted linear regression, and the shade shows 95% confidence interval. For a definition of degree and betweenness centrality, refer to “Methods”
Plasmids distribution implies links with previous collectionWe examined the entire plasmid content of the ST2096 clone. Among the 69 samples, from which we were able to retrieve plasmid DNA, we detected 3 types of plasmids, including pIncHI1B plasmid in 47 genomes, pOXA48 in 8 genomes, and pOXA232 (pColKP3) in 8 genomes. The pOXA48 and pOXA232 plasmids carried different carbapenemase gene of blaOXA-48 and blaOXA-232, respectively. Notably, despite the difference in the size of the pOXA48 and pOXA232 plasmids, both carried the carbapenem resistance gene (Figure S7A). While pOXA48 was linked with IS10A, we did not detect any IS element surrounding the blaOXA-232, gene, suggesting different transfer modes for these genes. Specifically, blaOXA-48 may transfer independently from the plasmid as an independent unit, while blaOXA-232 is transferred together with the plasmid. Furthermore, we observed differences in the presence of conjugation genes in the tra locus between the two plasmids. (Figure S7A). The plasmids showed a broader geographical distribution beyond the current collection: pIncHIIB and pOXA232 in most external samples, with 78% and 23% of genomes showing coverage above 90% for pIncHIIB and, to a lesser degree, pOXA48 in 45% of all external genomes, respectively (Figure S5). The phylogenetic distribution of the genomes carrying the plasmids suggests both the dissemination of lineages harboring the plasmid across countries and signatures of plasmid transmission between distant countries. Besides the ST2096 clones, the plasmids were also present in other lineages in our collection, providing evidence of HGT among the lineages (Fig. 1). The pOXA232 plasmids was common in ST2096 clone but occurred in multiple other lineages, i.e., < 90% coverage was observed in genomes from four STs other than ST2096. The pOXA48 has a broader phylogenetic distribution and occurred in multiple other lineages from 13 STs other than ST2096. The pIncHIIB was detected in only two ST14 and ST866 other than ST2096 strains. This distinguishes the clone from other clones including the sister clone of ST14 and presumably explain the success of the ST2096 clone (see “Discussion”).
pIncH1-1B pangenome is dynamic, in particular for the resistance gene cassetteThe pIncHI1B plasmid is a large ~ 300kbp mosaic plasmid, i.e., a plasmid with genetic cassettes for virulence and antimicrobial resistance, that shows most of the characteristics of the hybrid plasmid previously reported in ST2096 in India and showed 73% percent sequence identity to this plasmid (Figure S7A outer red layer band in pIncHI1B) [61]. The resemblance between this plasmid and the one reported in India further supports the link between India and the current strains, as described above for SNP clusters. The genomes of the pIncHI1B plasmid exhibited substantial size variation across the strains, with a mean size of 300,411 bp (ranging from 151,761 bp to 321,032 bp), which accounted for 56% of the plasmid mean size. This corresponded to an average 336 genes per genomes with the minimum of 177 and maximum of 363 genes. Pangenome analysis of the plasmids further revealed a dynamic composition comprising 215 core genes present in more than 95% of isolates, 140 genes in the shell genome (present in 15% to less than 95% of strains), and 37 genes in the cloud genome (present in less than 15% of strains). Apart from dfrA12, msrE, and sul1, other resistance genes exhibited variable presence within the cohort of genomes under study. In contrast, the virulence factor cassette, composed of the iuc locus and iutA gene, remained consistently present in all samples with the plasmid (Figure S7B, Figure S8A). The differences in the dynamics of resistance and virulence cassettes were also evident in the pangenome graph of the plasmid (Figure S7B). Antimicrobial resistance genes were found in the highly connected subnetwork of the pangenome network, tightly linked with various IS elements, indicating different combinations of genes on the contigs (Figure S7B). In contrast, virulence genes were stably co-located across the population. The resistance genes and their linked IS elements constituted the entire set of significant co-evolving genes (p-value < 0.01 from Pearson correlation test), with three epistatic interactions between pairs of resistance genes (i.e., aac4, blaOXA-1, and tetA) (Figure S8B, Figure S8C). The population structure of the plasmid supported a mosaic structure of gene cassettes coming together on the same plasmid backbone. However, it did not indicate long-range co-evolution of genetic interactions between genes, including interactions between antimicrobial resistance and virulence factor genes.
In-hospital mortality is linked with the genomic characterization of colonizing STsWe evaluated the clinical significance of major STs by integrating in-hospital mortality data with the infection data of the dominant STs. The ratio of deceased patients for ST2096, ST11, ST101, and ST14 was 53% (44 out of 83 patients), 45% (5 out of 11 patients), 72% (8 out of 11 patients), and 46% (11 out of 24 patients), respectively. For ST2096 and ST101, these values were found significantly higher than the rate for the rest of the population, i.e., 33% (38/116) (p-value from one-sided proportion test < 0.01). The results from the death rate over time indicate that carriage of ST2096 and ST101 is consistently linked to a higher mortality rate compared to the other STs, and this effect becomes significant for ST101 after 30 days and for ST2096 after 90 days (proportion test p-value < 0.05) (Figure S9A). The difference is also evident among subpopulations with different virulence gene profiles. The presence of the ybt and the concurrent presence of ybt and iuc loci are linked to in-hospital mortality compared to the single carriage of iuc and the lack of both genes, with the difference becoming more significant after 60 days (proportion test p-value < 0.05) (Figure S9B). Similarly, the concurrent presence of ESBL and carbapenemase genes turned out to be significantly linked with a higher mortality rate than the single presence of the genes or the absence of the genes after day 60 of hospitalization (Figure S9C). Patients with hypervirulent and multidrug-resistant strains were found to have a slightly higher mortality rate than the rest of the population over time; however, the difference was not significant. This is attributed to the definition of the phenotype, as the single presence of the ybt gene, despite the strong link with mortality in our collection, does not classify the strains as hypervirulent (Figure S9D) [27]. In line with this, the odds ratio for death in patients with ST101 and ST2096 was significantly greater than 1 (95% confidence interval of the values), in contrast to ST11 and ST14 and other STs (Fig. 6A). Although for ST2096 the odds ratio is 1 still close to one, the odds ratio was significantly larger than odds ratio for ST14 and the rest of the population (Fig. 5A) (p-value one-sided Wilcoxon ranked test < 0.01). For ST101, the infection rate is higher than ST2096 and is closely comparable to a previous report of 72% in infections caused by carbapenem-resistant strains [62]. The significance association of ST2096 and ST11 carriage with in-hospital mortality still held true even after accounting for potential confounding factors such as age, infection site, and comorbidities (Fig. 5B). ST101 is recognized as a dual-risk clone with a combination of hypervirulence and resistance [63], and ST2096 appears to show a similar level of risk (Fig. 5B). ST2096 also displayed demographic and clinical features similar to hvKp, i.e., colonizing individuals of all ages [54, 55], with an age distribution ranging from 11 to 75 (Fig. 5C). Furthermore, ST2096 isolates recovered from different body sites, a characteristic previously reported for hvKp [54, 55]. This contrasts with the ST101 strains in our collection, which was not recovered from urinary tract (UC) colonization/infections and had only 1 out 14 samples (7%) from blood. ST11 strains, exhibited a higher frequency of blood colonization (7/13, 53%, p-value from one-sided proportion test < 0.05) than ST2096 strains, although the frequency of strains from urine culture was comparable for ST11 (3/13, 23%) and ST2096 (28/120, 23%) (Fig. 5C). These findings highlight the clinical significance of ST2096, which is underpinned by genetic determinants for virulence and resistance.
Fig. 5
Integration of ST data with clinical and demographic data. A The odds ratio of death for the major STs. The error bars show a 95% confidence interval. The dotted line shows an odds ratio of one, above which the presence of STs is positively linked with death. The asterisks ** and *** correspond to p-values of < 0.01 and < 0.001 from Z-test, respectively. The black and orange colors for the asterisks show the significance when the odds ratio smaller and bigger in ST2096 than the other group, respectively. B The coefficient value associated with STs from logistic regression analysis in which sex, gender, age, and site of isolation were included as predictors. The coefficient is the expected change in log odds of being an ST type. C Distribution of patients’ age and body site of infection. The ** shows p-value < 0.01 from Wilcoxon signed-rank test
Integration of genomic and clinical data shows links between the ST2096 colonization/infection and sepsisWe evaluated the clinical manifestation of the carriage of ST2096, in comparison to other STs. The results do not reveal a higher Charlson comorbidity index for ST2096 compared to other STs (Fig. 6A). The values are lower for ST2096 and are significantly lower than the rest of the population (Wilcoxon signed-rank test p-value < 0.01) and the sister clade ST14 (Wilcoxon signed-rank test p-value < 0.05) (Fig. 6A). However, patients with ST2096 strains turned out to have longer hospitalization than those with other STs (Wilcoxon signed-rank test p-value < 0.01), suggesting ST2096 carriage is linked with burdens not included in the Charlson comorbidity index (Fig. 6A). We, therefore, evaluated the over-representations of conditions linked with infections. The results show that in ST2096-related notes, the sepsis code < < ICD10 code: A41 > > and chest pain < < ICD10 code: R07 > > are significantly over-represented compared to the other STs and sister ST14, respectively (proportion test p-values < 0.05) (Fig. 6B). Patients with ST2096 had more instances of sepsis and chest pain than patients with sister ST14 (proportion test p-values < 0.05) (Fig. 6B). No significant difference was observed for the cough symptom < < ICD10 code: R05 > > , and ST2096 representation was smaller than ST101 in patients with fever < < ICD10 code:R50 > > (proportion test p-values < 0.01) and chest pain (proportion test p-values < 0.01), which is in line with higher mortality for ST101. We further explored the importance of the terms in patients with ST2096. To achieve this, we extracted the most relevant medical terms from the clinical documents for patients with ST2096, comparing them with those noted for patients with other STs. Figure
留言 (0)