
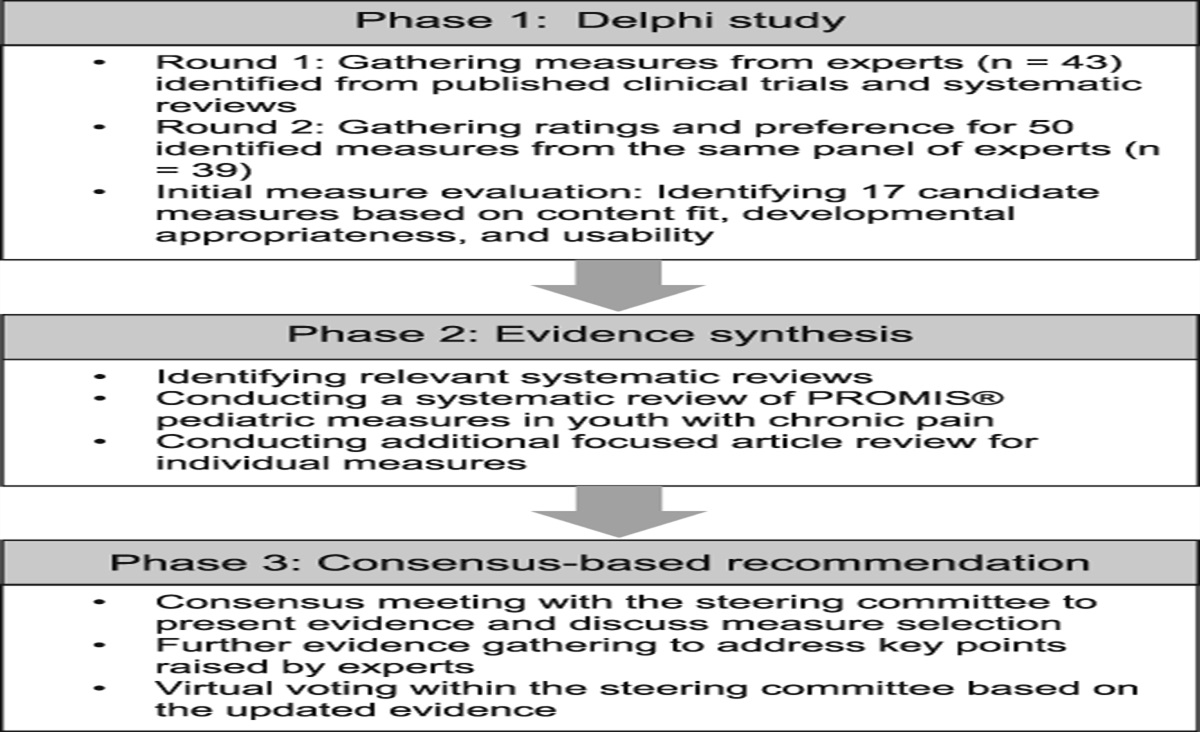
記住我


Unlike cortical neurons, somatosensory afferents do not exhibit spontaneous activity under normal physiological conditions but only during pathological states. For example, one of the primary features of neuropathic pain in animal models is spontaneous activity in all major fibre types, including large myelinated Aβ, thinly myelinated Aδ, and unmyelinated C fibres.14 Similarly, in humans who live with neuropathy, spontaneous peripheral neuron activity can be measured using microneurography.13,20,26 Based on these observations, numerous analgesic drug development strategies are aimed at reducing this abnormal pathological activity.31
To inform these strategies, it is important to establish a consensus view of existing literature that goes beyond usual narrative summaries. We have conducted a review with systematic search and data extraction, a less biased method that can also provide insight into research quality.24
We focused on experimental designs that can directly interrogate spontaneous neuron firing in whole organisms, ie, in vivo electrophysiology and microneurography. Our first aim was to identify and collate all the relevant studies in this area into one, easily accessible spreadsheet. Our second aim was to use the data we extracted to answer a few simple but crucial questions about spontaneous activity in neuropathy:
(1) Which fibre types are mainly reported to be spontaneously active? Microneurography studies frequently report spontaneous activity in C fibres in neuropathy patients, eg, Refs. 13,19,27. Conversely, in vivo electrophysiology in animal models has traditionally pointed towards the importance of spontaneous activity in Aβ fibres, with Marshall Devor advocating that they are the main drivers of subsequent central sensitisation and pain.8 (2) How long does spontaneous activity persist? The tacit assumption of many in the field is that spontaneous activity is long-lasting and can drive ongoing pain. Indeed, in chronic neuropathy patients, spontaneous C-fibre firing can be observed, which correlates with spontaneous pain.13 The picture emerging from preclinical in vivo electrophysiology is much more mixed. Many report the bulk of activity within the first 2 weeks of nerve injury,22,28 although others have argued that long-lasting activity emerges in unmyelinated fibres 3 to 4 weeks after an insult.16 (3) Are muscle afferents especially prone to sensitisation as opposed to skin afferents, as has been claimed?17 If true, this could provide one potential mechanistic explanation for why deep muscle pain is a common complaint in chronic pain conditions.The data we extracted supported the presence of ongoing spontaneous activity in both A and C fibres. However, there was a high level of heterogeneity and only very few, directly controlled studies. Microneurography studies were rare and spread across a divergent range of pain conditions. We conclude that the strength of available evidence in this area does not quite match the levels of confidence and ubiquity with which we all like to assert that spontaneous activity is one of the origins and main drivers of chronic pain.
2. Methods 2.1. Protocol registrationWe registered a systematic review protocol for our study on the Open Science Framework on June 8, 2020. However, as abstract screening and data extraction proceeded, it became clear that key articles had been missed using the search string that was originally registered, and that the literature was even more heterogeneous than initially anticipated. Significant deviations from the protocol therefore had to be undertaken, including development of a new search strategy (Box 2), to ensure inclusion of all the relevant literature. Moreover, data extraction was simplified to enable processing of the information within the time-frame of the project. Below contains a description of the methods that were eventually adopted.
2.2. Systematic searchWe conducted a systematic search of the existing literature using PubMed, to identify and collate evidence of spontaneous activity in sensory nerve fibres after peripheral injury. Abstracts were imported into EndNote for subsequent screening steps.
The search terms we initially used on June 8, 2020 and logged as part of our systematic review protocol are presented as a string in Box 1. Medical Subject Headings (MeSH), ie, specialised search strings designed for indexing, were used to exclude certain fields of research and limit the number of hits obtained. Once it became apparent that key articles were missing, another round of abstract screening and data extraction was undertaken. We added to already included articles with 2 additional search strings: that provided in Box 2 and the very broad string of “microneurography AND (spontaneous OR ongoing),” which was designed to ensure that no relevant human microneurography articles would be missed. The second search was performed on May 5, 2021.
Box 1.Search string registered in the original protocol, used for the first round of data collection.
(Spontaneous discharge* OR spontaneous firing* OR Spontaneous activit* OR ongoing discharge* OR ongoing firing* OR ongoing activit* OR ectopic discharge* OR ectopic firing* OR ectopic activit* OR ectopi*) AND ((“Sensory neuron*”) OR (“A fibre*”) OR (“C fibre*”) OR (“neuropathic pain”) OR (“nerve injur*”) OR (“axotom*”) OR (“Phantom pain”) OR (“neuroma*”) OR (“severed nerve*”)) NOT REVIEW NOT (“Cardiovascular Diseases” [MeSH]) NOT (“Electroencephalography” [MeSH]) NOT (“Memory Disorders"[MeSH]) NOT (“intellectual disability”[MeSH]) NOT (“consciousness disorders”[MeSH]) NOT (“cochlear nerve” [MeSH]) NOT (“Vestibulocochlear Nerve” [MeSH]) NOT (“Optic Nerve”[MeSH]) NOT (“oculomotor muscles” [MeSH]) NOT (“tomography” [MeSH]) NOT (“Electroencephalography” [MeSH]) NOT (“computational biology”[MeSH]) NOT (“Receptors, Odorant”[MeSH]) NOT (“Gene Expression Regulation”[MeSH]) NOT (“Congenital, Hereditary, and Neonatal Diseases and Abnormalities” [MeSH]) NOT (“Respiratory Tract Diseases” [MeSH]) NOT (“olfactory bulb” [MeSH]) NOT (“intestine, small”[MeSH]) NOT (“invertebrates”[MeSH]) NOT (“fishes” [MeSH]) NOT (“Herpesviridae”[MeSH]) NOT (“Ear Diseases” [MeSH]) NOT (“Magnetoencephalography”[MeSH]) NOT (“Joint Diseases”[MeSH]) NOT (“Information Science”[MeSH]) NOT (“Microglia”[MeSH]).
Note that the PubMed database does not distinguish between American and English spelling, ie, the term “fibre” will find both “fiber” and “fibre.”
Box 2.Second search string used to for the second round of data collection.
(Spontaneous discharge* OR spontaneous firing* OR Spontaneous activit* OR ongoing discharge* OR ongoing firing* OR ongoing activit* OR ectopic discharge* OR ectopic firing* OR ectopic activit* OR ectopi* OR neuroma* OR microsympathectomy) AND ((“Sensory neuron*”) OR (“A fibre*”) OR (“C fibre*”) OR (“neuropathic pain”) OR (“nerve impulse*”) OR (“nerve injur*”) OR (“axotom*”) OR (“electrophysiology” AND “pain”) OR (“microneurography”) OR (“neuropathy”) OR (“Phantom pain”) OR (“Sympathectomy”) OR (“nerve afferent*”) OR (“sympathetic efferent*”)) NOT REVIEW NOT (“BRAIN”[MeSH]) NOT (“intestine, small”[MeSH]) NOT (“invertebrates”[MeSH]) NOT (“fishes” [MeSH]) NOT (“Herpesviridae”[MeSH]) NOT (“Ear Diseases” [MeSH]) NOT (“brain diseases” [MeSH]) NOT (“Ocular Motility Disorders”[MeSH]) NOT (“Vestibulocochlear Nerve Diseases”[MeSH]) NOT (“eye diseases”[MeSH]) NOT (“Cardiovascular Diseases”[MeSH]) NOT (“cardiovascular physiological phenomena”[MeSH]) NOT (“Memory Disorders”[MeSH]) NOT (“intellectual disability”[MeSH]) NOT (“consciousness disorders”[MeSH]) NOT (“mental processes”[MeSH]) NOT (“Stomatognathic Diseases” [MeSH]) NOT (“cochlear nerve” [MeSH]) NOT (“Vestibulocochlear Nerve” [MeSH]) NOT (“Optic Nerve”[MeSH]) NOT (“oculomotor muscles” [MeSH]) NOT (“tomography” [MeSH]) NOT (“Electroencephalography” [MeSH]) NOT (“computational biology”[MeSH]) NOT (“psychophysiology”[MeSH]) NOT (“neoplasms”[MeSH]) NOT (“Congenital, Hereditary, and Neonatal Diseases and Abnormalities” [MeSH]) NOT (“Respiratory Tract Diseases” [MeSH]).
The main differences between the search strings in Box 1 and Box 2 were (1) the inclusion of “neuroma” and “microsympathectomy” before the first “AND,” (2) the inclusion of additional terms after the first “AND,” specifically “nerve impulse,” “microneurography,” “neuropathy,” “sympathectomy,” “nerve afferent,” “sympathetic efferent,” “electrophysiology AND pain”; and (3) the use of different MeSH terms for exclusion, eg, we added “brain diseases” and removed “gene expression regulation.”
Our search strings and eventual data extraction relied on the terms “spontaneous,” “ectopic,” and “ongoing.” We did not distinguish between the root causes of the spontaneous, ectopic, or ongoing activity. For example, is the activity “spontaneous” in the sense of being generated endogenously by the neuron, ie, as a result of membrane oscillations or changes in sodium channel function, or is it actually triggered by external factors, like chemical mediators released in the environment of injured neurons, and therefore, arguably not truly “spontaneous.”2 We did not distinguish between these within this review.
2.3. Title and abstract screeningTitle and abstract screening was performed using the Systematic Review Facility (SyRF; http://syrf.org.uk/), an open-source systematic review platform.1 Before screening, duplicate search results were removed by EndNote. If EndNote did not discard duplicates during the import stage, reviewers removed any remaining duplicate articles. The remaining unique references were then screened for eligibility against the below inclusion/exclusion criteria using the title and abstract text. If a decision could not be reached on this information alone, the full text of an article was accessed in a second step. Each reference was evaluated by 2 independent reviewers, specifically, D.C. and F.D. Disagreements were resolved through joint discussion, erring on the side of inclusion in the first instance.
2.4. Inclusion and exclusion criteriaDuring abstract screening of articles concerning nonhuman data, we included all primary articles that appeared to present any electrophysiology data of spontaneous peripheral neuron activity resulting from nerve injury. We excluded review articles or articles that only showed schematic drawings of electrophysiology recordings rather than actual data. References to textbooks were excluded. During subsequent data extraction, we included only full-text articles, written in English, that performed in vivo electrophysiological recordings of peripheral sensory nerves in models of neuropathic pain. We did not include articles examining spontaneous activity in inflammatory models like Complete Freund's Adjuvant because they are not generally considered to cause neuropathic pain. We also did not include diabetic models. Arguably, diabetes could cause neuropathy, but there were only 4 articles that attempted to study spontaneous activity in animal models of diabetes, 3 of which used the streptozotocin model that is not considered to have particularly good face validity.11
During abstract screening of articles concerning human data, we included only original articles, which seemed to contain microneurography recordings. Here, data of patients with any sort of chronic pain were included. Reviews were excluded. For data extraction, the full text of the article had to be available in English.
Qualitative data collection (eg, species, sex, type of neuropathic pain model, and human disease/pain type) was performed on all the articles included for full data extraction. However, quantitative data, eg, on n-numbers and spontaneous activity, was only obtained if the articles also provided raw data in a format that permitted us to calculate the percentage of spontaneously active fibres recorded in a particular condition.
2.5. Data extraction and managementOnce screened, all references and their corresponding abstracts returned from the searches were downloaded from SyRF and compiled into an Excel Database (Supplementary Table, available on OSF, available at https://links.lww.com/PAIN/B958). This database contains the list of included articles and specifically information on title, authors, journal, and year of publication. Two reviewers (D.C. and F.D.) independently went through each item, decided on full-text inclusion, and if suitable, extracted data. Disagreements between reviewers were resolved through a tie-breaker (G.G.). Given how different in vivo electrophysiology and microneurography are as techniques, different parameters were extracted for nonhuman and human data, as described in the following:
For non-human data: reasons for exclusion (if applicable), study purpose, animal species, animal sex (where “unclear” was used to denote articles in which no information was provided), injury type (eg, sciatic nerve ligation), and model type. Options for the latter included “nonregenerating” (eg, nerve ligation), “regenerating” (eg, nerve crush), “nontraumatic” (eg, chemotherapy-induced neuropathy), and “other” (eg, rhizotomy). We also collected information on the type of nerve that was being injured (eg, “sciatic”), as well as whether the nerve in question contained cutaneous afferents, muscle afferents, or a mixture of both. Data were extracted on fibre type (eg, “A fibre”), how fibre type was determined (eg, using conduction velocity), and how much time after injury the recordings were conducted: <24 hours (acute), <8 days, weeks (ie, 8-21 days), >21 days (chronic). We noted where the activity was recorded from, eg, in teased L5 dorsal root, and how many individual animals or filaments were used. The number or percentage of spontaneously active fibres recorded per group was extracted. Finally, we also scored the “level of bias” of each article, where bias refers to how likely the recorded incidence of spontaneous activity would have been impacted by how the data were acquired. Specifically, C fibres are known to sensitise and start firing spontaneously in response to sustained activation, eg, as a result of repetitive receptive field testing.5 We ranked articles based on our interpretation of how likely recording bias would have resulted, given the authors' description of their experiments. Articles were scored “low bias” when authors specifically mentioned taking care not to sensitise fibres or clearly avoided repetitive stimulation of fibres before recording of spontaneous activity; articles were scored “medium bias” when some initial receptive field testing or electrical stimulation had taken place; and finally, articles were scored “high bias,” if the authors specifically focused their analyses on those fibres that were spontaneously active or conducted extensive receptive field stimulation.
For human data, we recorded the overall purpose, the sex of the participants, the injury or disease, the number of patients from whom spontaneous activity data were recorded, and whether they experienced painful or nonpainful neuropathy or whether they were healthy controls. Where available, we also recorded how many individuals were reported to experience spontaneous activity, whether this was associated with spontaneous pain, and whether any quantitative sensory testing was performed. Finally, we extracted the number of filaments that were being recorded from and how many of them were spontaneously active, again grouped into painful and nonpainful neuropathy groups vs healthy controls. Acquisition bias was not considered for microneurography recordings.
In all instances, data extraction proceeded by experiment, with some articles containing several experiments, and thus several pieces of information, each provided with their own unique experiment number. An experiment was defined based on whether it generated its own instance of spontaneous activity data, eg, spontaneous activity measured at a different time point, at a different site, or under a different condition was logged separately.
Because control data were lacking in most experiments, we chose to plot the percentage of spontaneously active fibres that were being reported. For statistics, we performed nonparametric tests, but given that this was not a hypothesis-testing endeavour and given the highly heterogeneous nature of the underlying data, we invite the reader to focus on the median and quartile ranges provided rather than on probability statistics.29
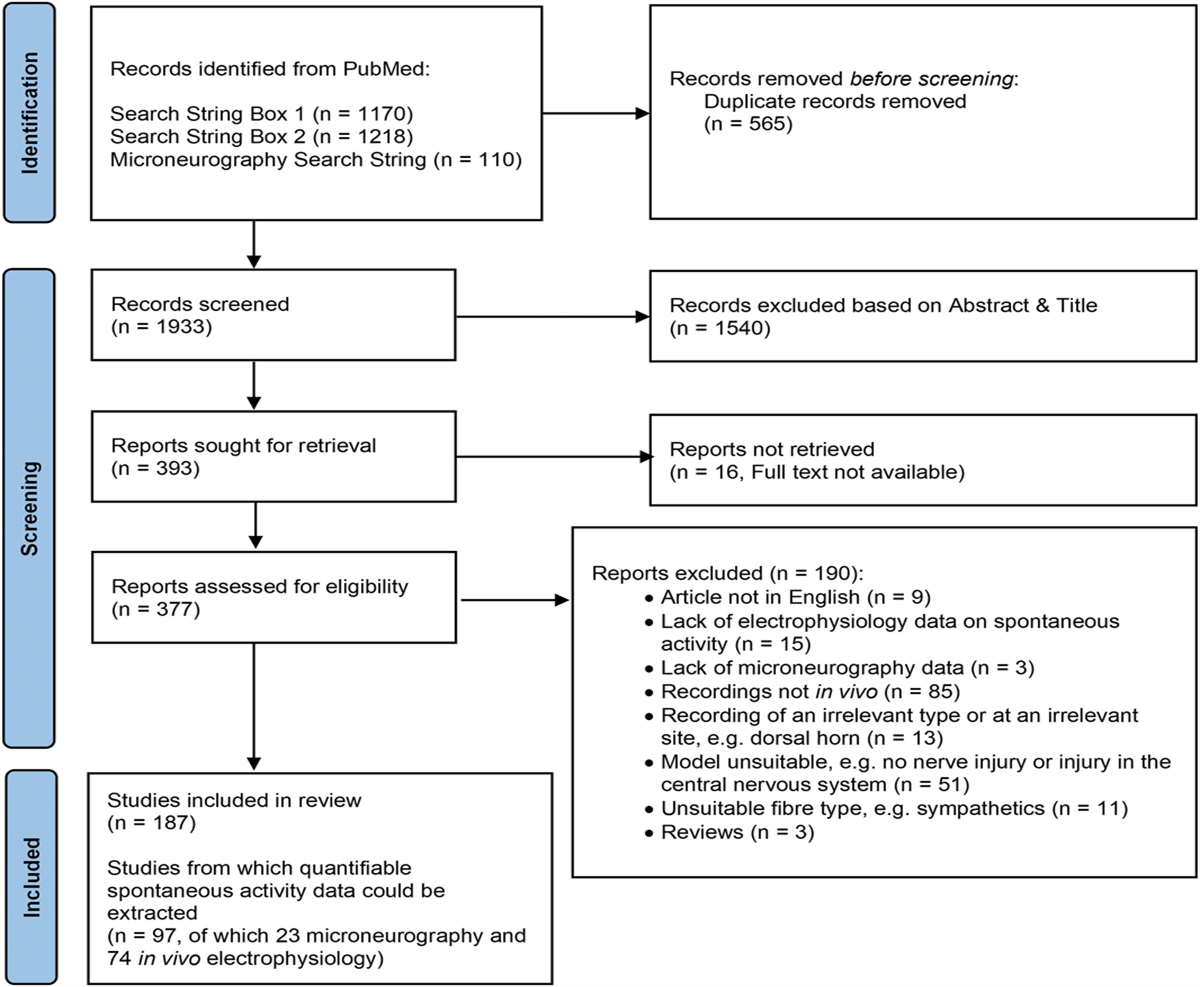
3. ResultsA study flow diagram starting from database search to extraction is illustrated in Figure 1. We obtained 1170, 1218, and 110 results on PubMed using the initial, second, and third search strings, respectively. After removal of 565 duplicates, primary screens based on title and abstract reduced the number of articles to 336 unique articles on nonhuman data and 57 articles on human microneurography data.
 Figure 1.:
 Systematic search flow chart.
During full-text screening, we excluded 190 articles for a variety of reasons specified in Figure 1 and the “reason_meta” column in Supplementary Table 1 (available at https://links.lww.com/PAIN/B958). Of the 187 articles that were subsequently included, 74 in vivo electrophysiology and 23 microneurography articles were taken for full quantitative data extraction, whereas the remaining 90 were processed qualitatively. For the former, we extracted spontaneous activity data from individual experiments. For the latter, we extracted other information, eg, on species, sex, condition, and/or nerve injury models.
3.1. Characterisation of included studiesOf the nonhuman experiments, we unsurprisingly found that the majority of recordings were performed in rats (65%, n = 122), whereas the remainder were performed in ferret (5%, n = 10), cat (4%, n = 8), mouse (3%, n = 6), and monkey (1%, n =1). Twenty-one percent of the studies we included (n = 40) were human microneurography studies (Fig. 2).
 Figure 2.:
 Rat and human data make up the majority of the dataset.
Among the nonhuman experiments, most studies were performed in male animals (62.6%, n = 92), whereas 12.2% used either only female or both sexes. The remaining 12.9% did not provide any information on sex. In human microneurography studies, the picture was reversed, with 67.5% of the work (n = 27) using both genders, 22.5% only females (n = 9), 7.5% only males (n = 3), and only 1 study not specifying (Fig. 3).
 Figure 3.:
 The majority of data collected from nonhuman studies (n = 147) were male-only, whereas human studies (n = 40) included both sexes. “Unclear” was used as a category in cases where no information on sex was provided.
3.2. High variability in experimental design and reporting practises between studiesAmong the articles we studied, there was significant heterogeneity in what was being reported. For example, nearly half of all articles we included (73 animals and 17 human studies, 48% of the total 187) could not be used for quantitative analysis. Most commonly, they failed to report the total number of fibres measured or the raw number of spontaneously active fibres, making it impossible to calculate the proportion of neurons with spontaneous firing. Also, many studies were designed to only record from spontaneously active units.
Of the 97 articles that could be used for full quantification, there was high heterogeneity among animal studies in terms of recording location and the site of injury (Table 1). Moreover, most studies in animals were on nonregenerating traumatic nerve injury models (76%), whereas human microneurography studies were relatively evenly split between recordings from healthy volunteers, those living with chronic primary pain conditions like fibromyalgia (“other”) and those living with nontraumatic neuropathy, eg, as a result of diabetes or chemotherapy (see Supplementary Table, tab “human,” column “disease condition” for the full list, available at https://links.lww.com/PAIN/B958). There was only one article on amputees, arguably a nonregenerating traumatic injury, and none that would mirror what passes as “regenerative” in animals, eg, nerve crush.
Table 1 - High heterogeneity between the studies with quantifiable data on spontaneous activity. Biological replicates N ≤ 4 N = 5-10 N = 11-20 N ≥ 20 Not reported Animal number 14 (19%) 22 (30%) 17 (23%) 3 (4%) 18 (24%) Patient number 5 (21%) 4 (17%) 8 (33%) 7 (29%) 0 Control groups No controls Not quantified Controls quantified Animal studies 31 (42%) 14 (19%) 29 (39%) Human studies 19 (79%) 0 5 (21%) Type of injury/disease Regenerating Nonregenerating Nontraumatic Other Healthy volunteers Model type in animals 13 (18%) 56 (76%) 4 (5%) 1 (1%) N/A Condition in humans 0 1 (4%) 8 (33%) 8 (33%) 7 (29%) Location of recording Dorsal root Sciatic nerve DRG Sural nerve Other Animal studies 17 (23%) 16 (22%) 9 (12%) 8 (11%) 24 (32%) Location of injury Sciatic nerve Sural nerve Inferior alveolar Saphenous Other Animal studies 41 (55%) 5 (7%) 6 (8%) 5 (7%) 17 (23%) The 97 studies we included for full quantification varied greatly in their experimental design, with varying n numbers, injury/disease type and location. Many of them also failed to provide recordings from control groups. NB: The table includes information on 2 separate experiments from one of the n = 23 human studies because they were conducted on 2 patients with divergent syndromes (study 250 in Supplementary Table, available at https://links.lww.com/PAIN/B958, on one individual with fibromyalgia and one with small fibre neuropathy). “Other” in animal models is a ventral rhizotomy; “other” in human conditions encompasses chronic primary pain conditions (fibromyalgia, chronic regional pain syndrome, and erythromelalgia) as well as pain because of tooth decay. DRG, dorsal root ganglia.Another major source of heterogeneity was that many articles did not include a control group, but simply measured the percentage of spontaneously active neurons in a pain condition. This was true for both in vivo electrophysiology on animal models, and even more so for microneurography data. Thus, 79% of microneurography studies did not include concurrent recordings from more than one condition, eg, a given article might only include data from neuropathy patients or only use historically generated control data. Similarly, 42% of animal studies did not include any control condition, whether it be sham, naïve, or vehicle-treated animals. There were also many studies that used the same control group for a series of experimental comparisons or did not provide quantifiable data on the level of spontaneous activity in their controls. In total, there were therefore only 29 articles that allowed for direct comparison between injury and control groups (39%).
Finally, regarding reporting practises, in vivo electrophysiology studies, as a rule, considered individual fibres or filaments as the unit of measurement used in discussions and subsequent statistical analyses. The total animals that were used to generate the filament data would either not be reported at all (24% of cases) or reported, but on a summary level. For example, an article might cite that they used n = 20 rats in total, but it would not be made clear which filaments were recorded in which animal. Much information on interanimal variability has therefore been lost from the literature examining spontaneous activity.
3.3. Quantitative spontaneous activity dataWithin the 74 articles containing quantitative data from nonhuman models, we extracted 126 experiments conducted on A fibres and 88 experiments on nociceptors, including C and Aδ fibres. For 21 experiments, the fibre type was not reported. The included studies used a large number of different neuropathic pain models, requiring 20 different terms to allow full categorisation, including spinal nerve ligation, chronic constriction injury, nerve crush, transection, nerve ligation (of the peripheral branch), neuroma, and chemotherapy-induced neuropathy (see column “injury_type” in Supplementary Table, available at https://links.lww.com/PAIN/B958).
Classifying these various neuropathic pain models into 4 broader categories showed that 76% of experiments were conducted on nonregenerative models (eg, nerve ligation), 18% on regenerative models (eg, nerve crush), 4% on nontraumatic neuropathic pain models (induced by chemotherapy, neuritis, or ischemia), and 1% on other injury models including rhizotomy, dorsal column transection, and disc rupture (Table 1 & Supplementary Table, available at https://links.lww.com/PAIN/B958 column “Model Type”). All recorded model categories showed an increase in the median percentage of spontaneously active fibres compared with controls (Fig. 4 and Table 2), with the difference reaching statistical significance for nonregenerating and nontraumatic categories (Mann–Whitney tests, q = 0.00001 and q = 0.0002, respectively). In the regenerating group, the mean rank of the injury group was higher (18.34) compared with the control group (12.81), but this difference was not statistically significant when examined with a Mann–Whitney t test.
 Figure 4.: The percentage of spontaneously active fibres was increased across all experimental categories. Plotted here is the percentage of spontaneously active fibres recorded at any time after injury in experiments categorised as “low bias.” Experiments that injured pure muscle afferents were excluded. Each dot is an experiment, and the lines represent the medians for each group (see Table 2 for values). Nonregenerating: n = 22 for control and n = 88 for injury; regenerating: n = 8 for control and n = 25 for injury; nontraumatic (neuritis & chemotherapy-induced neuropathy because of oxaliplatin, paclitaxel, and vincristine): n = 12 for control and n = 14 for injury; and other (rhizotomy & dorsal column transection): n = 1 for control and n = 3 for injury.
Table 2 -
Medians with lower and upper quartiles of the values plotted in Figures 4.
Control median
Control quartiles
Injury median
Injury quartiles
All experimental models
Nonregenerating
3.0
0-5
8.0
4-13.8
Regenerating
0.5
0-9.8
7.0
0-19.5
Nontraumatic
1.5
0-4.8
10.5
4.5-21
Other
11.0
10.0
1-25
Experiments with internal controls only
Nonregenerating
3.0
0-5
13.0
8-22.8
Regenerating
0.0
0-3
7.0
0-10
Nontraumatic
1.5
0-4.8
13.5
7-23
Other
11.0
25.0
Figure 4.: The percentage of spontaneously active fibres was increased across all experimental categories. Plotted here is the percentage of spontaneously active fibres recorded at any time after injury in experiments categorised as “low bias.” Experiments that injured pure muscle afferents were excluded. Each dot is an experiment, and the lines represent the medians for each group (see Table 2 for values). Nonregenerating: n = 22 for control and n = 88 for injury; regenerating: n = 8 for control and n = 25 for injury; nontraumatic (neuritis & chemotherapy-induced neuropathy because of oxaliplatin, paclitaxel, and vincristine): n = 12 for control and n = 14 for injury; and other (rhizotomy & dorsal column transection): n = 1 for control and n = 3 for injury.
Table 2 -
Medians with lower and upper quartiles of the values plotted in Figures 4.
Control median
Control quartiles
Injury median
Injury quartiles
All experimental models
Nonregenerating
3.0
0-5
8.0
4-13.8
Regenerating
0.5
0-9.8
7.0
0-19.5
Nontraumatic
1.5
0-4.8
10.5
4.5-21
Other
11.0
10.0
1-25
Experiments with internal controls only
Nonregenerating
3.0
0-5
13.0
8-22.8
Regenerating
0.0
0-3
7.0
0-10
Nontraumatic
1.5
0-4.8
13.5
7-23
Other
11.0
25.0
Numbers represent the percentage of spontaneous activity.
It is important to bear in mind that the controls in Figure 4 are not study-matched, so the results will be prone to batch effects, and only the largest effect sizes will be detectable. If only studies with their own control condition are considered, the number of experiments eligible for inclusion drop from 130 down to 42 (Fig. 5). The overall conclusions remain unchanged although, with the difference between control and neuropathy reaching statistical significance for nonregenerating and nontraumatic categories (Table 2, Mann–Whitney tests, q = 0.00001 and q = 0.000044, respectively). In the regenerating group, the effect was once again less clear, although the mean rank of the injury group was still higher (8.43) compared with the control group (6.58). In humans, of those studies included for full quantitative data extraction, there were 5 experiments on A fibres, 22 on C nociceptors and 1 that was unclear. Seven articles included individuals with chronic primary pain (eg, complex regional pain syndrome or fibromyalgia), 9 included those with neuropathies of some kind (eg, as a result of diabetes), 7 included healthy volunteers, and 1 study was performed on patients with pain as a result of tooth decay. The proportion of spontaneously active C fibres was higher in those individuals living with painful neuropathy compared with those living with nonpainful neuropathies and healthy controls (Fig. 6).
 Figure 5.: The percentage of spontaneously active fibres considering only studies with their own internal controls. Plotted here is the percentage of spontaneously active fibres recorded at any time after injury in experiments categorised as “low bias” that included their own controls. Experiments that injured pure muscle afferents were excluded. Each dot is an experiment, with the lines connecting control and neuropathy conditions (see Table 2 for median values). Nonregenerating: n = 22; regenerating: n = 7; nontraumatic (neuritis & chemotherapy-induced neuropathy because of oxaliplatin, paclitaxel, and vincristine): n = 12; and other (L5 ventral rhizotomy): n = 1.
 Figure 6.:
 The percentage of spontaneously active C fibres was higher in those individuals living with painful neuropathy. Each dot is data derived from an individual experiment. Median values indicated by the line are listed in the following (confidence intervals and n numbers provided in brackets): painful neuropathy: 34 (11-50, n = 9); nonpainful neuropathy: 12 (11-13, n = 2); healthy controls: 2 (0-7, n = 5). The dot in red is recorded from muscle C fibres, and the one in dark red from aging healthy volunteers.
A Kruskal–Wallis test between the 3 groups revealed a statistically significant difference, specifically between painful neuropathy groups and healthy controls at adj. P = 0.0028. Only 2 of the studies plotted in Figure 6 had their own internal controls,13,21 with one of them reporting increased firing in painful neuropathy (27% of fibres vs 13% of fibres13), whereas the other one only reported increased firing in neuropathy vs control, regardless of pain status (4% of fibres in healthy controls vs 7% and 11% in painful vs nonpainful neuropathy, respectively).21
Including only studies with their own concurrent control groups in the same article, we can extract data from only 5 studies on painful peripheral neuropathy, fibromyalgia, and pain because of tooth decay. Spontaneous activity was significantly increased in pain conditions compared with nonpainful controls, as summarised in Figure 7 (Mann–Whitney 2-tailed t tests, P = 0.0159).
 Figure 7.: The percentage of spontaneously active C fibres from human microneurography studies with concurrent control recordings. Each dot is data derived from an individual experiment. The line connects recordings made in control vs painful conditions. Data derive from 5 articles (2 studying patients with fibromyalgia, 2 studying patients with peripheral neuropathy, and 1 studying tooth decay): article numbers 32, 244, 246, 250, and 254 in Supplementary Table, available at https://links.lww.com/PAIN/B958).3.4. Impact of bias, fibre type, and time on spontaneous activity
To answer the question of how bias in the recording setup affected the percent of spontaneous activity recorded in the different fibre types, we split our nonhuman dataset according to our low-, medium-, and high-bias categories. We limited our analysis to nonregenerating traumatic neuropathic models and examined either A fibres (Fig. 8) or Aδ and C fibres (Fig. 9). The latter group are predominantly nociceptors; however, not all articles confirmed responses in the noxious range with receptive field stimulation. Moreover, much of the early literature did not further classify A fibres into Aβ and Aδ categories. Thus, the data in Figure 8 may include activity from some nociceptive Aδ fibres.
 Figure 8.: A fibres show increased spontaneous activity after injury when compared with control recordings. The data included in the plot are derived from experiments on A fibres recorded after injury of either mixed or cutaneous nerves in nonregenerative models. The line indicates the median values (provided in Table 3). The control group includes data from naïve, vehicle-treated and sham-injured animals. N numbers for control & injury groups: low bias n = 9 and 48; medium bias n = 2 and 21; high bias n = 1 and 11.
 Figure 9.: Putative nociceptors show spontaneous activity after injury when compared with control recordings. The data included in the plot are derived from experiments on C fibres and Aδ fibres recorded after injury of either mixed or cutaneous nerves in nonregenerative models. The line indicates the median values (provided in Table 3). The control group includes data from naïve, vehicle-treated and sham-injured animals. N numbers for control & injury groups: low bias n = 10 and 29; medium bias n = 5 and 20; high bias n= 3 and 5.
As expected, the percentage of spontaneously active fibres was higher in the medium- and high-bias groups, and this effect was particularly pronounced for Aδ and C fibres—putative nociceptors and therefore prone to sensitisation (Table 3). Accordingly, a mixed effects model revealed a main effect of injury for both A fibre and nociceptor experiments, but only a main effect of bias for nociceptor experiments: fixed effect of injury (A fibres): F(1, 86) = 9.885, P = 0.0023; fixed effect of injury (nociceptors): F(1,66) = 9.159, P = 0.0035; fixed effect of bias (nociceptors): F(1, 32) = 4.407, P = 0.049.
Table 3 - Medians with lower and upper quartiles of the values plotted in Figures 8–10. Control median Control quartiles Injury median Injury quartiles A fibres Low bias 2.0 0-5 8.0 3.6-13 Medium bias 1.0 0-2 16.0 8.5-23.5 High bias 0.0 16.0 14-50 Nociceptors Low bias 3.5 0-5.3 8.0 4-22.5 Medium bias 6.0 0.5-9 20.0 6.8-32.3 High bias 7.0 0-47 46.0 5.5-54 Fibre type Mixed 1.0 0-5 8.0 3-13.5 Cutaneous 3.0 3-3 14.0 5.3-28.5 Muscle 12.0 17.5 8-27.3Numbers represent the percentage of spontaneous activity.
To investigate whether muscle fibres indeed display more spontaneous activity, as is usually claimed in the narrative literature, we split low-bias experiments conducted on regenerative and non-regenerative models according to the type of nerve that had been injured: purely cutaneous (eg, sural), purely muscle (eg, gastrocnemius), or mixed (Fig. 10). Numerically, the median of the p
留言 (0)