
記住我
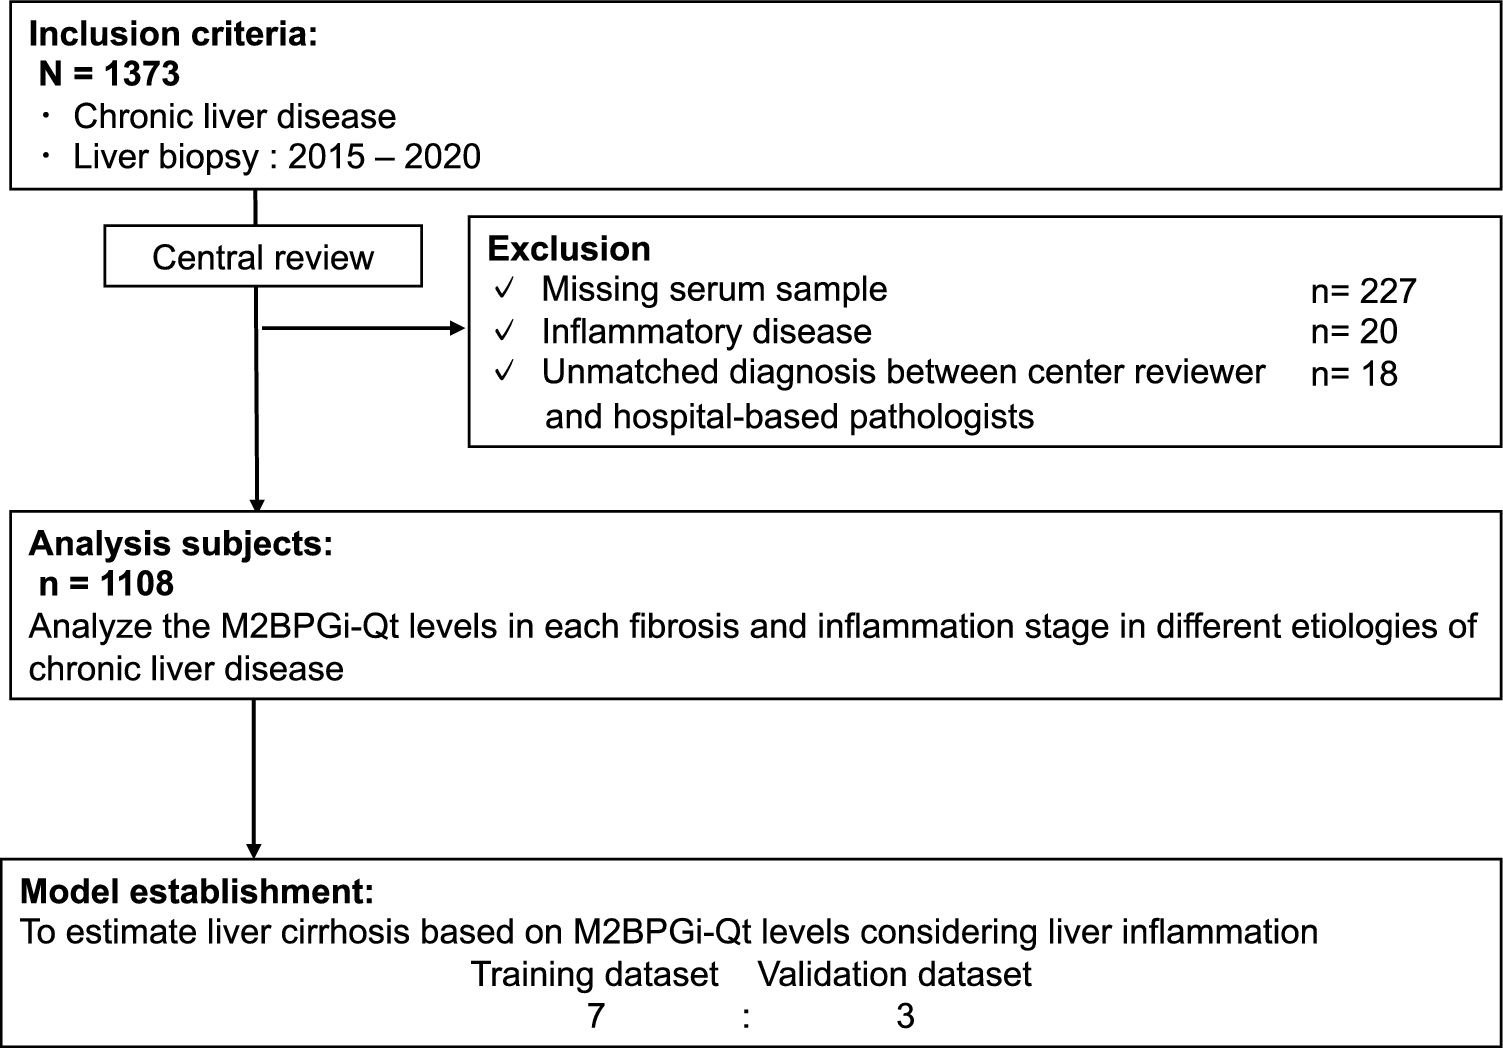
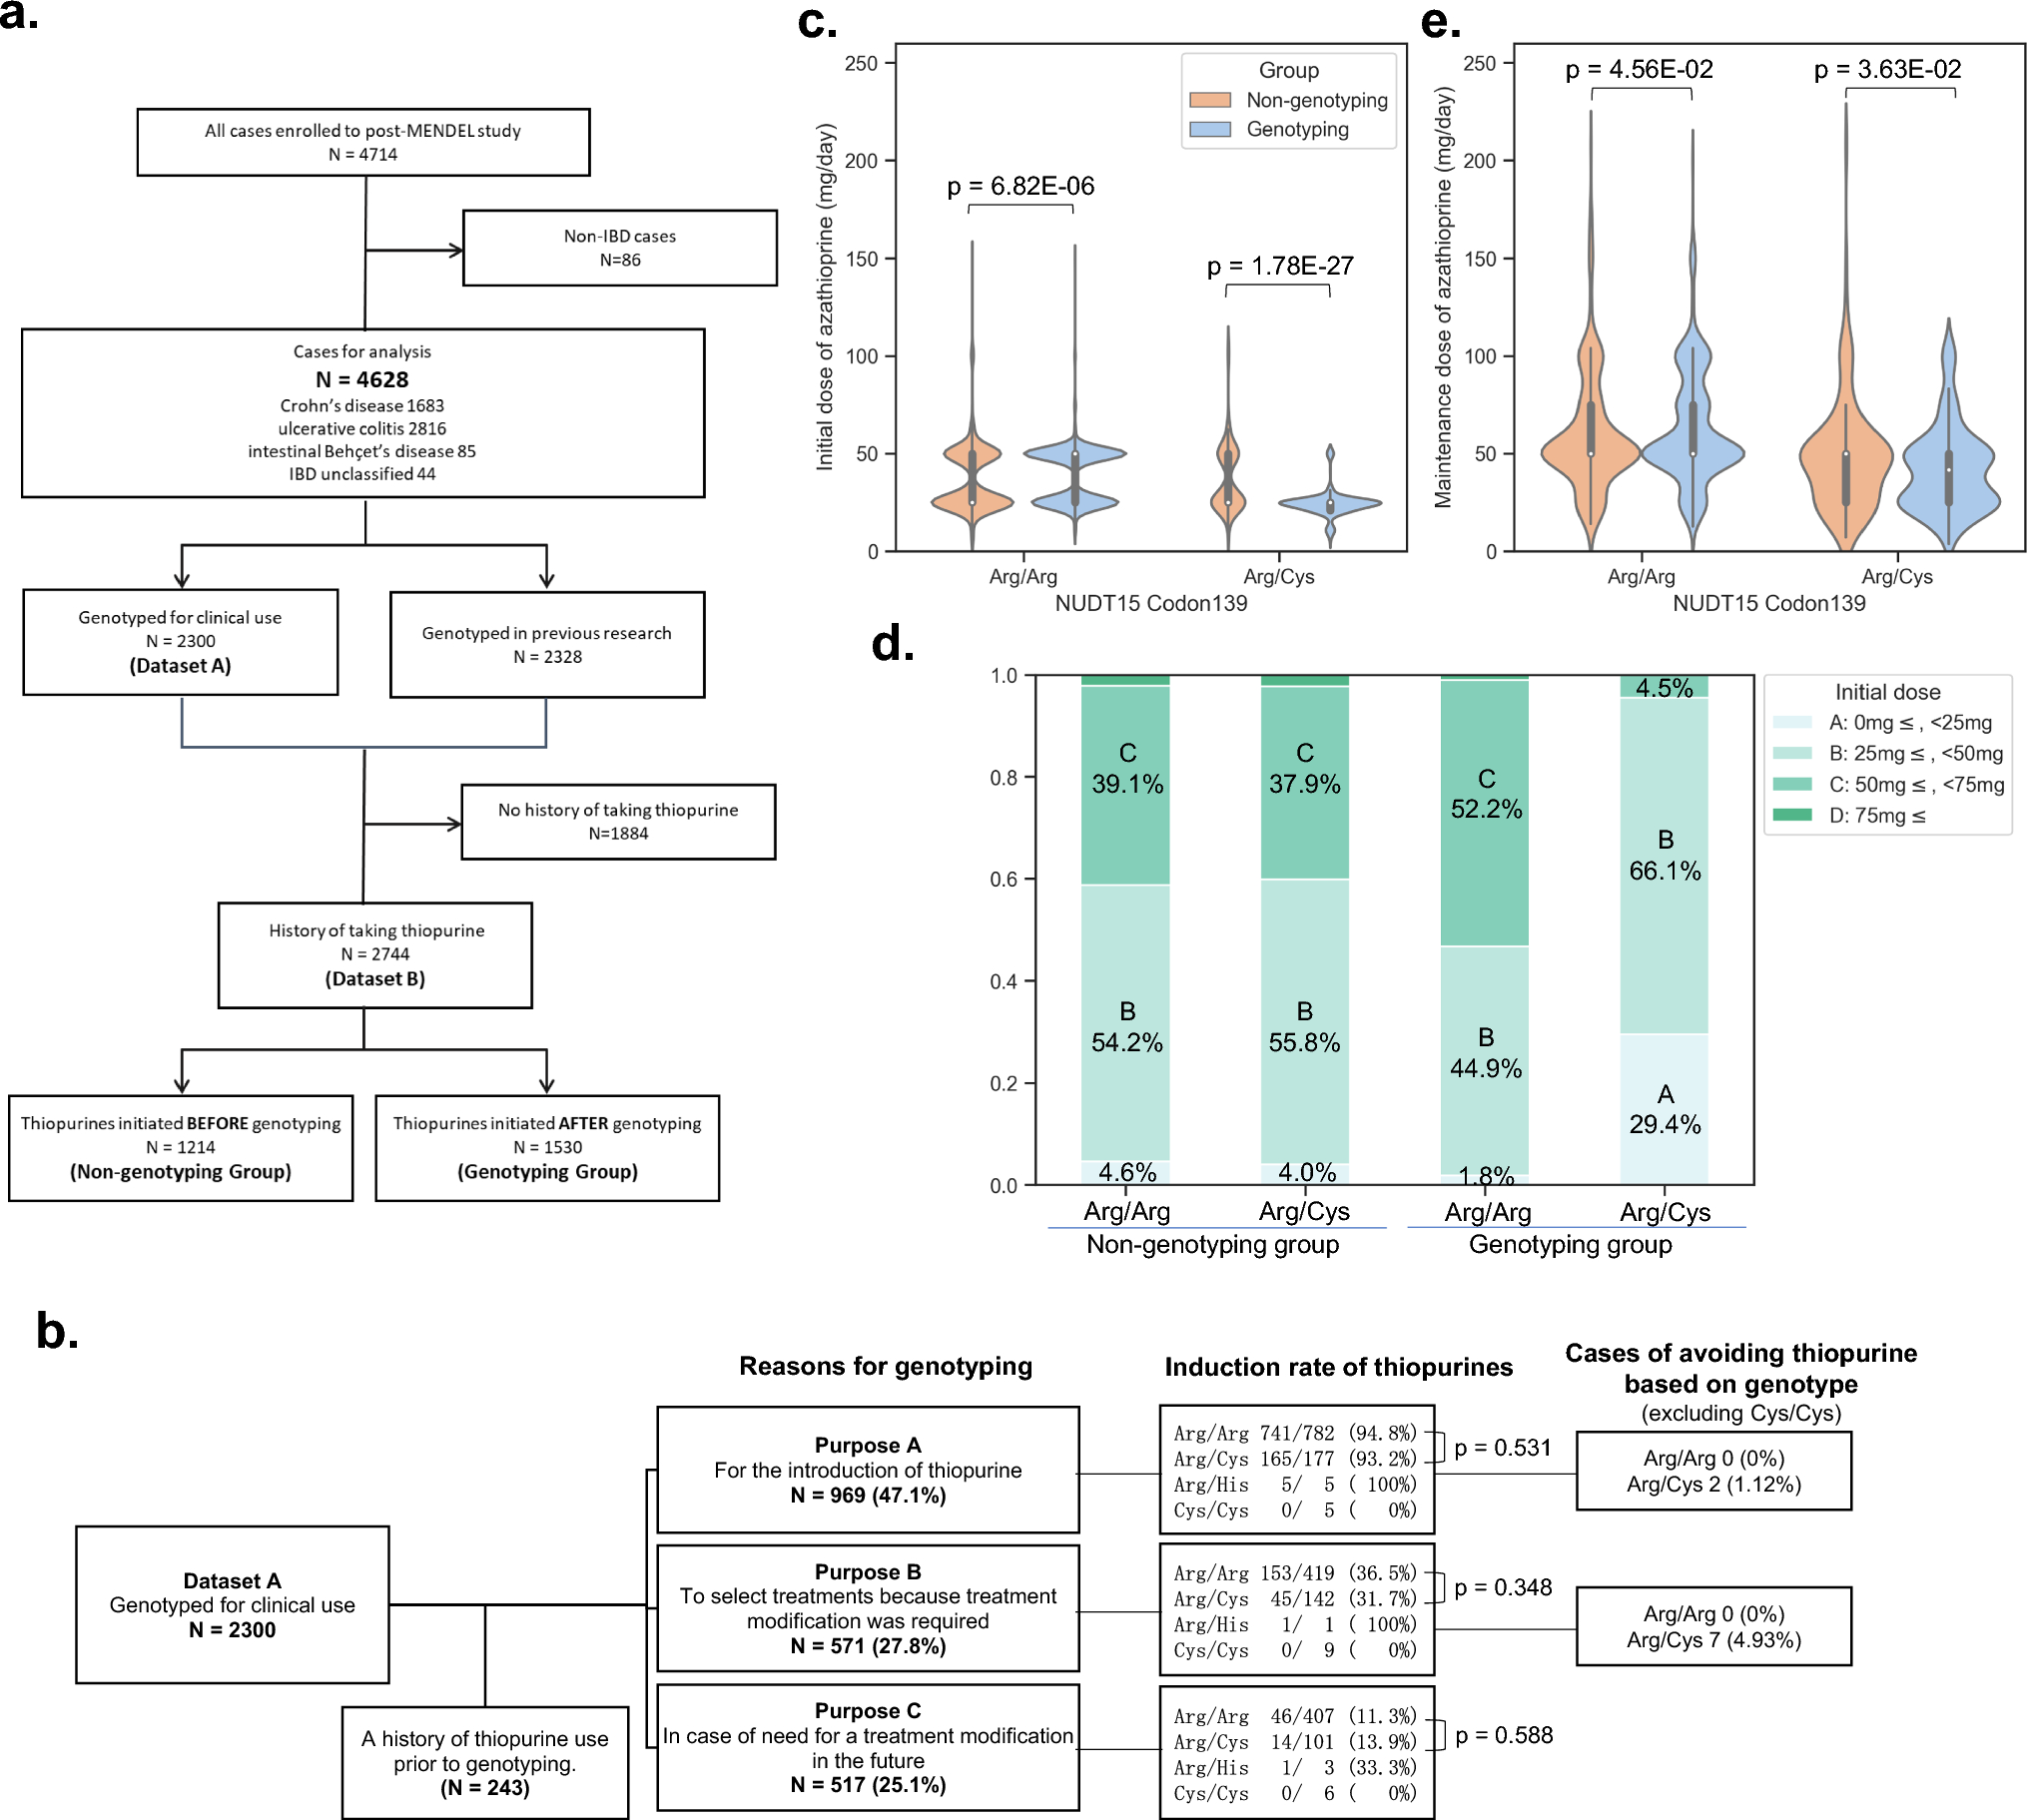

A total of 1373 patients with CLD were recruited; 265 of them were excluded because of missing serum samples, the presence of inflammatory diseases, or not meeting the diagnostic criteria according to the central reviewer. Thus, we excluded patients with NAFLD (n = 9), AIH (5), and PBC (4). The remaining 1108 patients were included in the final analysis (Fig. 1).
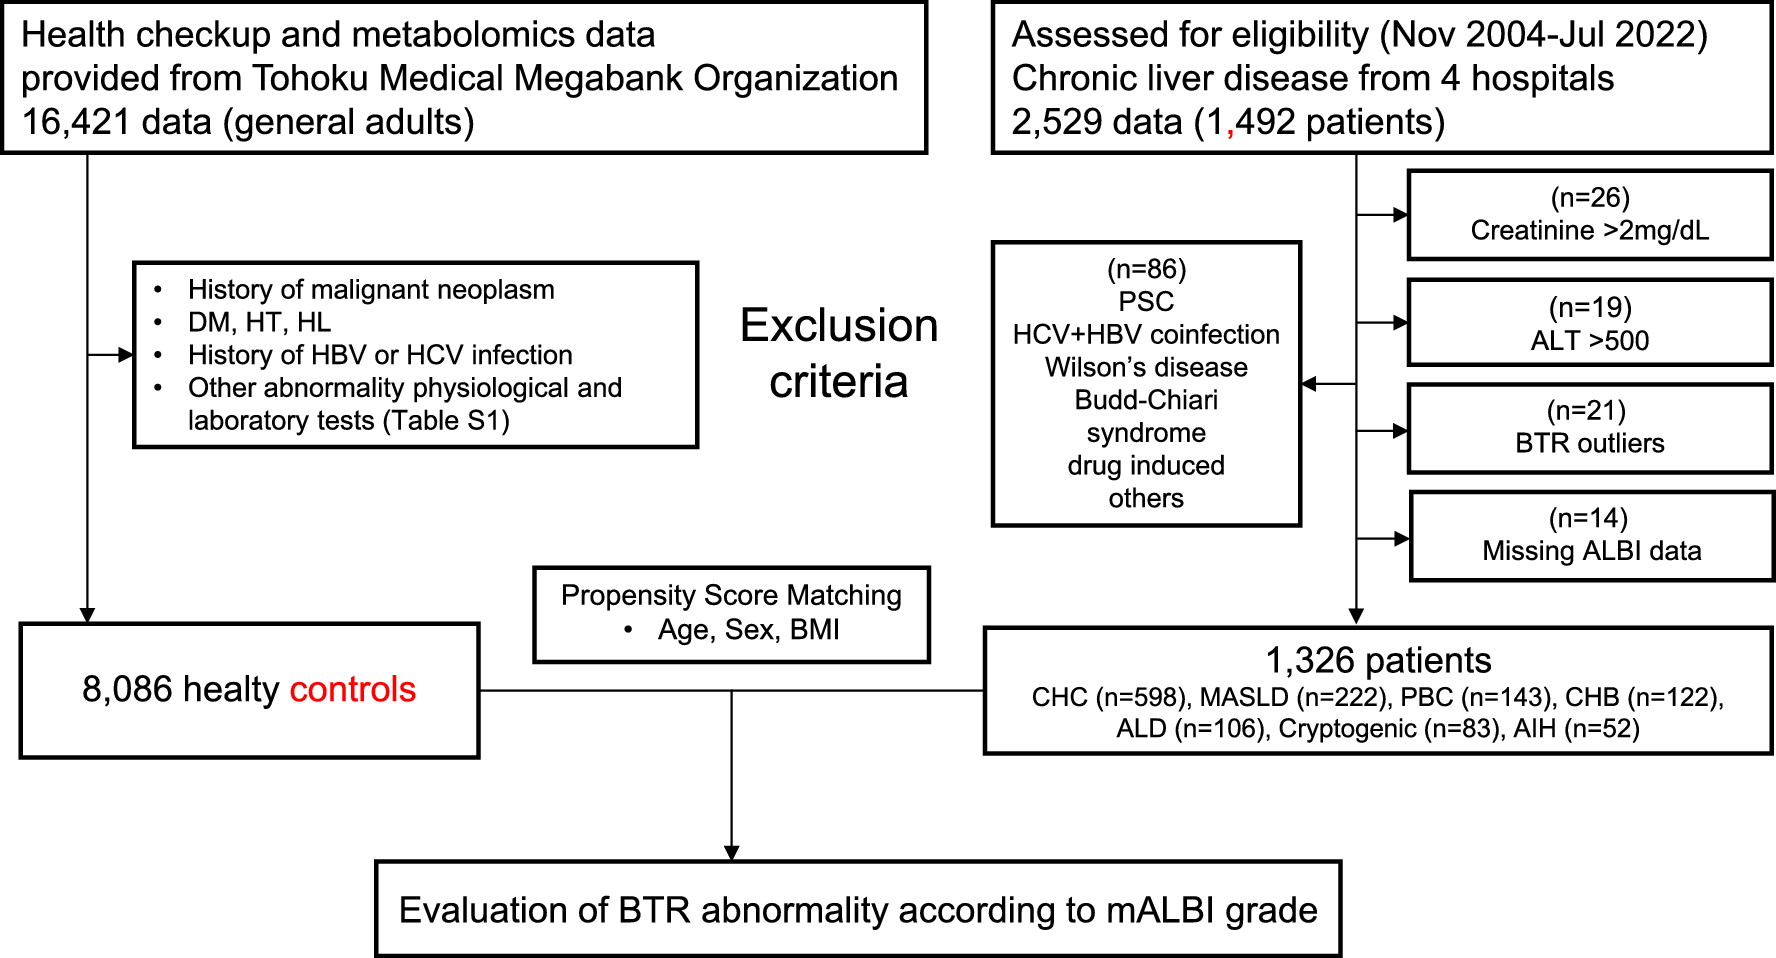
Fig. 1
Study flowchart. M2BPGi-Qt, quantitative measurement of Mac-2-binding protein glycosylation
Baseline characteristicsThe median age of the patients was 58.3 years; 480 participants (43.3%) were men, and the median BMI was 23.2 kg/m2. There were 506, 163, 158, 153, 111, and 17 patients with HCV infection, HBV infection, NAFLD, AIH, PBC, and ALD, respectively. Among patients with HCV infection, 159 achieved SVR. The number and frequency of patients with HBV who started antiviral therapy for HBV was 30 (81.6). The number and frequency of patients with AIH who started taking steroids was 15 (9.8). The number and frequency of each fibrosis stage were as follows: 145 (13.1), 395 (35.6), 248 (22.4), 193 (17.4), and 144 (13.0) for F0, F1, F2, F3, and F4, respectively (Table 1).
Table 1 Baseline clinical characteristicsM2BPGi-Qt level at each liver fibrosis stageThe correlation between the median M2BPGi-Qt levels and the fibrosis stage for each etiology is shown in Fig. 2. The levels of the M2BPGi-Qt biomarker increased as liver fibrosis progressed in patients with HCV and HBV based on the new Inuyama classification system. Specifically, the median M2BPGi levels were significantly higher in patients with advanced-stage fibrosis (F3) than in those with early-stage fibrosis (F2) (HCV F2 vs. F3, p = 0.039; HCV-SVR F2 vs. F3, p < 0.001; HBV F2 vs. F3, p = 0.002, respectively). According to the NAFLD and ALD based on the NAS classification, the median M2BPGi-Qt levels increased with the progression of fibrosis stage in patients with NAFLD. However, ALD was not evaluated owing to an insufficient number of cases. M2BPGi-Qt levels were significantly higher in patients with mild fibrosis (F2) than in those with early-stage fibrosis (F1) (NAFLD F1 vs. F2, p = 0.001). In patients with PBC assessed using the Nakanuma classification system, there was a trend indicating a positive correlation between M2BPGi levels and the stage of fibrosis. However, the sample size of patients with LC (stage F3) was not sufficiently large to establish statistically significant conclusions regarding this correlation. In contrast to the other patient groups, the median M2BPGi-Qt levels were not strongly associated with the degree of fibrosis in patients with AIH.
Fig. 2
Correlations between M2BPGi-Qt levels and fibrosis stage. Data are expressed as median. The M2BPGi-Qt levels were compared among the fibrosis stages for each etiology using the Jonckheere–Terpstra test. HCV infection, HBV infection, and AIH were determined based on the new Inuyama classification system; NAFLD was based on the SAF score, and PBC was based on the Nakanuma classification. HCV hepatitis C virus, HBC hepatitis B virus, AIH autoimmune hepatitis, M2BPGi-Qt quantitative measurement of Mac-2-binding protein glycosylation isomer, PBC primary biliary cholangitis, SVR sustained virological response
Influence of liver activity stage on M2BPGi levelsThe correlation between the median M2BPGi-Qt levels and the activity stage for each etiology is shown in Fig. 3. The M2BPGi-Qt levels increased with the progression of liver activity in patients with HCV, HBV, and AIH, indicating that higher M2BPGi-Qt levels are associated with more advanced stages of liver activity. Especially in patients with AIH, the numbers of patients with activity stages A2 and A3 were relatively high. A significant difference between each stage was observed (AIH A0 vs. A1, p = 0.05; A1 vs. A2, p < 0.001, A2 vs. A3, p < 0.001). In contrast to those in the other patient groups, M2BPGi-Qt levels slightly increased with the progression of activity stage in patients with NAFLD (A0 vs. A1, p = 0.994; A1 vs. A2, p = 0.004; A2 vs. A3, p = 0.161; A3 vs. A4, p = 0.362).
Fig. 3
Correlations between M2BPGi-Qt levels and activity stages. Data are expressed as median. M2BPGi-Qt levels were compared among the activity stages for each etiology using Jonckheere–Terpstra test. HCV infection, HBV infection, and AIH were determined based on the new Inuyama Classification system and NAFLD based on the NAFLD activity score
Cut-off values for M2BPGi-Qt levels in different fibrosis stages within each etiology of CLDThe respective AU/mL for the fibrosis stage using ROC curves for M2BPGi-Qt levels is shown in Fig. 4. A positive correlation between the M2BPGi-Qt cut-off values and fibrosis severity was observed in patients with various liver disease etiologies, excluding AIH. The AUC values for M2BPGi in predicting different stages of fibrosis (≥F1, ≥F2, ≥F3, and ≥F4) in both HCV and NAFLD were relatively high. The cut-off values for estimating LC in HCV, HBV, NAFLD, AIH, and PBC were 2.80, 2.35, 2.36, 2.50, and 1.54, respectively. The cut-off value of M2BPGi-Qt levels for estimating LC was the highest in patients with HCV among the various etiologies.
Fig. 4
Receiver operating characteristic curves for each fibrosis stage and etiology. The area under the receiver operating characteristic curve
Liver inflammation-related clinical factorsThe logistic regression analysis determined whether there was a significant relationship between the high and low activity stages based on the New Niyama classification. Activity stages were categorized as high (Stage 2 and 3) or low (Stage 0 and 1). M2BPGi-Qt, AST, ALT, ALP, total bilirubin, albumin, platelet count, and prothrombin time were identified as significant variables in the univariate analyses. The multivariate analyses confirmed that M2BPGi-Qt, ALT, total bilirubin, and albumin, and platelet count were independent factors differentiating the two groups (Supplementary Table 3).
Model establishment using M2BPGi-Qt for LCTo establish an algorithm that can improve the accuracy of fibrosis staging based on M2BPGi-Qt, the number of training and validation datasets was 775 and 333, respectively. No significant difference was observed between the groups overall; however, the frequency of men in the training dataset tended to be relatively higher than that in the validation dataset (p = 0.064) (Supplementary Table 4).
From the regression analysis of liver activity-related clinical factors, five variables (M2BPGi-Qt, ALT, total bilirubin, and albumin, and platelet count) were selected. Subsequently, we used these variables in the multivariate logistic regression analysis of the training cohort to establish a new algorithm for diagnosing LC using the M2BPGi-Qt level (Table 2). The M2BPGi-Qt level, ALT level, and platelet count were identified as significant independent predictors. This set of predictors was combined to establish the following predictive equation:
Table 2 Logistic regression analysis of estimating the liver cirrhosis in the training cohort$$}:\mathrm2}\hspace=\hspace[}2} (}/})/[\mathrm(}/})}^\hspace\times \hspace\mathrm\hspace(^/\mathrm)].$$
MAP-R had a high AUC value for predicting LC in the training and validation datasets (0.759, 95% CI 0.709–0.810 and 0.702, 95% CI 0.595–0.796, respectively), and the AUC values of MAP-R were significantly different from those of M2BPGi-Qt (all p < 0.001; Fig. 5 and Supplementary Table 5). Furthermore, the NRI and IDI values of MAP-R were significantly different from those of the M2BPGi-Qt level (all p < 0.001).
Fig. 5
ROC curves of the MAP-R, M2BPGi-Qt, and algorithm-based score models for the diagnosis of liver cirrhosis. A Training cohort, B validation cohort. MAP-R Mac-2-binding protein glycosylation isomer-to-ALT and platelet ratio. M2BPGi-Qt quantitative M2BPGi measurement. APRI AST-to-platelet ratio index, FIB-4 fibrosis 4
We also conducted a sub-analysis, specifically the differential diagnostic performance of M2BPGi and MAP-R across various liver disease etiologies (Supplementary Table 6). The AUC of MAP-R was higher than that of M2BPGi and was therefore better in distinguishing LC in patients with viral hepatitis, NAFLD, and AIH. However, the AUC of MAP was lower than that of M2BPGi in patients with PBC.
Comparison of MAP and algorithm-based score models for predicting LCComparison of predicting LC in all enrolled patients using MAP and algorithm-based score models is presented in Supplementary Table 7. MAP-R had the highest AUC value for predicting LC (0.748, 95% CI 0.703–0.793), and the AUC values of MAP-R were significantly different from those of ALBI score, and APRI (APRI p = 0.001 and ALBI p < 0.001). In contrast, there was no significant difference in the AUC values between the MAP-R and FIB-4 indices (p = 0.213). The NRI values were significantly different between MAP-R and the PRII, and ALBI (APRI p < 0.001 and ALBI p = 0.003). In contrast, there was no significant difference in the NRI values between the MAP-R and FIB-4 indices (p = 0.998). The IDI values of MAP-R were significantly different from those of the FIB-4 index, APRI, and ALBI (all p < 0.001).
留言 (0)