
記住我
In this study, we conducted a nationwide survey and isolated a total of 147 CRECs from March 2020 to September 2022. These isolates were obtained from 11 provinces in China, including Zhejiang, Guangdong, Henan, Xinjiang, Inner Mongolia, Tibet, Shandong, Hunan, Hubei, Ningxia, and Fujian (Fig. 1A, Table S1). Notably, all isolates were derived from stool samples of apparently healthy individuals, accounting for 2.90% of the total screened samples (147/5064). The geographical distribution of the samples covered a substantial portion of China, with a population of approximately 619 million individuals. This comprehensive sampling approach provides valuable insights into the prevalence and distribution of CREC isolates across different regions in China.
Fig. 1
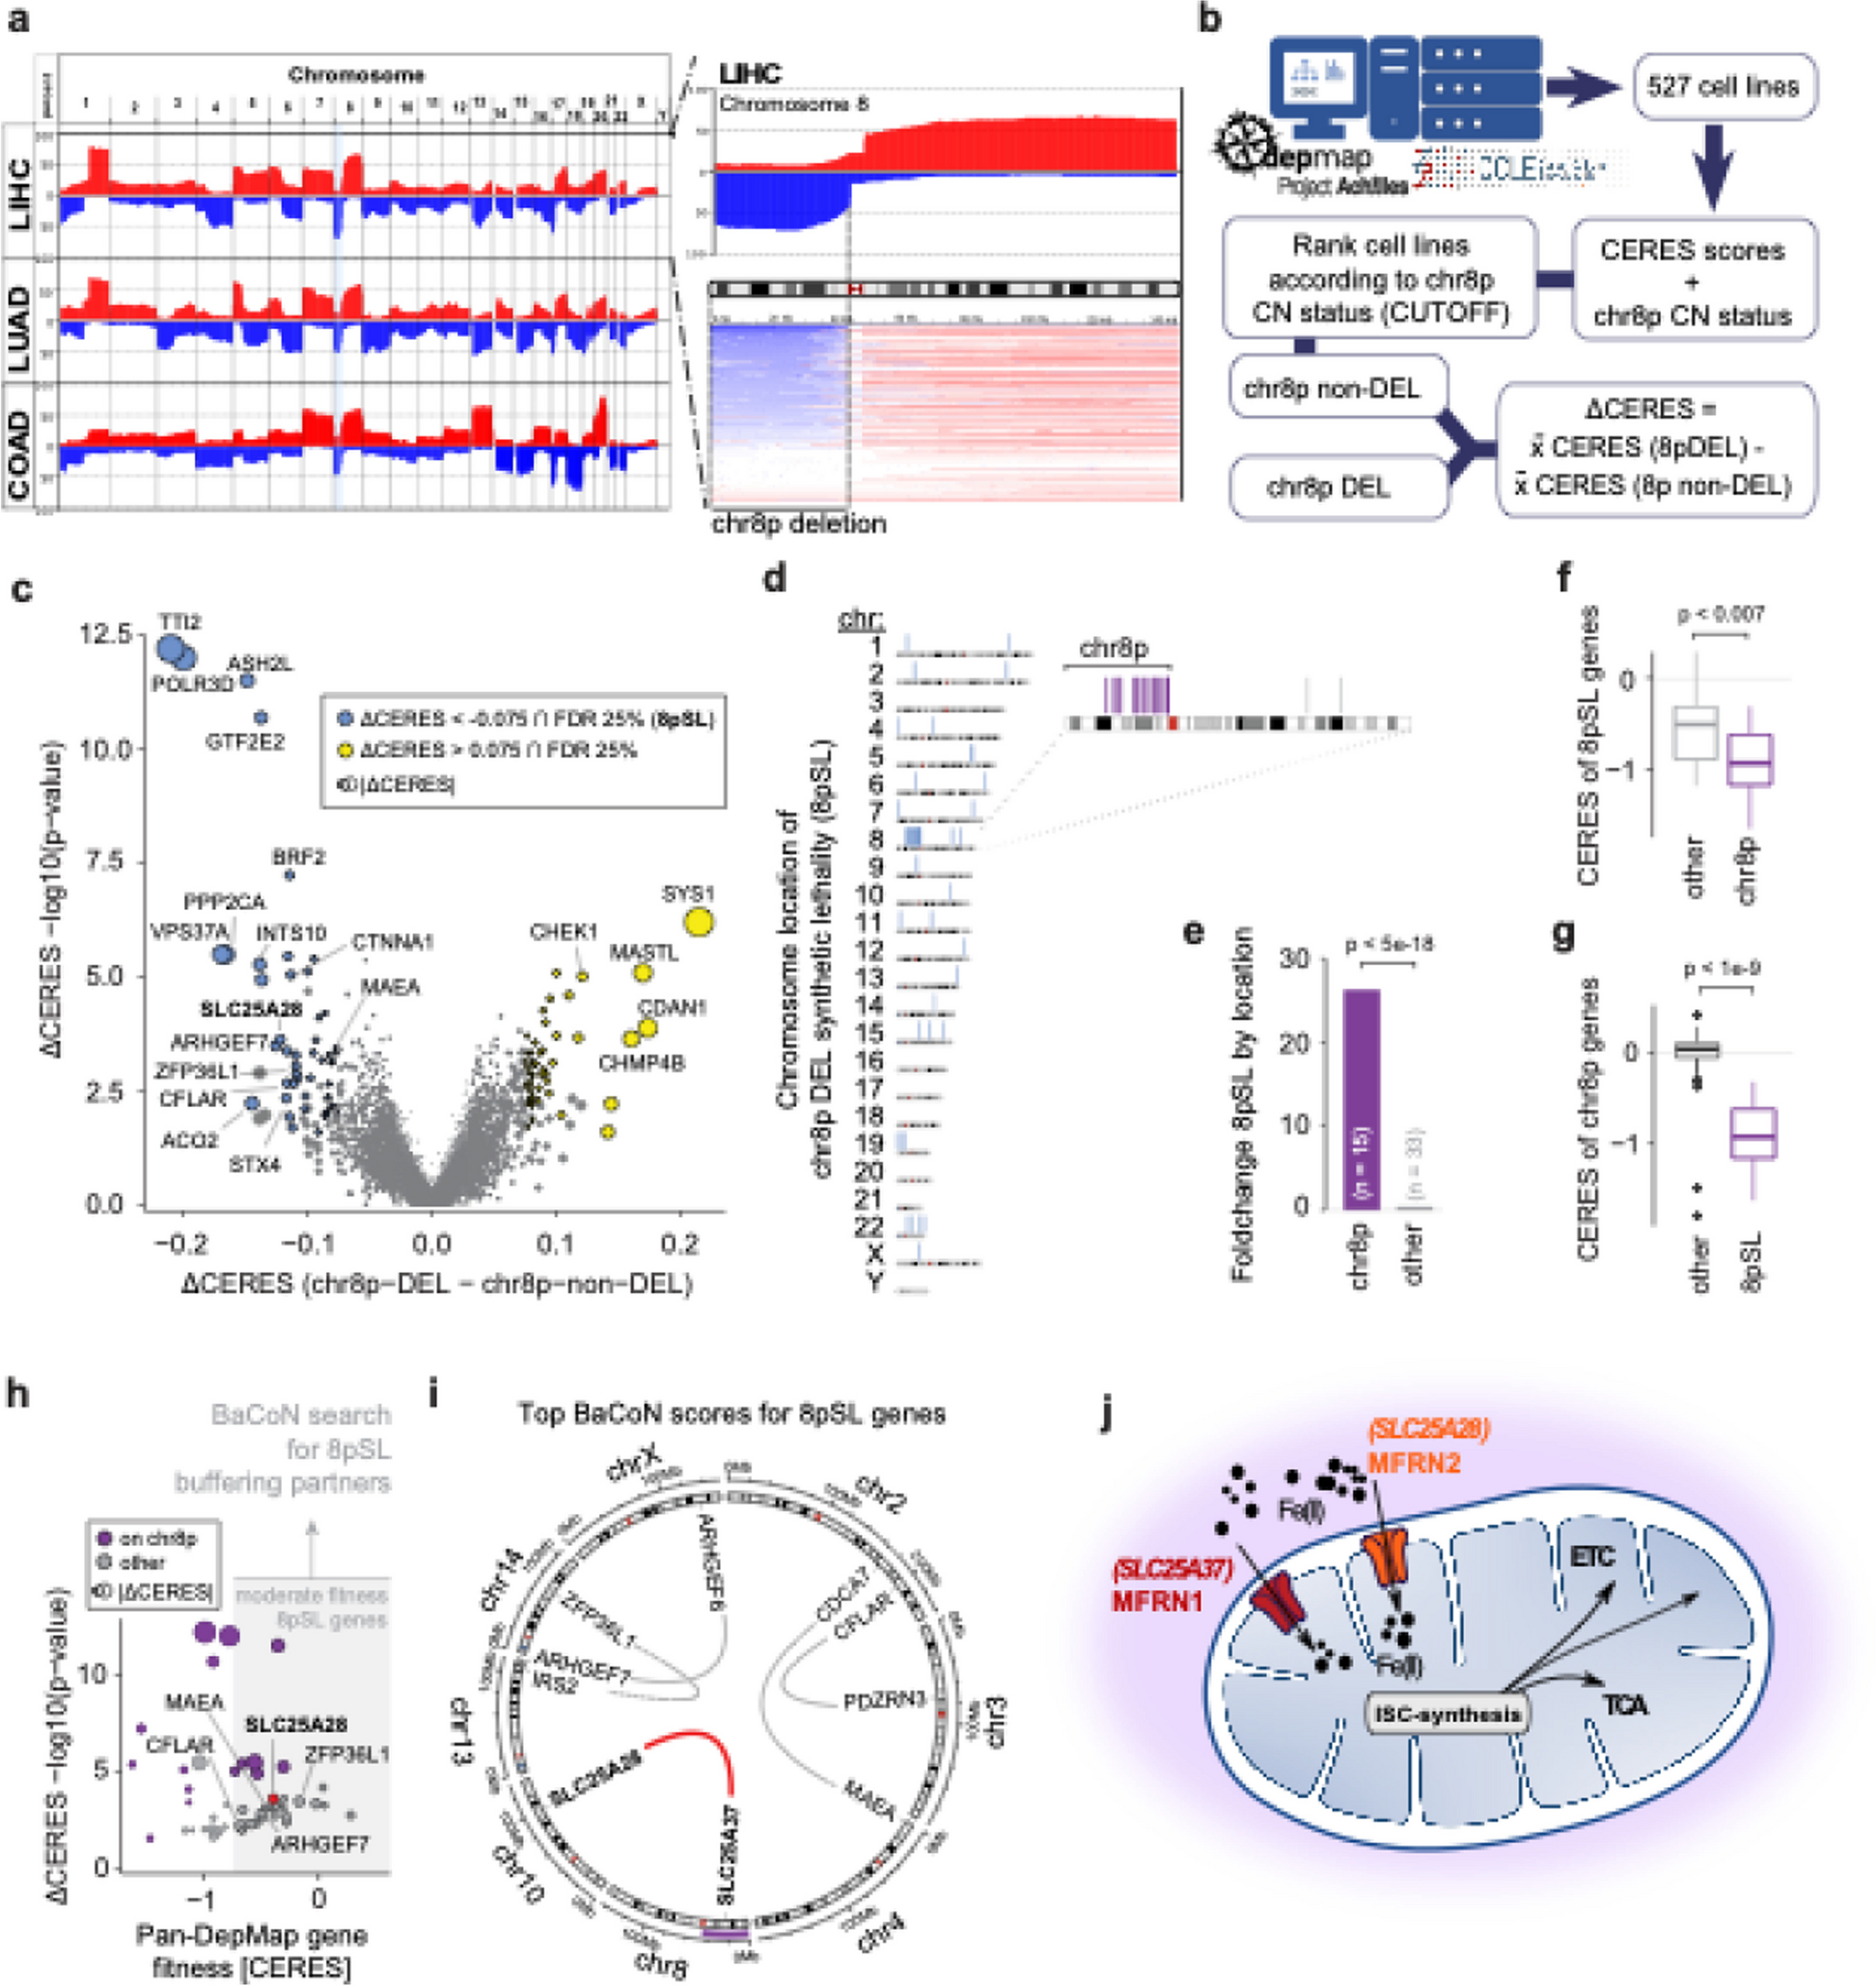
Distribution and prevalence of CRECs and corresponding carbapenemases in China. A Prevalence of CRECs in healthy individuals in China. Different colors represent the number of CRECs. B Bar graph showing the number of carbapenemases by year. C Bar graph displaying the percentage of different carbapenemases by year. D Bar graph displaying the number of different carbapenemases by regions. E Bar graph displaying the percentage of different carbapenemases by regions
Among these CREC isolates collected from healthy individuals, a total of seven carbapenemase genes, including blaNDM-1, blaNDM-4, blaNDM-5, blaNDM-6, blaNDM-9, blaNDM-39, and blaOXA-48, were detected (Fig. 1B–E). Notably, the blaNDM-5 gene was the most prevalent carbapenemase gene (78.91%, 116/147), followed by the blaNDM-1 gene (15.65%, 23/147). Four isolates were found to carry the blaNDM-9 gene. However, the blaNDM-6,blaNDM-4, blaNDM-39, and blaOXA-48 genes were each detected in only one isolate, respectively. The number of the blaNDM variants in the CRECs increased gradually over time, with the blaNDM-5 gene dominated among the carbapenemase genes in different years. Furthermore, blaNDM-5 was the dominant carbapenemase gene in all regions except Fujian and Tibet.
Antimicrobial susceptibility testing and ARGs diversity of CREC isolatesAmong the tested carbapenems, CREC isolates showed the highest resistance rate to ertapenem (93.20%), followed by meropenem (92.52%) and imipenem (89.12%). All CREC isolates showed high-level resistance to the third- or fourth-generation cephalosporins and their combination with β-lactam inhibitors (91.84–100%). However, a limited number of isolates exhibited resistance to colistin (3.40%), tigecycline (4.08%), and amikacin (11.56%) (Table S2). The phenotype could in most cases be explained by carriage of the corresponding ARGs. Other than carbapenemase genes, CREC isolates also carry multiple ARGs including genes conferring resistance to beta-lactams (blaCTX-Mn = 49, blaTEMn = 87, and blaSHVn = 67), sulfonamide (sul1 n = 58, sul2 n = 70, sul3 n = 67), aminoglycoside (aac(3)-II n = 31, aac(3)-Iva n = 55, aadA n = 147, rmtB n = 15), and tetracycline (tet(M) n = 28). In addition, twelve and two CRECs were found to carry the mcr-1 gene and the tet(X4) gene, respectively.
To explore the relationship between carbapenemase genes, other ARGs, and insertion sequences, a correlation network graph was constructed (Fig. S1). The network graph revealed strong associations between certain genetic elements. In particular, IS21, ISEc10, ISEc20, blaCTX-M-15, blaEC-5, blaOXA-1, and ISEc24 were strongly positively associated with blaOXA-48 (R > 0.3, p < 0.05). Similarly, IS414 was positively associated with blaNDM-1 (R > 0.3, p < 0.05). ISEc46 and IS903 were positively associated with blaNDM-4 (R > 0.3, p < 0.05). The blaNDM-5 gene was positively correlated with IS10R but negatively correlated with blaNDM-1 (R absolute value > 0.3, p < 0.05). blaCTX-M-65 was positive associated with blaNDM-6 (R > 0.3, p < 0.05). In addition, IS1326, IS1353, IS10R, blaCTX-M-65, aac(6')-II, and aadA22 showed positive associations with blaNDM-9 (R > 0.3, p < 0.05).
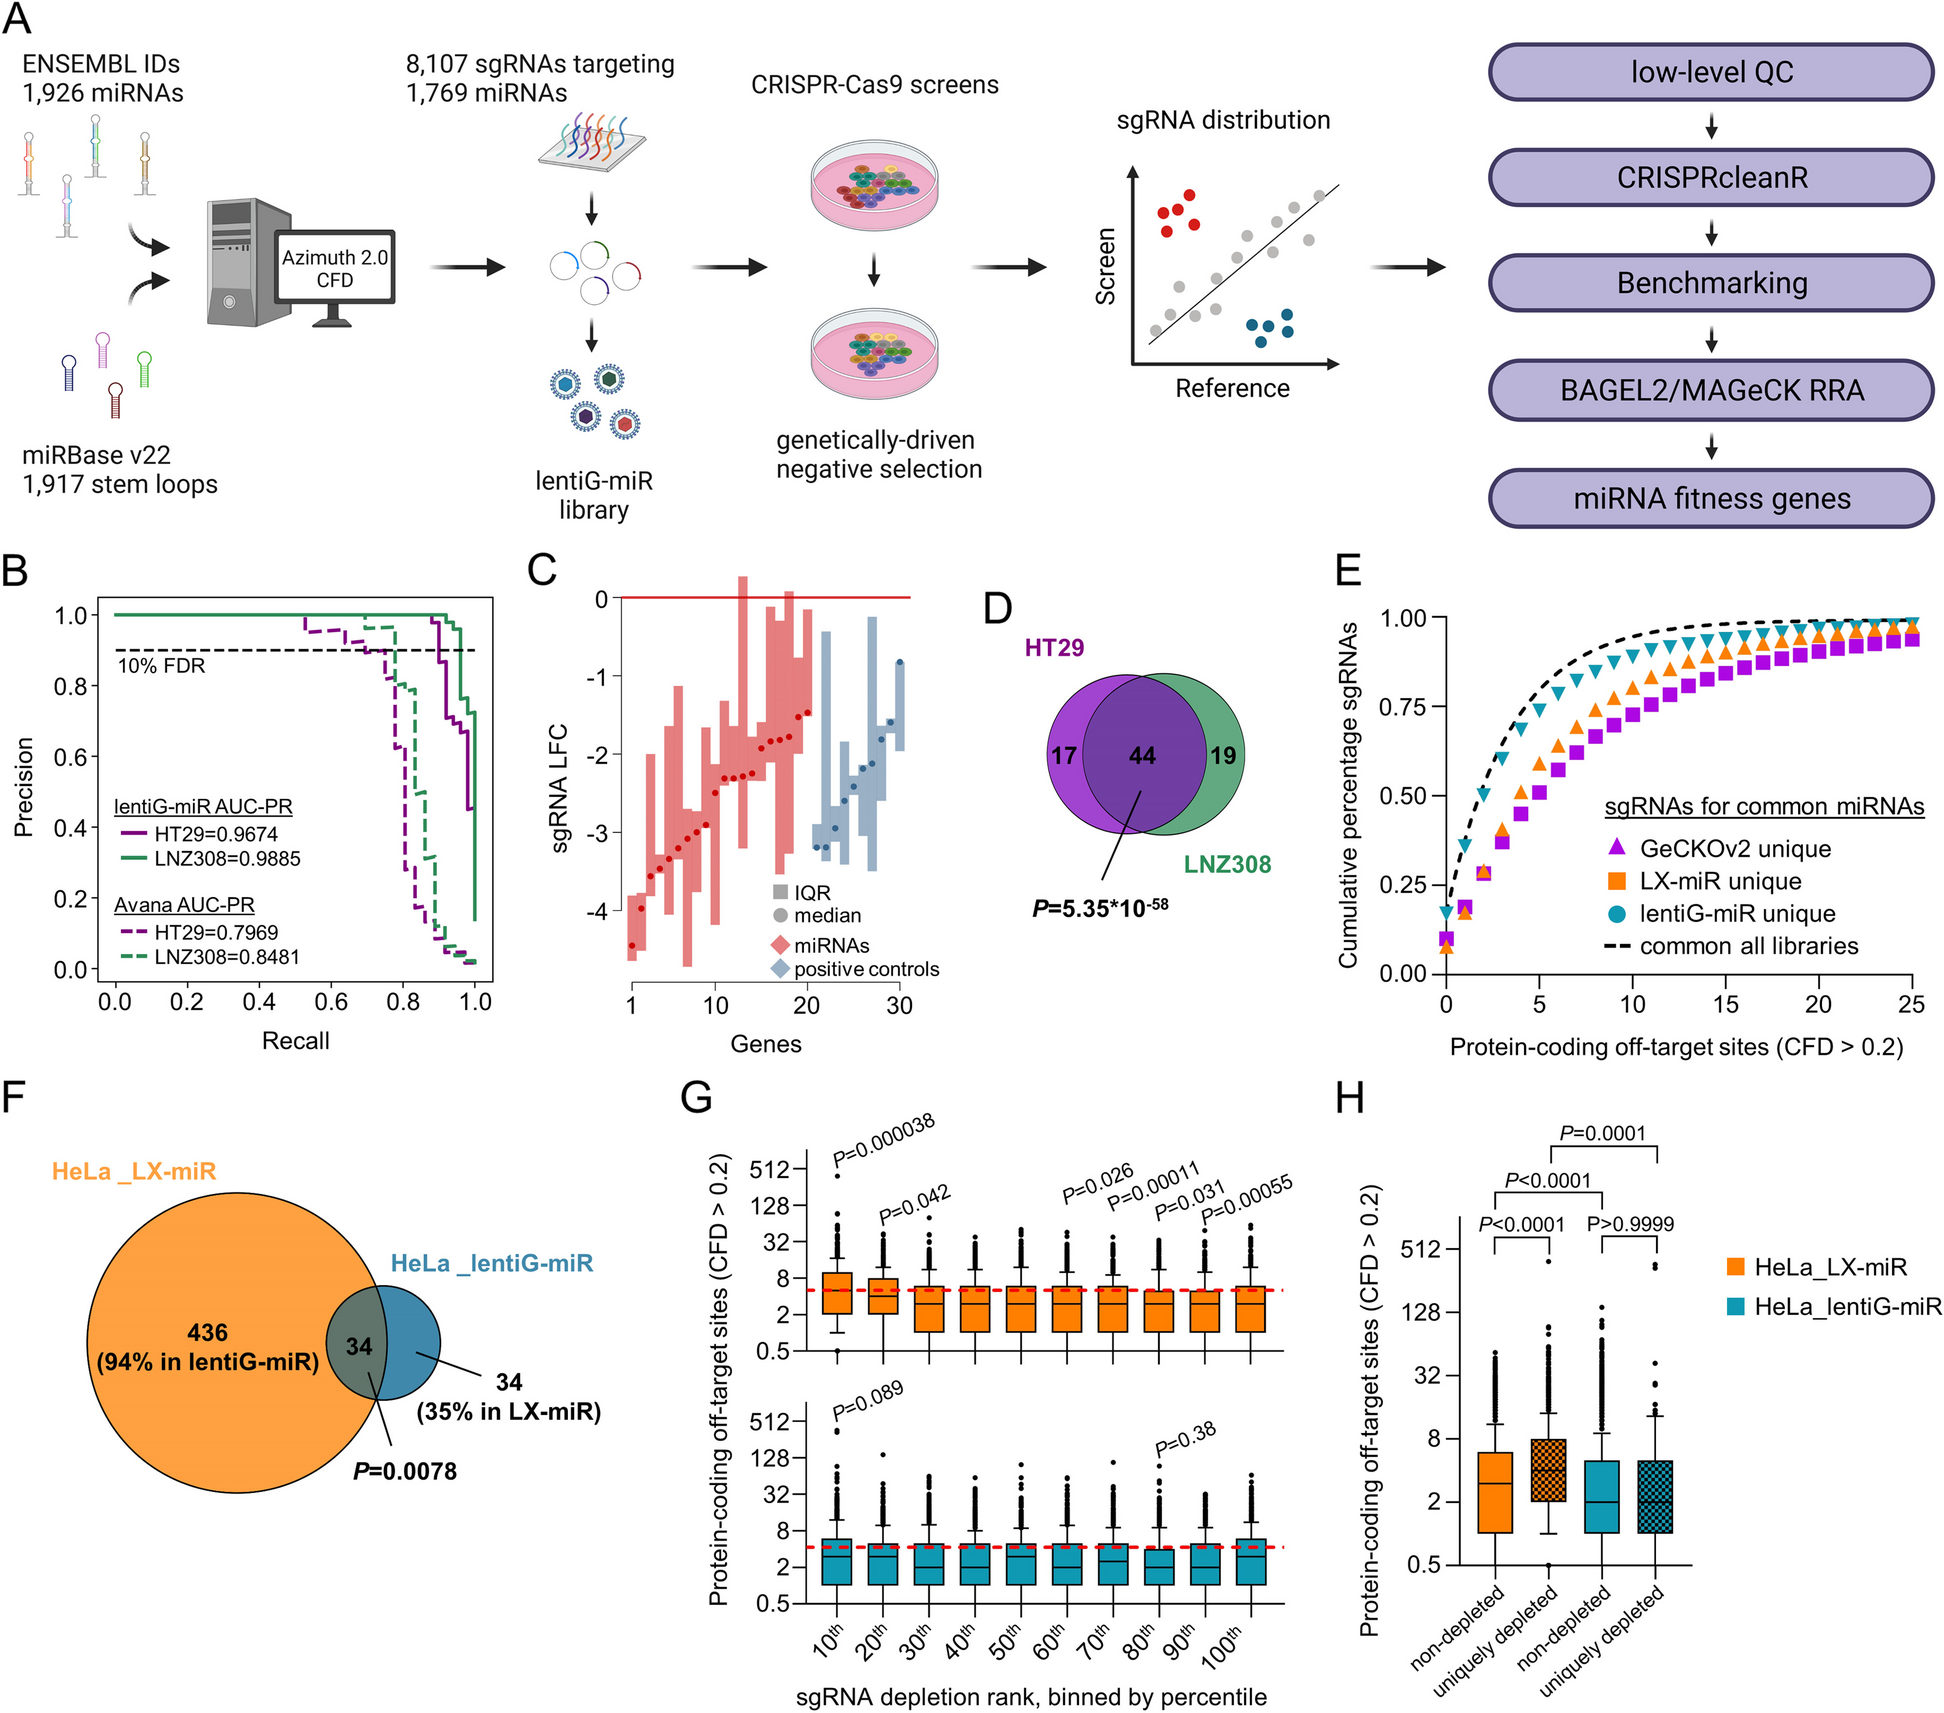
Transmission of CREC multiple clonesThe 147 CREC isolates belonged to 64 known STs, none of which exhibited a dominant prevalence. Our subsequent analysis revealed a significant correlation between the distribution of some STs and the geographical locations of the isolates, as demonstrated by the patterns depicted in Fig. 2A. Among the 64 STs, ST224 was the most widely dispersed ST, which was detected in five provinces and exhibited a relatively high isolation rate (10/147, 6.80%). Moreover, ST224 was also the predominant ST of the mcr-1-positive CRECs in this study. In terms of time distribution, only ST48 CREC was detected in all three years (Fig. 2B). The number of STs has been increasing over time. In addition, we found that some STs showed a corresponding relationship with carbapenem resistance genes. All ST410 and ST155 isolates were positive for blaNDM-5 (Fig. 2C). The blaNDM-4, blaNDM-6, and blaNDM-39 genes were only found in ST10, ST361, and ST746 isolates, respectively.
Fig. 2
Minimal spanning tree of CREC isolates. A STs distribution of CREC isolates in different regions. B STs distribution of CREC isolates in different years. C STs distribution of different carbapenemases
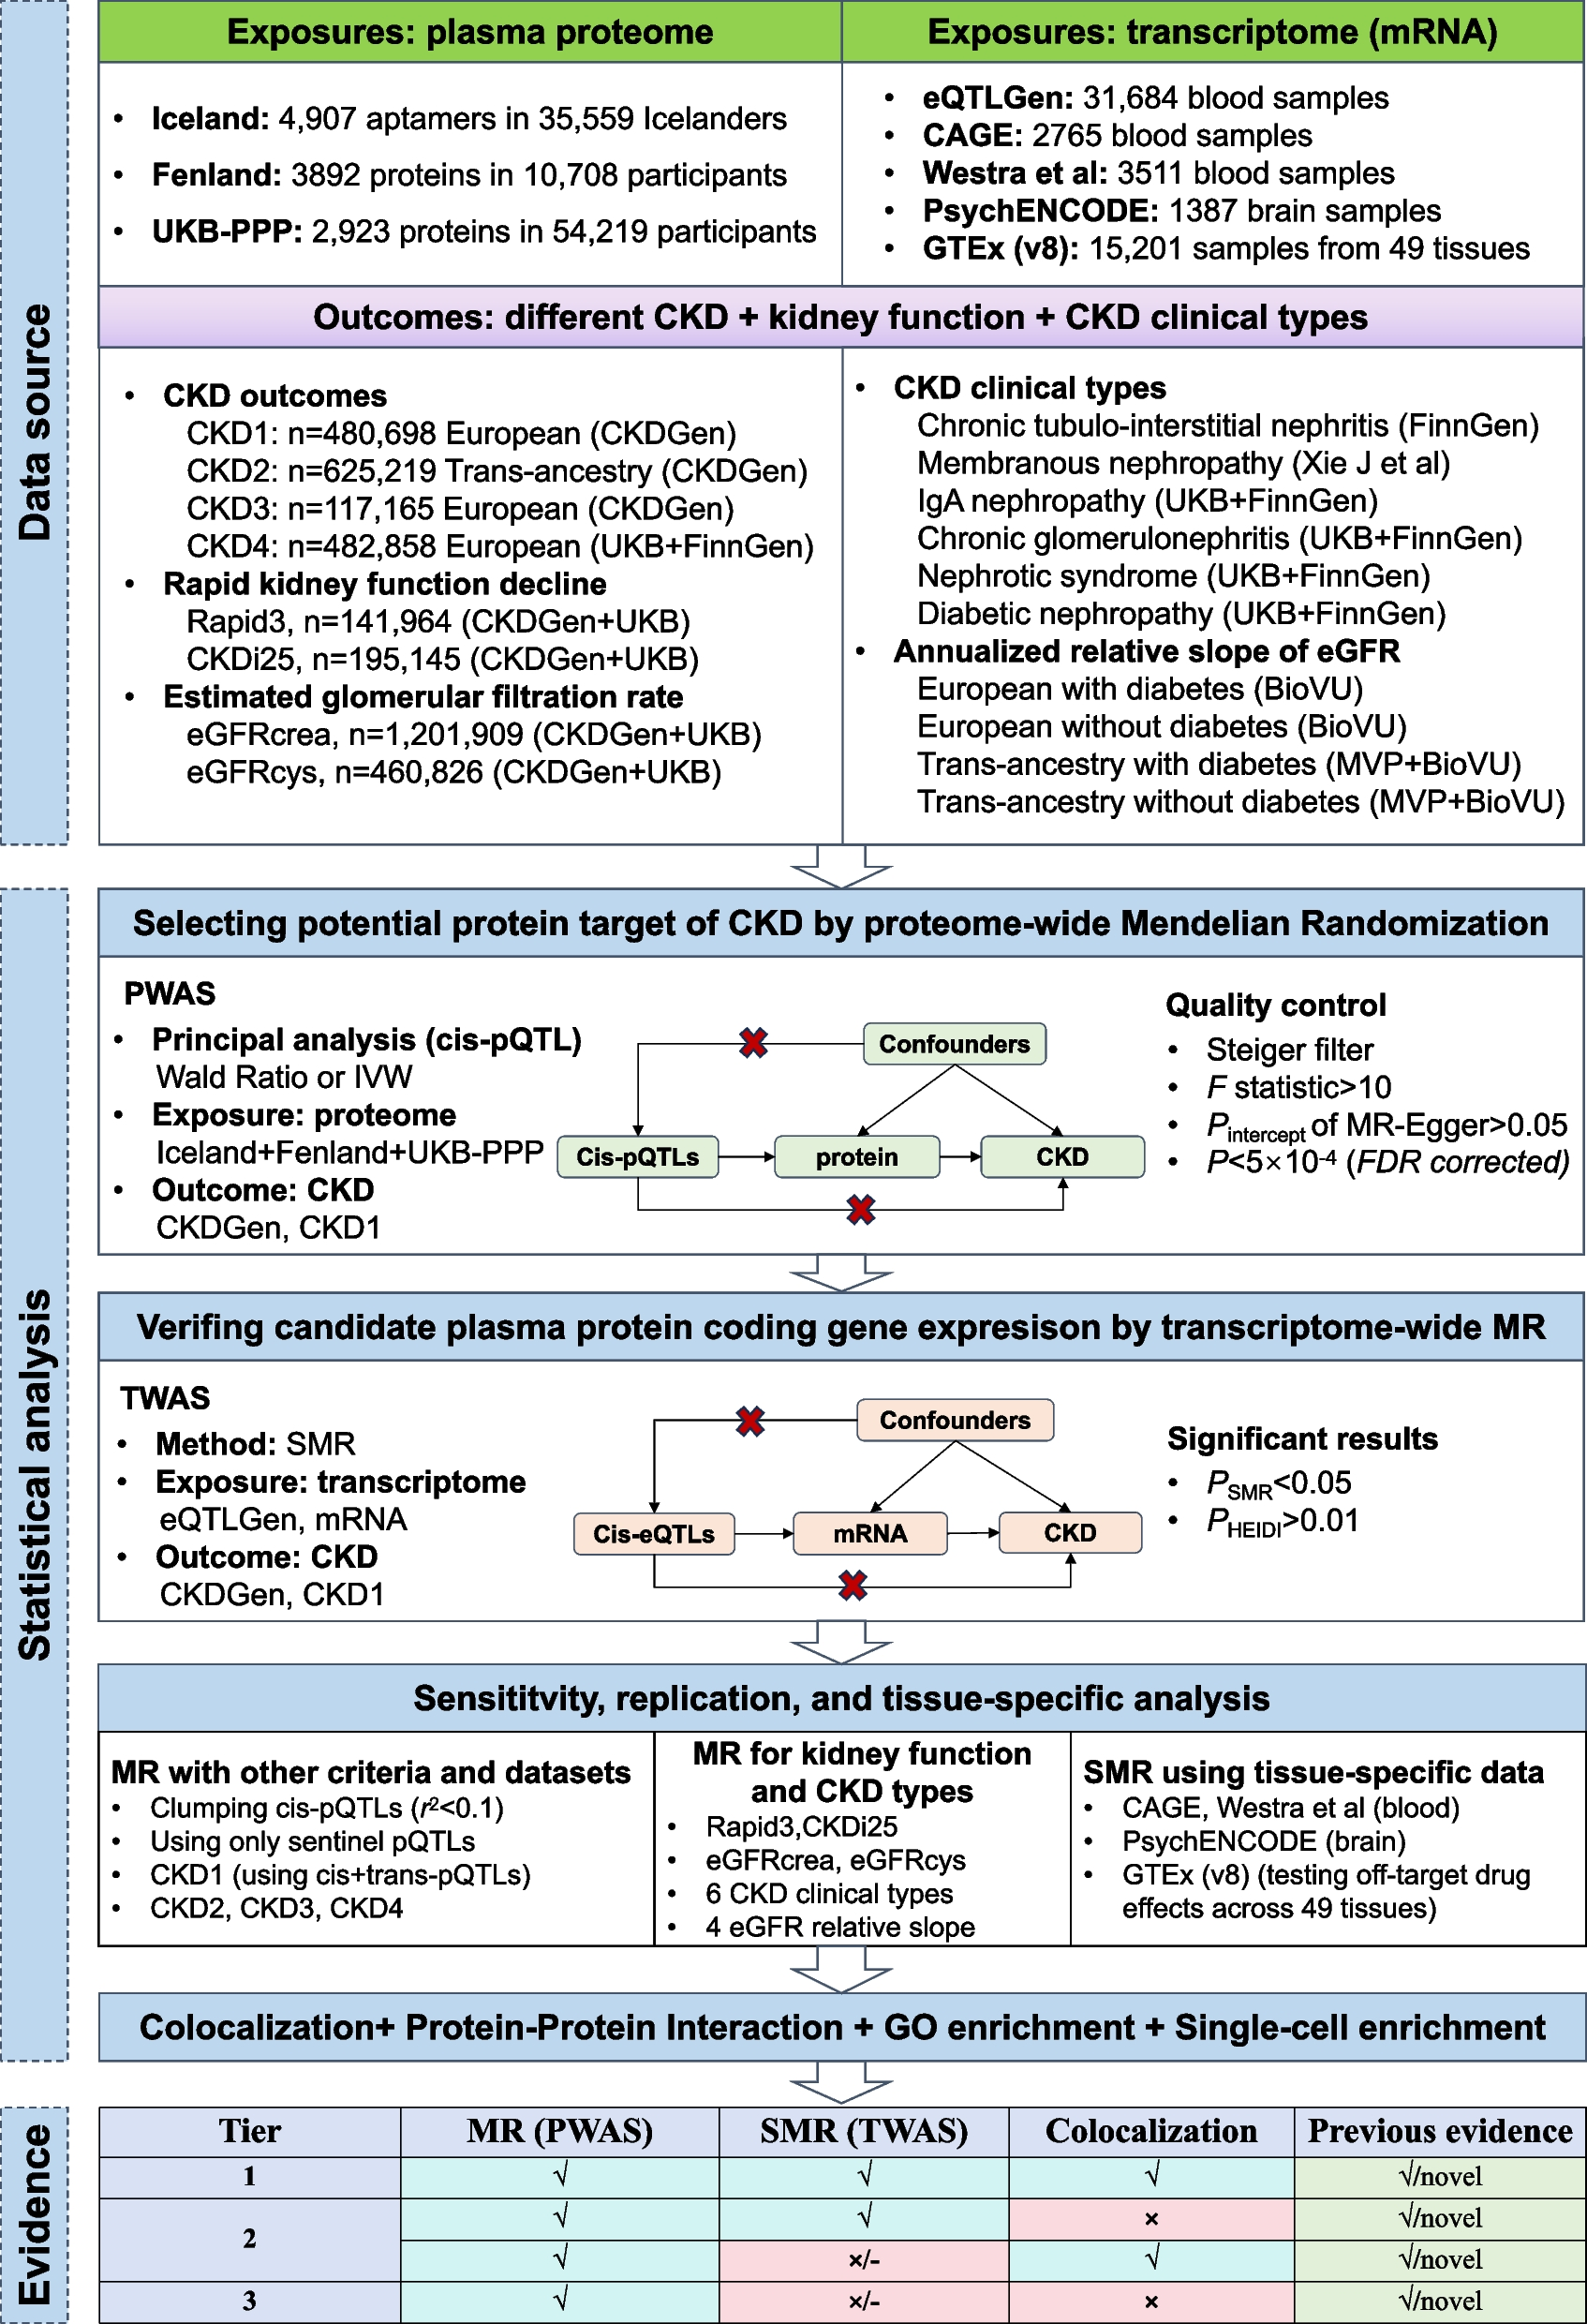
The classification of phylogenetic subgroups demonstrated that the 147 CREC isolates were distributed into 7 phylogroups (A, B1, B2, C, D, F, and G), but the majority of them were in group A (61/147, 41.50%) and B1 (60/147, 40.81%) (Fig. 3). Serotype prediction revealed that there was no dominant serotype among the CREC isolates, and the most frequently isolated serotypes were O8:H9 (n = 6) and O88:H31 (n = 5). Furthermore, we observed a pronounced genetic resemblance among strains situated within the same clusters in the shadow, characterized by a high degree of similarity (≤ 20 SNPs), suggestive of clonal transmission. Subsequent analyses identified a total of 19 such clusters, with strains distributed across diverse STs, all of which exhibited multidrug resistance.
Fig. 3
Phylogenetic tree of 147 CREC isolates from China. Isolates located in the light green or light blue shaded areas contained only a few SNPs differences (n ≤ 20). The resistance genes are indicated by square, solid graphics indicate yes, hollow no
Conserved genetic contexts of carbapenemase genesThe genetic contexts of the blaNDM genes were observed to be highly conserved. A total of two major genetic contexts were identified in 116 blaNDM-5-positive isolates, including IS3000-ΔISAba125-IS5-blaNDM-5-ble-trpF and IS3000-ISAba125-IS5-blaNDM-5-ble-trpF. The blaNDM-5 gene was predominantly carried by either IncX3 or IncHI2A plasmids (Fig. S2, Table S3). Besides, only one genetic context IS3000-ISAba125-blaNDM-1-ble-trpF-IS26 were identified in blaNDM-1-positive CREC isolates. All blaNDM-1-positive plasmids belonged to IncX3. All blaNDM-9-positive plasmids were of the IncHI2 type (4/4, 100%), and their conserved genetic context was ΔISAba125-blaNDM-9-ble-trpF. In addition, the genetic context of only identified blaNDM-4-positive isolate was IS3000-ΔISAba125-blaNDM-4-ble-trpF.
According to the core genome diversity and plasmid diversity comparison, all blaNDM-positive plasmids have a relatively conservative backbone structure. Besides, most plasmids showed no significant correlation with bacteria evolution (Fig. S3), implying conserved plasmids contributed to the spread of blaNDM in CREC isolates. However, there were also some isolates with a closer evolutionary relationship and higher homology of blaNDM-positive plasmids, indicating that clone transmission of blaNDM-positive isolates also plays a role in the spread of CREC isolates.
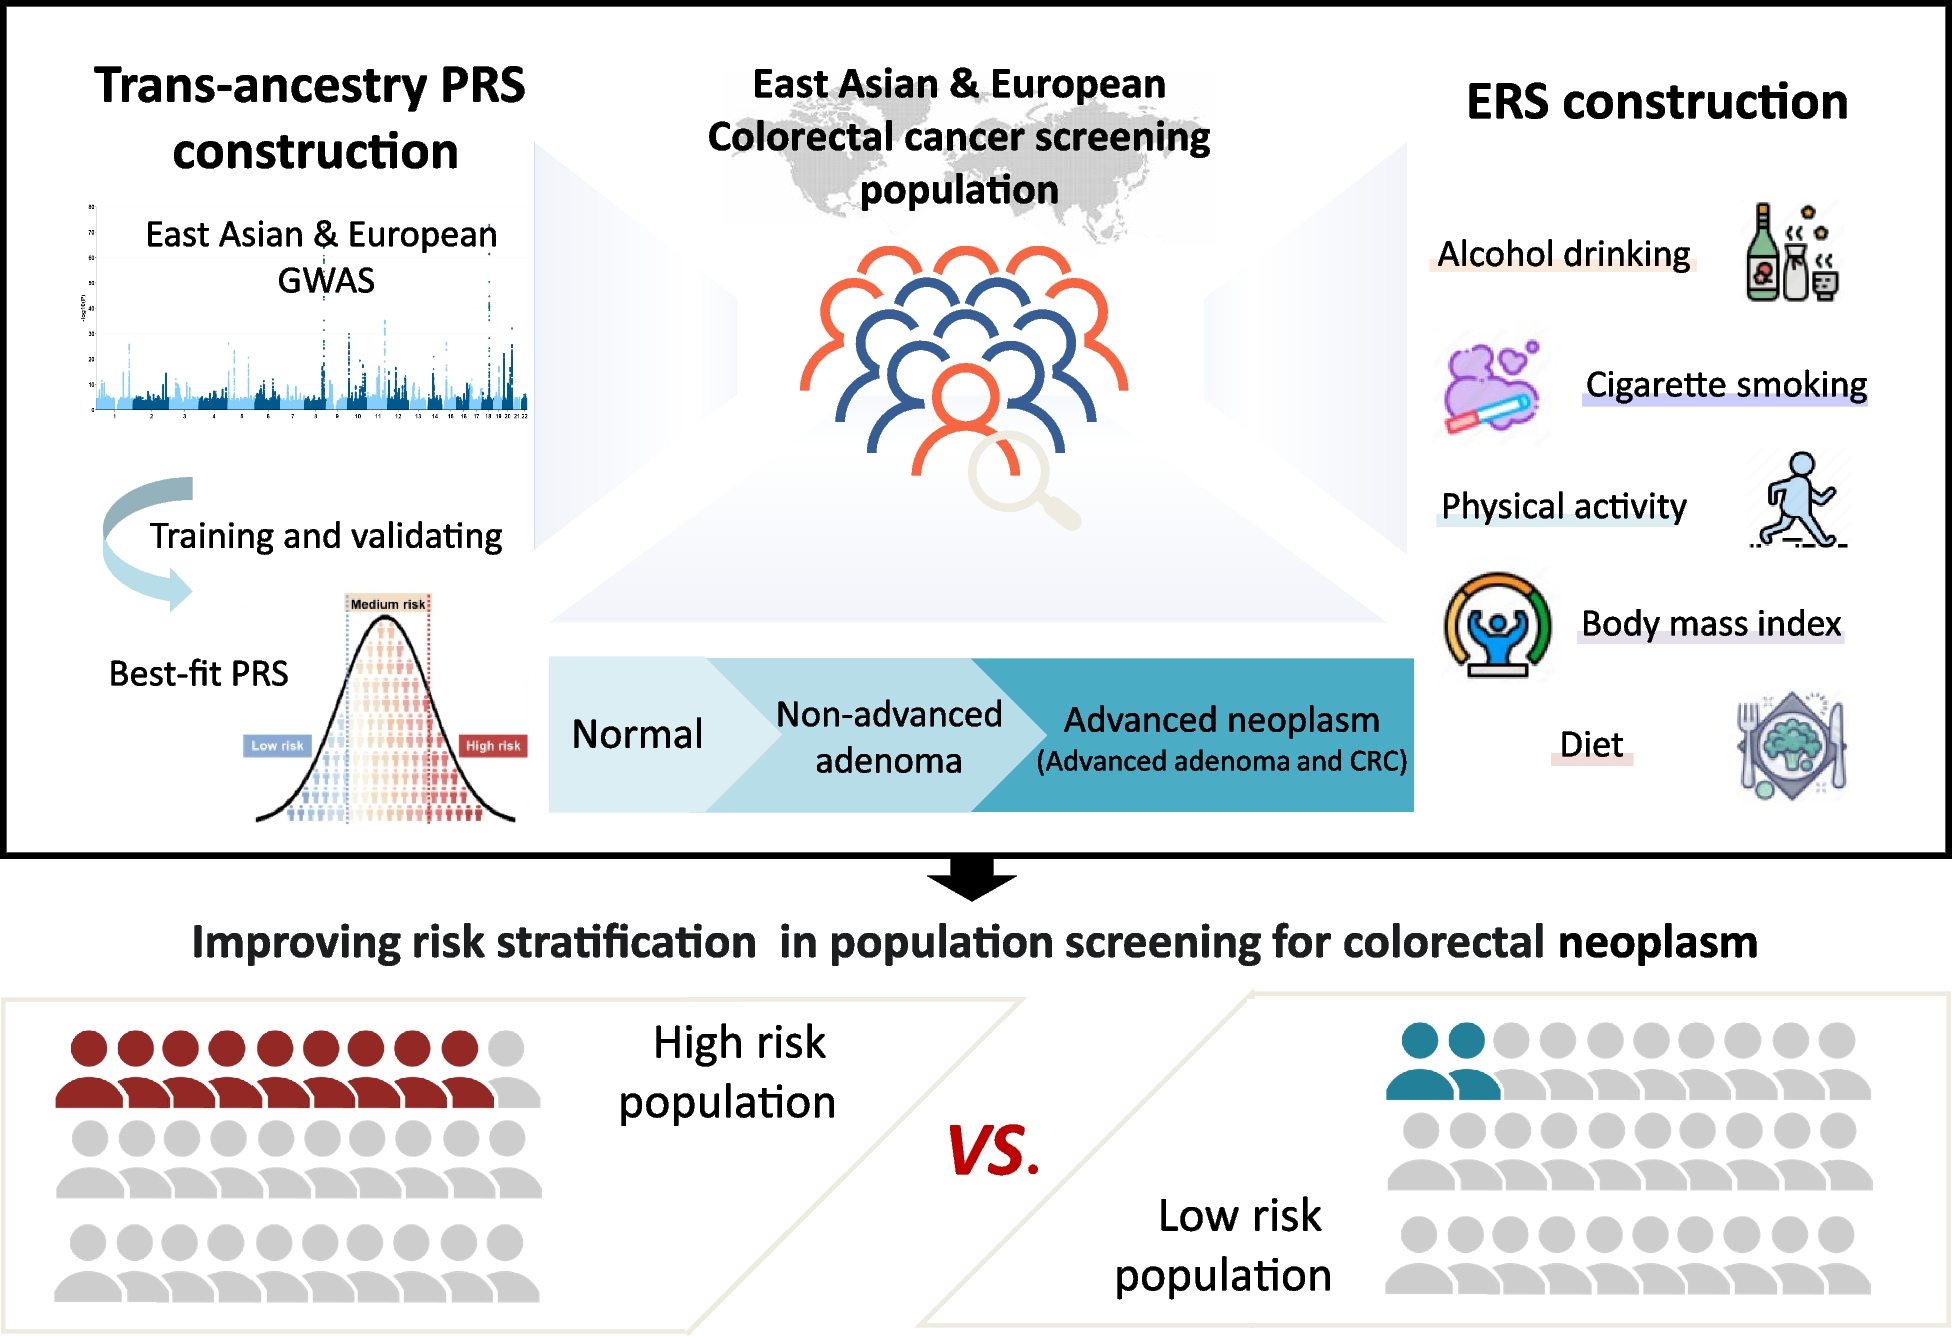
Different phylogenetic evolution of CRECs from clinical and healthy populationsIn order to further describe the genetic features of CRECs in healthy populations, 113 CREC isolates of clinical origins were downloaded from the NCBI database [6]. These 113 CREC isolates were collected in our previous study from ICU patients in 15 provinces and municipalities in China. Among the 260 CREC isolates, we detected 100 known STs, with a marked difference in ST distribution between clinical and non-clinical E. coli isolates (Fig. 4). Specifically, the CRECs isolated from healthy individuals exhibited a higher diversity of STs (n = 48) compared to clinical CRECs (n = 20). The two groups shared only 16 STs (16/100, 16%). ST131 was the most prevalent (34/113,30.09%) in clinical CRECs, while ST224 being the most common in non-clinical CRECs (10/147, 6.8%). The distribution of blaKPC-positive isolates was only observed in clinical samples, with ST131 carrying a larger number of the blaKPC genes. The isolates located in the shaded areas of Fig. 4 are those from different sources but with high genetic similarity (≤ 20 SNPs), indicating the possibility of clonal transmission between nonclinical and clinical CRECs (Table S4). The STs of these isolates were ST46 and ST410, distributed across various regions (Shanghai, Zhejiang, Inner Mongolia), forming two distinct clusters of distribution, and all of them carried carbapenemase genes.
Fig. 4
Phylogenetic tree of 260 CREC isolates from clinical and non-clinical environments. Clinical and non-clinical CRECs have different genetic backgrounds, with significant differences between their STs, ARGs, and phylogroup. The resistance genes are indicated by square, solid graphics indicate yes, hollow no. The isolates in the blue-shaded areas represent isolates from different sources but with high genetic similarity (≤ 20 SNPs)
Genomic differences in CREC isolates in clinical and non-clinical settingsCompared with 113 clinical isolates, the CREC isolates from healthy individuals carried a greater variety of insertion sequences and VFs. However, CREC from healthy individuals carries fewer types of ARGs and plasmid replicons (Fig. S4). The positive rate of the intI1 gene in clinical isolates was 74.34% (84/113), and in isolates collected from healthy individuals, it was 75.51% (111/147). Alpha diversity analysis showed that compared with the CRECs from healthy people, the CRECs from clinical sources carried more plasmid replicons and VFs (p < 0.05). However, there was no significant difference in the number of resistance genes and insertion sequences between these two sources of CRECs (p > 0.05) (Fig. S5). PCoA results showed that compared with the CRECs isolated from healthy people, the ARGs and VFs carried by different CREC isolates isolated from clinical samples varied greatly (Fig. 5).
Fig. 5
Principal component analysis for ARGs and VFs. A Principal component analysis of ARGs in CRECs from healthy people and clinical sources. B Principal component analysis of VFs in CRECs from healthy people and clinical sources
Among all 120 detected ARGs, 23 ARGs exhibited significant differences between healthy and clinical population groups (χ2 test, p < 0.05) (Table S5, Fig. S6A). Besides, significant differences were observed in the positive rates of carbapenemase genes between clinical and non-clinical isolates, with blaNDM-5 being more prevalent in non-clinical isolates (χ2 test, p < 0.01) and blaKPC-2 being more prevalent in clinical isolates (χ2 test, p < 0.01). In non-clinical CREC isolates, the enriched ARGs for aminoglycosides included aac(3)-IVa, aadA, aph(3')-Ia, aph(4)-Ia, arr-2, and dfrA17, while the positive rates of resistance genes for β-lactams and quinolones were significantly higher than those of clinical CREC isolates.
A total of 65 VFs that showed significant differences between the two groups were significantly more abundant in clinical isolates (χ2 test, p < 0.01) (Table S6, Fig. S6B). We found that the positive rates of several important virulence genes fyuA, irp2, and iucABCD in clinical isolates (57.52%, 57.22%, 53.10%) were higher than those in isolates isolated from healthy individuals (12.93%, 11.56%, 30.61%). All VFs with significantly higher prevalence are rich in clinical CREC, which indicated that these clinical CREC isolates have higher pathogenicity. Further looking up VFs against VFDB, these differentially abundant VFs were mainly associated with invasion (e.g., K1 capsule), iron uptake (e.g., ferrienterochelin receptor Fes), secretion (e.g., type II secretion system, type III secretion system), and adhesion (e.g., fimbrial protein). Those virulence factors are crucial in the pathogenic phase of clinical pathogenic CRECs.
Genome wide association analysis of CREC isolatesA total of 513 genes were found to be above the significance threshold (Bonferroni test, p < 0.01) between healthy and clinical populations. To further investigate these genes of differentially allele frequencies, including blaNDM-5 and genes related to its conserved genetic contexts, as well as blaKPC, which were previously found to be significantly different between clinical and non-clinical isolates, these genes were subjected to KEGG pathway enrichment analysis. We found that the genetic difference of clinical CRECs were mainly enriched in biosynthesis of siderophore group nonribosomal peptides pathways and metabolic pathways (p < 0.05) compared with those from non-clinical isolates (Fig. S7). On the other hand, the genetic difference of non-clinical isolates was mainly enriched in microbial metabolism pathways and quorum sensing pathways (p < 0.05) compared with those from clinical CRECs.
留言 (0)