
記住我
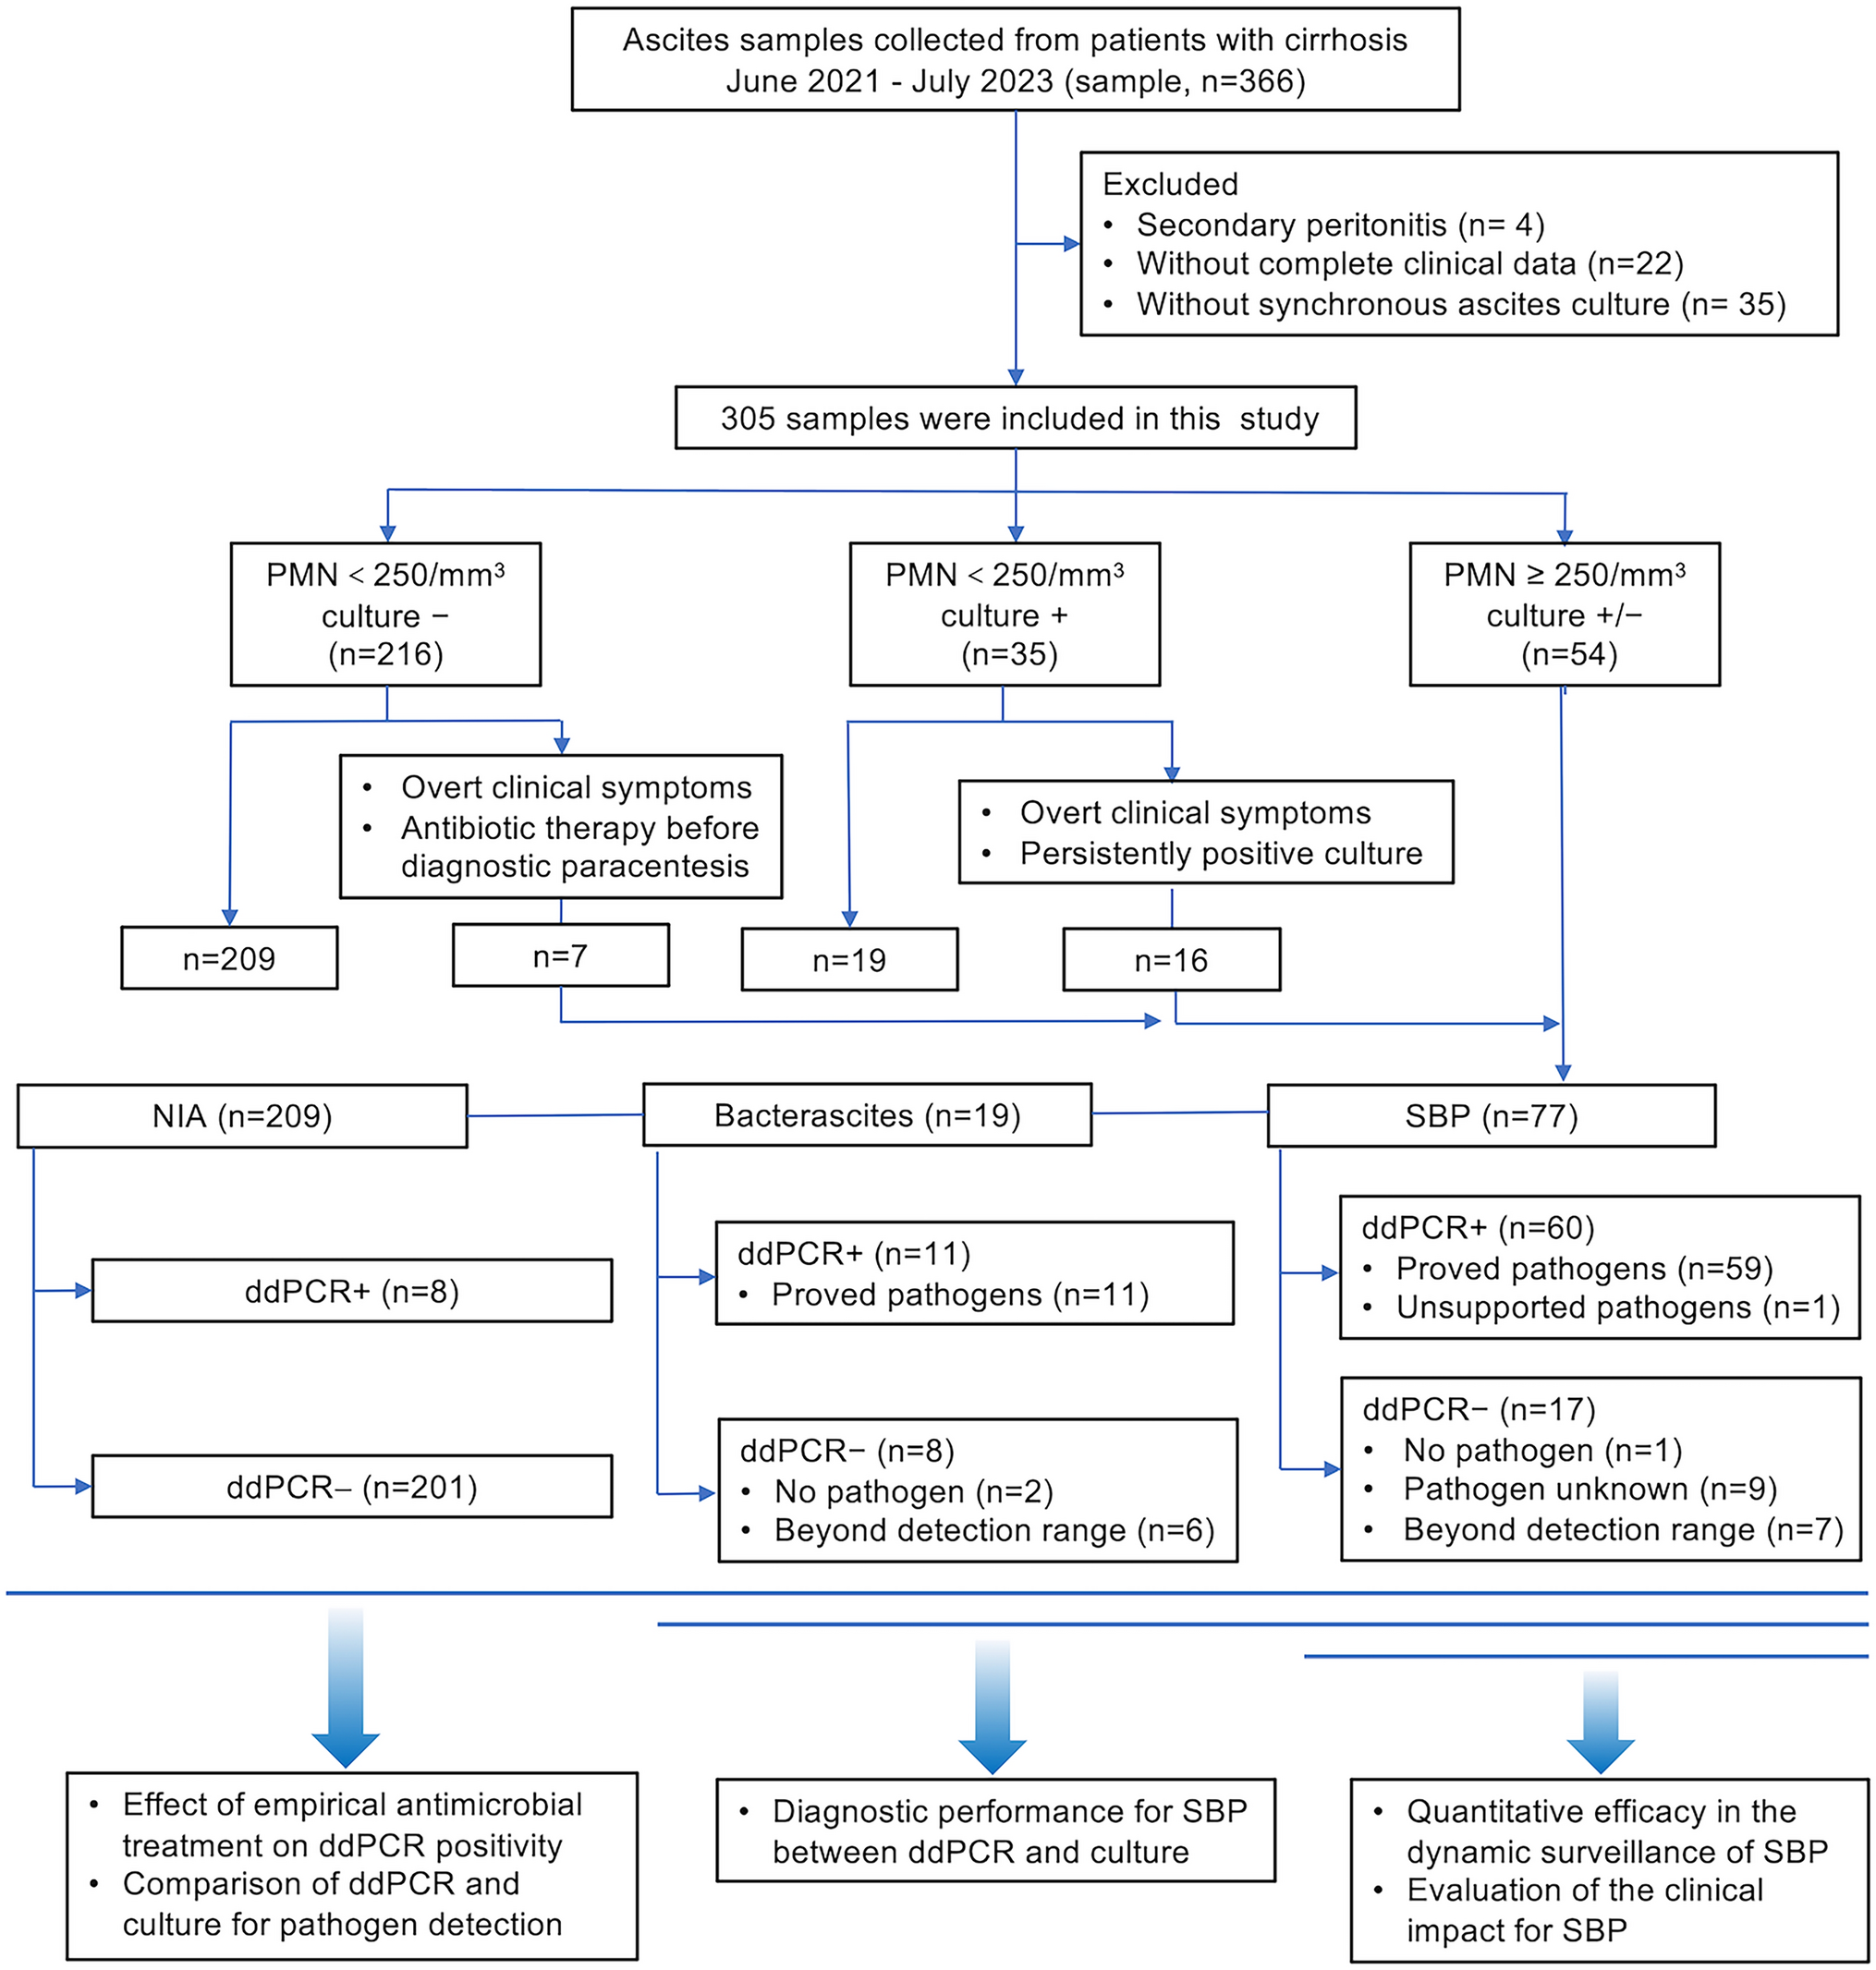
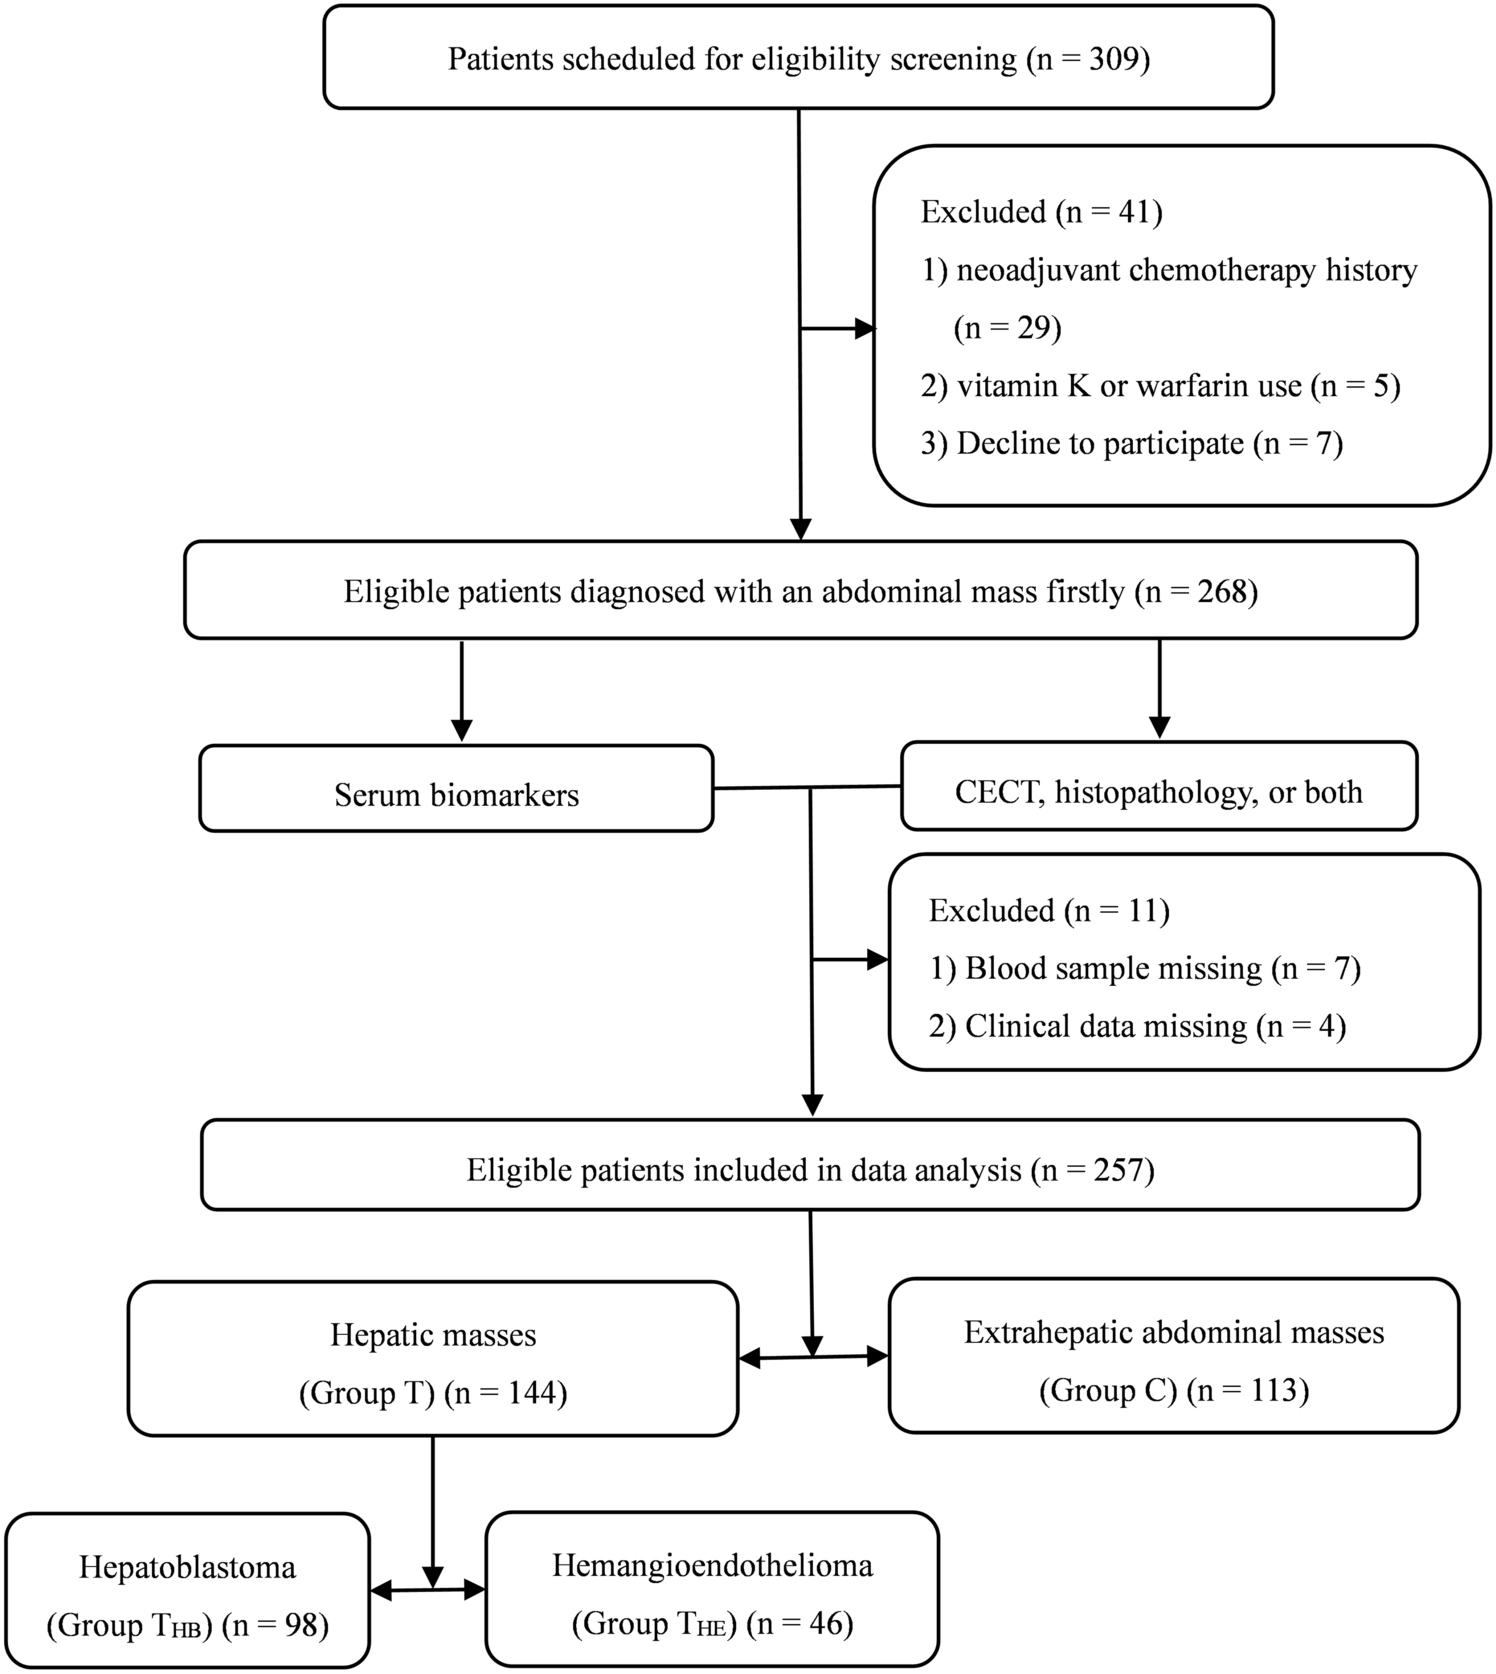
A total of 257 eligible patients with available data were enrolled in this study from October 1, 2018, to September 30, 2020 (Fig. 1). Table 1 shows the demographics of the participants. A total of 144 patients (mean age 24.4 ± 28.5 months) were confirmed to have hepatic masses (Group T), 98 patients (mean age 28.4 ± 31.6 months) were diagnosed with hepatoblastoma (Group THB), 46 patients (mean age 16.0 ± 18.2 months) were diagnosed with hemangioendothelioma (Group THE), and the other 113 patients (mean age 35.8 ± 28.9 months) were confirmed to have extrahepatic abdominal masses (Group C). Except for thrombin time (TT, p = 0.003), there were no significant differences in age (p = 0.156), sex (p = 0.159), platelet count (PLT, p = 0.466), prothrombin time (PT, p = 0.078), activated partial thromboplastin time (APTT, p = 0.065), fibrinogen (FIB, p = 0.120), aspartate amino transferase (AST, p = 0.262), alanine amino transferase (ALT, p = 0.442), gamma-glutamyl transpeptidase (GGT, p = 0.924), total protein (TP, p = 0.604), albumin (ALB, p = 0.083) or total bilirubin (TBIL, p = 0.897) between Group T and Group C. Patients in Group THE were younger than Group THB (p = 0.014), the tumor size was smaller (p < 0.001); except for AST (p = 0.035), there were no significant differences in sex (p = 0.075), PLT (p = 0.355), PT (p = 0.069), TT (p = 0.584), APTT (p = 0.340), FIB (p = 0.071), ALT (p = 0.218), GGT (p = 0.779), TP (p = 0.564), ALB (p = 0.378), or TBIL (p = 0.092) between Group THB and Group THE.
Fig. 1
Flowchart of patient enrolment. CECT contrast-enhanced computed tomography, HB hepatoblastoma, HE hemangioendothelioma
Table 1 Baseline characteristics of patientsSerum levels of PIVKA-II and AFPSerum PIVKA-II and AFP levels were compared between the patients in the hepatic mass group and the patients in the control group and between the patients in the hepatoblastoma group and the patients in the hemangioendothelioma group. The mean level of PIVKA-II in Group T was 717.687 ± 3026.936 mAU/mL, which was significantly higher than that of Group C (29.954 ± 24.924 mAU/mL, p = 0.001) (Fig. 2a). The mean level of AFP in Group T was significantly higher than that in Group C (6982.617 ± 17,833.972 ng/mL vs 226.368 ± 772.413 ng/mL, p < 0.001) (Fig. 2b).
Fig. 2
Serum levels of PIVKA-II and AFP. a, b Serum PIVKA-II and AFP levels in Group T and Group C patients; c, d Serum PIVKA-II and AFP levels in Group THB and Group THE patients; e, f Serum PIVKA-II and AFP levels in advanced HB group and non-advanced HB group patients. PIVKA-II protein induced by vitamin K absence-II, AFP alpha-fetoprotein, Group T hepatic mass group, Group C extrahepatic abdominal mass group, Group THB hepatoblastoma group, Group THE hemangioendothelioma group
A similar trend was found in serum PIVKA-II and AFP levels between Group THB and Group THE. Serum levels of PIVKA-II and AFP were both significantly higher in Group THB than Group THE (PIVKA-II: 1025.091 ± 3634.021 mAU/mL vs 62.467 ± 68.900 mAU/mL, p = 0.018; AFP: 9504.202 ± 21,023.325 ng/mL vs 1610.545 ± 3825.377 ng/mL, p = 0.013) (Fig. 2c, d).
In the HB group, Serum levels of PIVKA-II and AFP in patients with advanced HB (n = 75) were significantly higher than those in patients with non-advanced HB (n = 23), PIVKA-II: 2229.376 ± 5300.046 mAU/mL vs 172.413 ± 219.713 mAU/mL, p = 0.001; AFP: 13,082.426 ± 23,507.643 ng/mL vs 4833.033 ± 10,733.654 ng/mL, p = 0.021 (Fig. 2e, f).
Diagnostic values of PIVKA-II and AFP in childhood hepatic tumor patientsTo evaluate the diagnostic values of PIVKA-II and AFP in childhood hepatic tumor patients, ROC curves were plotted to identify the cutoff values that would best differentiate hepatic tumor patients from controls. The area under the ROC curve (AUROC) of PIVKA-II was 0.867 (95% CI 0.822–0.911, p < 0.001), and the AUROC of AFP was 0.857 (95% CI 0.808–0.906, p < 0.001). The optimal cutoff value of PIVKA-II was 32.6 mAU/mL, the sensitivity was 86.7%, and the specificity was 81.3%. The optimal cutoff value of AFP was 120 ng/mL, the sensitivity was 84.1%, and the specificity was 81.9%. Serum levels of PIVKA-II and AFP were then combined to obtain a new marker for childhood hepatic tumor diagnosis. ROC analysis showed that PIVKA-II + AFP further increased the diagnostic efficiency. The AUROC was 0.891 (95% CI 0.850–0.933, p < 0.001), higher than that of PIVKA-II (p = 0.029) or AFP (p = 0.031) alone. The combined sensitivity and specificity were 88.5% and 84.7%, respectively (Fig. 3a).
Fig. 3
Diagnostic values of PIVKA-II and AFP in childhood hepatic tumor patients. a The AUROCs of PIVKA-II, AFP and PIVKA-II + AFP for the diagnosis of hepatic tumors were 0.867, 0.857 and 0.891, respectively. b The AUROCs of PIVKA-II, AFP and PIVKA-II + AFP to differentiate hepatoblastoma from hemangioendothelioma patients were 0.876, 0.743 and 0.895, respectively. PIVKA-II protein induced by vitamin K absence-II, AFP alpha-fetoprotein
The percentages of patients above and below the cutoff values of biomarkers in Group T and Group C were shown in Fig. 4a and b. The proportion of patients with combined AFP + and/or PIVKA + in Group T were higher than that in Group C (85.42% vs 23.01%, p < 0.001).
Fig. 4
Pie charts of patients above and below the cutoff values of biomarkers. a, b The percentages of patients in Group T and Group C, PIVKA-II cutoff value = 32.6 mAU/mL, AFP cutoff value = 120 ng/mL; c–e The percentages of patients in Group THB, Group THE and Group C, PIVKA-II cutoff value = 47.1 mAU/mL, AFP cutoff value = 560 ng/mL
Differential diagnostic values of PIVKA-II and AFP in hepatoblastoma patientsTo further assess the diagnostic value of PIVKA-II and AFP levels in differentiating hepatoblastoma patients from hemangioendothelioma patients, another ROC curve was constructed. The AUROC of PIVKA-II was 0.876 (95% CI 0.818–0.934, p < 0.001), and the AUROC of AFP was 0.743 (95% CI 0.651–0.835, p < 0.001). The optimal cutoff value of PIVKA-II was 47.1 mAU/mL, sensitivity was 71.7% and specificity was 88.7%. The optimal cutoff value of AFP was 560 ng/mL, sensitivity was 63.0% and specificity was 78.6%. ROC analysis showed that PIVKA-II + AFP further increased the differential diagnostic efficiency. The AUROC was 0.895 (95% CI 0.841–0.948, p < 0.001), which was higher than that of PIVKA-II (p = 0.657) or AFP (p < 0.001) alone. The combined sensitivity and specificity were 72.7% and 91.8% (Fig. 3b).
The percentages of patients above and below the cutoff values of biomarkers in Group THB and Group THE were shown in Fig. 4c, d and e. The proportion of patients with combined AFP + and/or PIVKA + in Group THB were higher than that in Group THE (93.88% vs 43.48%, p < 0.001) and Group C (93.88% vs 12.39%, p < 0.001).
留言 (0)