
記住我


HE staining showed that with the progress of liver fibrosis, the arrangement of hepatocyte cords became more and more disordered, and the typical hepatic pseudolobule could be observed in stage F4 fibrosis (Fig. 1). In addition, collagen fibers were generated with the formation of liver fibrosis. Sirius red, as a kind of acid dye, can react with collagen fibers to make them red. This phenomenon was further demonstrated by the αSMA immunohistochemical staining. As presented in Table 2, the percentages of positive area for Sirius red and αSMA immunohistochemical staining both increased with the severity of liver fibrosis (P < 0.001 for both). According to the histopathological results, there were 6, 6, 5, 7, 6 rats designated into stage F0, F1, F2, F3 and F4, respectively.
Fig. 1
Representative histopathological examples of different liver fibrosis stages. A, hematoxylin–eosin (HE) staining; B, Sirius red staining; C, αSMA staining
Table 2 Characteristics of different liver fibrosis stagesInterobserver reproducibility of imaging parametersT1ρ, MK, MD, f, D and D* exhibited excellent interobserver reproducibility, with ICC values > 0.75 (P < 0.001 for all) (Table 3). Notably, T1ρ showed the largest ICC value of 0.951 (95% CI 0.900, 0.976; P < 0.001).
Table 3 Interobserver reproducibility of imaging parametersChanges in imaging parametersAll imaging parameters were in accordance with normal distribution. According to the ANOVA test, there was no statistical difference of D* among all liver fibrosis stages (P = 0.586). Thus, D* was excluded from subsequent analysis. Typical maps of other imaging parameters derived from T1ρ, DKI and IVIM with different fibrosis stages were shown in Fig. 2.
Fig. 2
Typical maps of imaging parameters derived from T1ρ, DKI, and IVIM with different fibrosis stages
As presented in Table 2, T1ρ and MK values increased with the progression of liver fibrosis (P < 0.05 for both). Mean T1ρ values for stage F0-F4 were 31.47 ± 1.23 ms, 34.31 ± 1.31 ms, 34.48 ± 0.85 ms, 36.99 ± 2.01 ms, and 38.59 ± 1.20 ms, respectively. For different fibrosis stages of T1ρ values, the ANOVA with LSD post-hoc test showed that F0 versus F1-4, F1 versus F3-4, and F2 versus F3-4 differed significantly from one another (P < 0.05). Mean MK values for stage F0-4 were 0.91 ± 0.03, 0.94 ± 0.04, 0.95 ± 0.11, 0.98 ± 0.07, 1.05 ± 0.08, respectively. Among all stage comparison pairs analyzed by ANOVA with the LSD post-hoc test, F0 versus F4, F1 versus F4, and F2 versus F4 differed significantly from one another.
Conversely, MD, f and D values generally decreased with the progression of liver fibrosis, especially for MD (P < 0.001 for all) (Table 2). And the mean MD values for F0-4 were (1.67 ± 0.14) × 10–3 mm2/s, (1.43 ± 0.10) × 10–3 mm2/s, (1.39 ± 0.13) × 10–3 mm2/s, (1.26 ± 0.11) × 10–3 mm2/s, and (1.17 ± 0.05) × 10–3 mm2/s. According to the ANOVA with LSD post-hoc test, F0 versus F1-4, F1 versus F3-4, and F2 versus F4 all had significant difference for MD (P < 0.05).
Correlations between imaging parameters and histopathological scoresAs presented in Table 4, there were strong correlations between T1ρ, MD, and D and the histopathological scores (Sirius red and αSMA-positive ratios). Spearman correlation coefficients of T1ρ, MD, and D versus Sirius red-positive ratios were 0.899, − 0.858, and − 0.787, respectively (P < 0.001 for all). Correlation coefficients of T1ρ, MD, and D versus αSMA-positive ratios were 0.869, − 0.828, and − 0.758, respectively (P < 0.001 for all). MK and f showed moderate correlations with histopathogical scores. Spearman correlation coefficients of MK and f versus Sirius red-positive ratios were 0.643 and − 0.675, respectively (P < 0.001 for both) and versus αSMA-positive ratios were 0.604 and − 0.689, respectively (P < 0.001 for both). The results suggested that the correlation coefficients of T1ρ and MD versus histopathological scores were higher and comparable.
Table 4 Correlations between imaging parameters and histopathological scoresROC curve analysisFigure 3 and Table 5 depicted the diagnostic efficiency of T1ρ, MK, MD, f, and D in differentiating fibrosis stages. The mean AUC values, sensitivity and specificity for various liver fibrosis stages (F0 vs. F1-4, F0-1 vs. F2-4, F0-2 vs. F3-4, F0-3 vs. F4) were summarized in Table 6. According to the ROC curve analysis, T1ρ and MD had relatively better diagnostic efficiency across all fibrosis stages than MK, f, and D. The mean AUC values for T1ρ and MD were 0.954 and 0.949, while the mean AUC values for MK, f, and D were 0.806, 0.861, and 0.894, respectively. In addition, the average sensitivity and specificity across all fibrosis stages of T1ρ and MD were also higher than those of MK, f, and D, which were 92.46 and 91.85 for T1ρ, 92.52 and 91.24 for MD, respectively. However, when comparing AUC values of these imaging parameters across all fibrosis stages, the Delong test suggested that only T1ρ versus MK in differentiating F0 vs. F1-4 and D versus MK in differentiating F0-1 vs. F2-4 had statistical significance (Z = 2.316, P = 0.021; Z = 2.425, P = 0.015; respectively).
Fig. 3
ROC curves for differentiation of liver fibrosis stages with T1ρ, MK, MD, f, and D. a F0 vs. F1-4; b F0-1 vs. F2-4; c F0-2 vs. F3-4; d F0-3 vs. F4
Table 5 Diagnostic efficiency of imaging parameters in differentiating liver fibrosis stagesTable 6 The mean diagnostic values of imaging parameters across all fibrosis stages (F0 vs. F1-4; F0-1 vs. F2-4; F0-2 vs. F3-4; F0-3 vs. F4)Further, we established a logistic regression model combining T1ρ and MD and investigated its diagnostic efficiency in discriminating liver fibrosis stages (Fig. 4). We found that the combination model exhibited better diagnostic performance with larger AUC values than any individual method (F0 vs. F1-4: 1.000 (0.884–1.000); F0-1 vs. F2-4: 0.935 (0.782–0.992); F0-2 vs. F3-4: 0.982 (0.852–1.000); F0-3 vs. F4: 0.986 (0.859–1.000)).
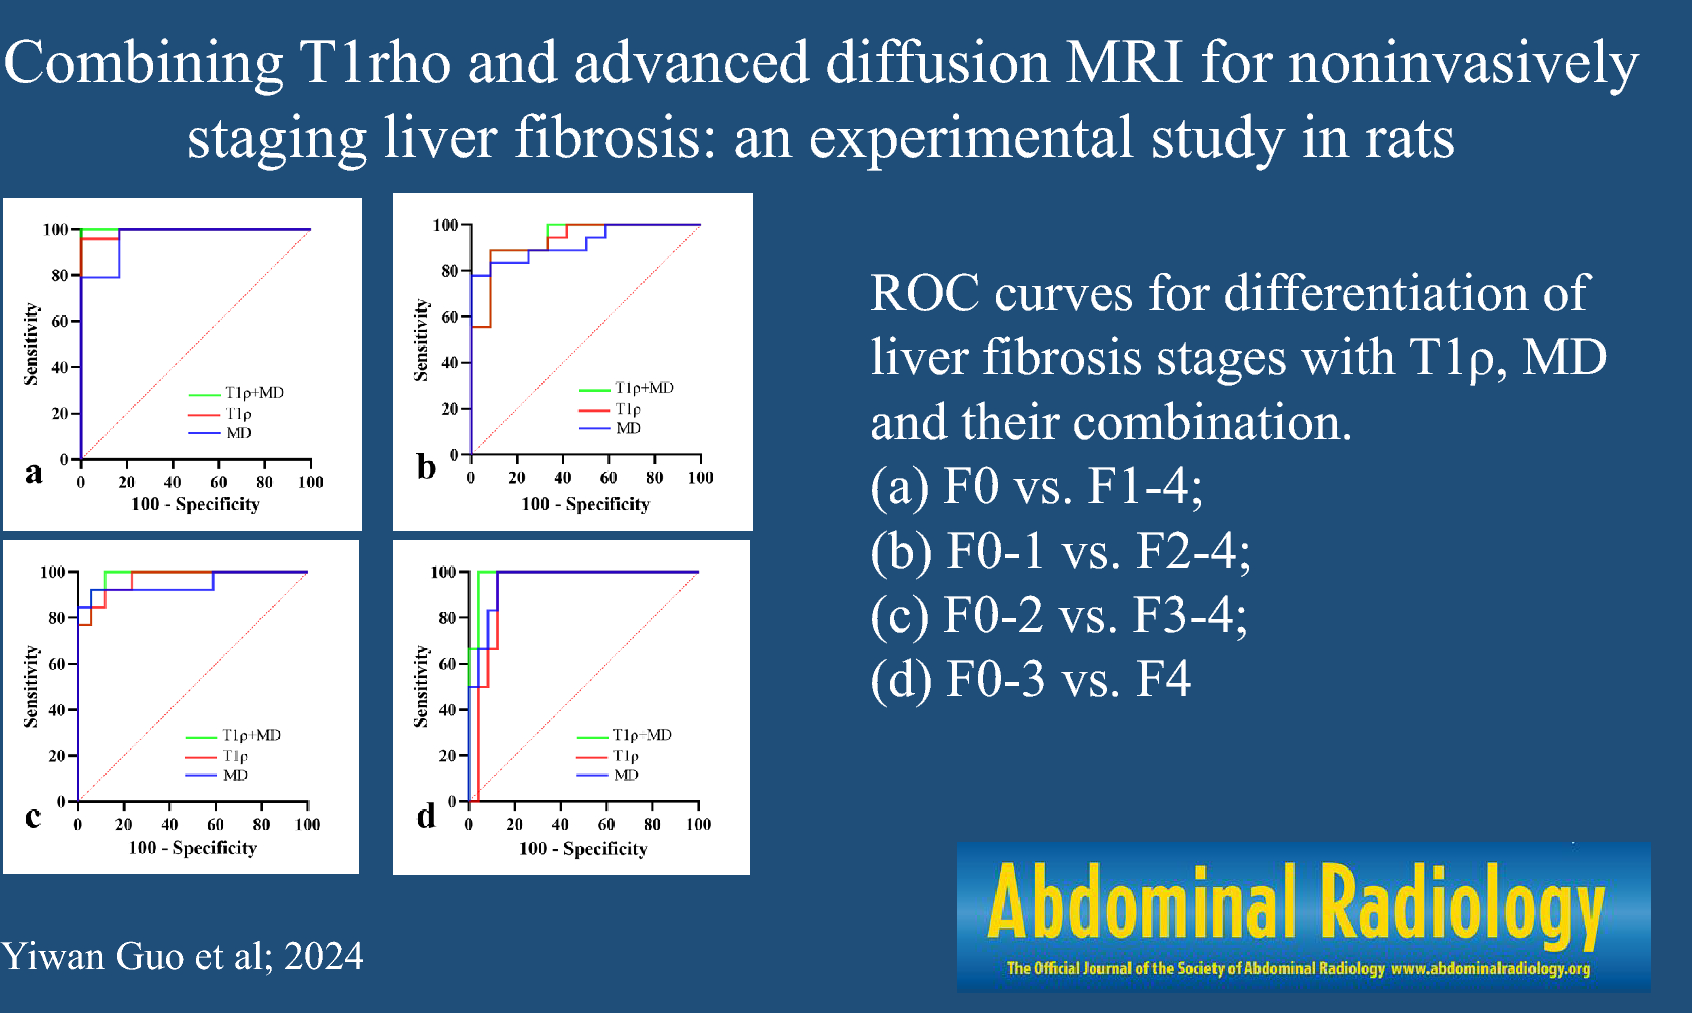
Fig. 4
ROC curves for differentiation of liver fibrosis stages with T1ρ, MD and their combination. a F0 vs. F1-4; b F0-1 vs. F2-4; c F0-2 vs. F3-4; d F0-3 vs. F4
留言 (0)