
記住我


This retrospective study was approved by the ethics committee of our institution (no. ky-2023-109) without the requirement of written informed consent.
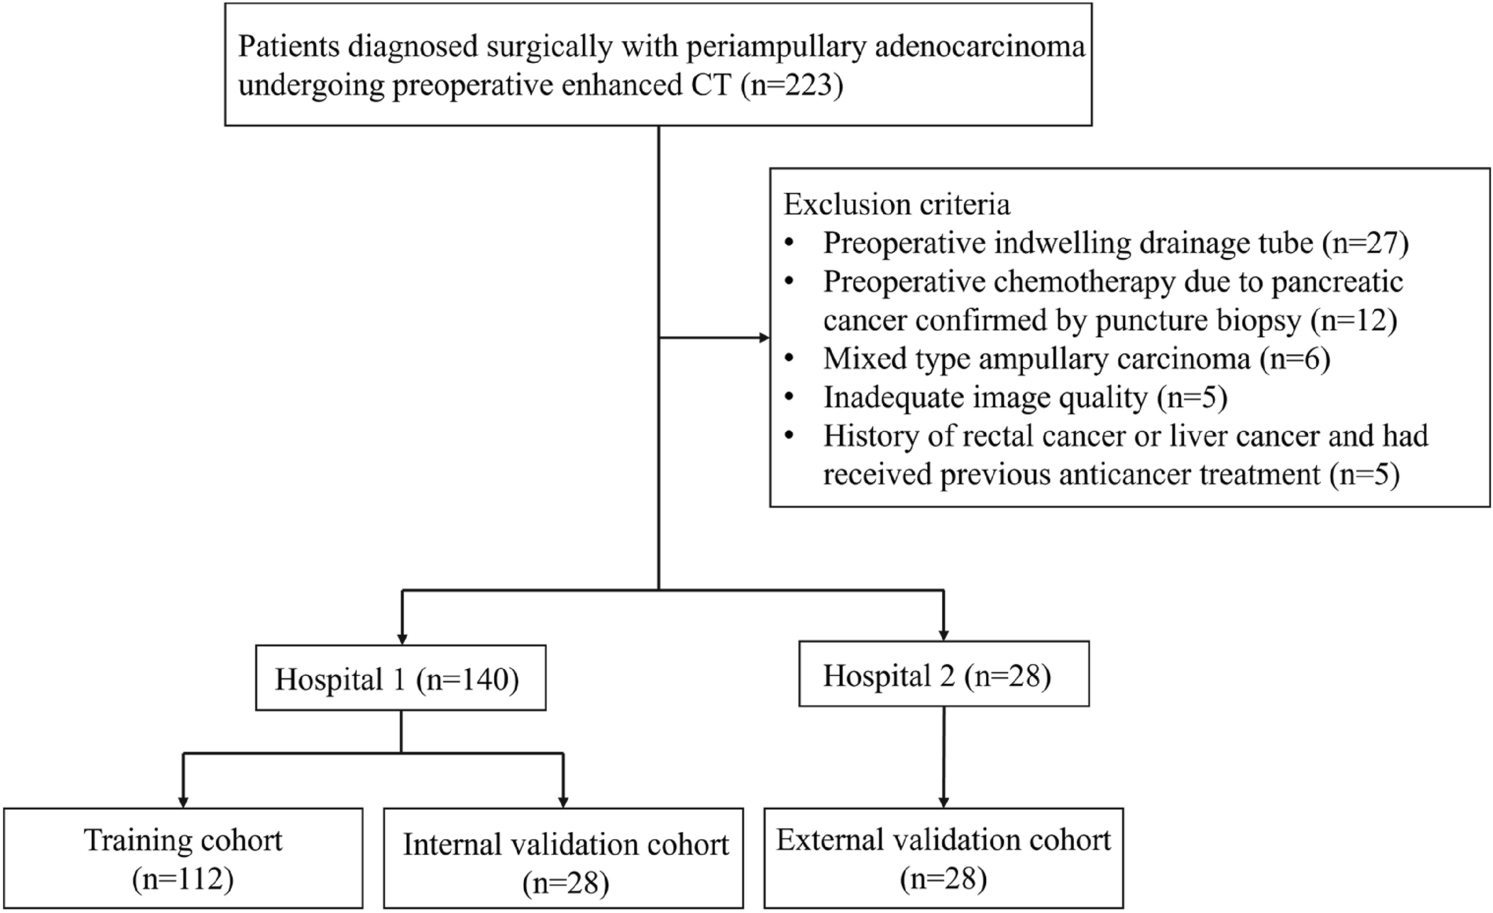
PatientsEsophageal cancer patients who underwent radical esophagostomy and regional lymphadenectomy (i.e., pathological T1-4aN1-2M0) in our institution from January 2012 to September 2016 were retrospectively recruited. Inclusion criteria were as follows: (1) ESCC confirmed histologically and (2) standard contrast-enhanced computed tomography (CT) performed within 2 weeks before surgery. Exclusion criteria included (1) preoperative anticancer therapy; (2) concurrence other malignant tumors; (3) missing clinicopathological data (preoperative blood-routine characteristics, pathological data for definite TNM stage, etc.); (4) uninterpretable enhanced CT images; and (5) Postoperative following up time < 1 year. One hundred twenty-two patients who met the criteria were allocated randomly to the training cohort (n = 93) and internal validation cohort (n = 29) in a 3:1 ratio. Patient enrollment pathway is shown in Fig. 1. These patients were previously reported as part of a radiomics study [13]. Yet, the current study exploits a different study purpose, methodology, and results as compared with the prior publication. Whereas previous study dealt with intratumoral radiomics and focused on prediction of lymph node (LN) metastasis, the present study evaluates the diagnostic performance of intratumoral and peritumoral radiomics in predicting local-regional staging and prognostic value of radiomics-predicted Tumor-Node-Metastasis (TNM) stage.
Fig. 1
Flow diagram of patient enrollment, eligibility, and exclusion criteria. ESCC esophageal squamous cell carcinoma, CT computed tomography
Clinicopathological characteristicsClinical information, including demographic data (age, sex), laboratory test (serum albumin, fibrinogen, blood-routine characteristics), and histopathological reports (tumor site, grade, Tumor stage, Node stage) were collected from electronic medical record databases. Neutrophil-to-lymphocyte ratio (NLR) and platelet-to-lymphocyte ratio (PLR) were calculated based on neutrophil, lymphocyte, and platelet count within 2 weeks before surgery. The threshold values for serum albumin and fibrinogen used here were 35 g/L and 4 g/dL, respectively. The pathologic stage was defined according to the Union for International Cancer Control TNM staging system (8th edition) [8, 14]. Stage I and II were classified as the early-stage, and stage III and IV the late-stage.
Follow‑up strategyPatients were followed up every 3 months for the 1st year after surgery, every 6 months for thereafter. At each outpatient visit, thoraco-abdominal CT scans, brain magnetic resonance images or brain CT scans and bone scans were routinely performed to detect any evidence of recurrence. The recurrence date was recorded as the date when the aforementioned scans first showed signs of recurrence. Recurrence-free survival (RFS) was defined as the duration from the date of surgery to the first radiographic detection of recurrence, death, or the last follow-up was set as the end point.
CT acquisitionAll patients underwent contrast-enhanced chest CT using a 64-slice LightSpeed VCT (GE Healthcare), which was performed in the axial plane with 5-mm-thick sections.
Details on the imaging protocols are shown in Supplementary S1 (online). Arterial-phase CT images, as the optimal one for visualization of esophageal cancer, were retrieved from picture archiving and communication system (Carestream, Canada) for tumor annotation [15]. CT-reported lymph node (LN) status was assessed in consensus on the pretreatment CT by two radiologists (Z.T. and R.M., with 12 and 6 years of clinical experience in esophageal imaging, respectively). LN short-axis diameter greater than 10 mm was defined as a radiological positive nodal status [16].
Tumor segmentation and feature extractionTumor segmentation and radiomic features extraction were performed by using the open software 3D Slicer (version 4.10.2, http://www.slicer.org). The intratumoral three-dimensional regions of interests (ROIs) covering the whole tumor in all patients were manually delineated slice by slice on the CT images by the one investigator (R.M), who was blinded to pathological TNM stage. After intratumoral segmentation, peritumoral masks with a radial distance of 3 mm were automatically created using morphologic outward dilation by 2 mm and inside erosion by 1 mm of the tumor boundaries. Airway, lung, left atrium, aorta, vertebrae, and azygos were manually excluded (Fig. 2). To evaluate the interreader agreement, an independent investigator (X.T) also placed three-dimensional ROIs of the intratumoral and peritumoral areas in a randomly selected subset of 30 patients.
Fig. 2
Lesion segmentation for radiomics analysis. First, A Region of interest was manually segmented in axial view to obtain intratumoral mask, B then the peritumoral masks with a radial distance of 3 mm were semiautomatically generated using morphologic outward dilation by 2 mm and inside erosion by 1 mm of the tumor boundaries, with airway, lung, left atrium, aorta, vertebrae, and azygos excluded manually. C, D Three-dimensional view of the intratumoral and peritumoral volumes of interest
Before features extraction, image normalization was performed by remapping the histogram to fit within μ ± 3σ (μ: mean gray level within the VOI; σ: gray level standard deviation). For each ROI, 1223 quantitative features were extracted, including 14 shape features, 234 first-order features, and 975 second-order texture features derived from gray level dependence matrix (GLDM), gray level co-occurrence matrix (GLCM), gray level run length matrix (GLRLM), gray level size zone matrix (GLSZM), and neighboring gray tone difference matrix (NGTDM).
Construction of a TNM-related radiomic signatureThe reproducibility of features was calculated by using intra-class correlation coefficients (ICC). After being normalized using the z score standardization method, all radiomics features were filtered using the criteria of ICC ≥ 0.80 and correlation coefficient ≥ 0.90. The remaining features were then input into the least absolute shrinkage and selection operator (LASSO) logistic regression model to avoid overfitting and construct radiomic signature. The output of LASSO model was converted into a probability score, namely the radiomic score, indicating the individual relative risk for high pathologic tumor stage.
Statistical analysisAll statistical analyses were performed using R version 4.2.1 (The R Foundation). A two-tailed P value less than 0.05 was considered as statistical significance. The clinicopathological characteristics between two datasets were compared with Chi-Square, t test or Mann–Whitney U test, where appropriate. The discrimination performance of the radiomic signature was quantified by the area under curve (AUC) value in the primary training set and internally validated in the independent test set. To explore the prognostic value of radiomics-predicted TNM stage, the optimum threshold of the radiomic score was determined using the surv_cutpoint function of survival R package. Accordingly, the patients were divided into low- and high-risk groups in the entire cohort, for which the survival outcomes were compared with Kaplan–Meier analysis and the 2-sided log-rank tests. Univariable and multivariable Cox regression analyses were conducted to analyze the relationship between radiomics-predicted TNM stage and RFS.
留言 (0)