This study was approved by our institutional animal care and use committee and was performed in accordance with the NIH guidelines.
Animal model and experimental design
Forty-two healthy male New Zealand White Rabbits (6–8 months age, bodyweight 2.2–2.5 kg) were from the experimental animal center of experimental animal center of Air Force Medical University. After entering the laboratory, the animals were raised for a week to adapt to the environment, with single cage feeding, free diet and water intake. The conditions in the laboratory were set as follows: temperature of 16–26 ℃, relative humidity of 40%–70%, ventilation rate of 8–10 times/hour, and day/night alternation of 12/12.
Rabbits were randomly divided into control group (n = 10) and high-fat diet group (n = 32). MR imaging was performed 3 weeks after the control group was fed with a standard diet. High-fat diet group was fed with high-fat diet (88% standard diet + 10% lard + 2% cholesterol) [19]. After such diet, MR imaging was performed at 4 weeks, 8 weeks, 12 weeks, and 16 weeks (n = 8, each) respectively.
Imaging protocols
All examinations were performed on 3.0T MR with a 15-channel knee coil. The animals were fixed on rabbit holder in a supine position for scanning after being anesthetized by intramuscular injection of 2% xylazine hydrochloride (0.3 ml/kg) and ketamine hydrochloride (30 mg/kg).
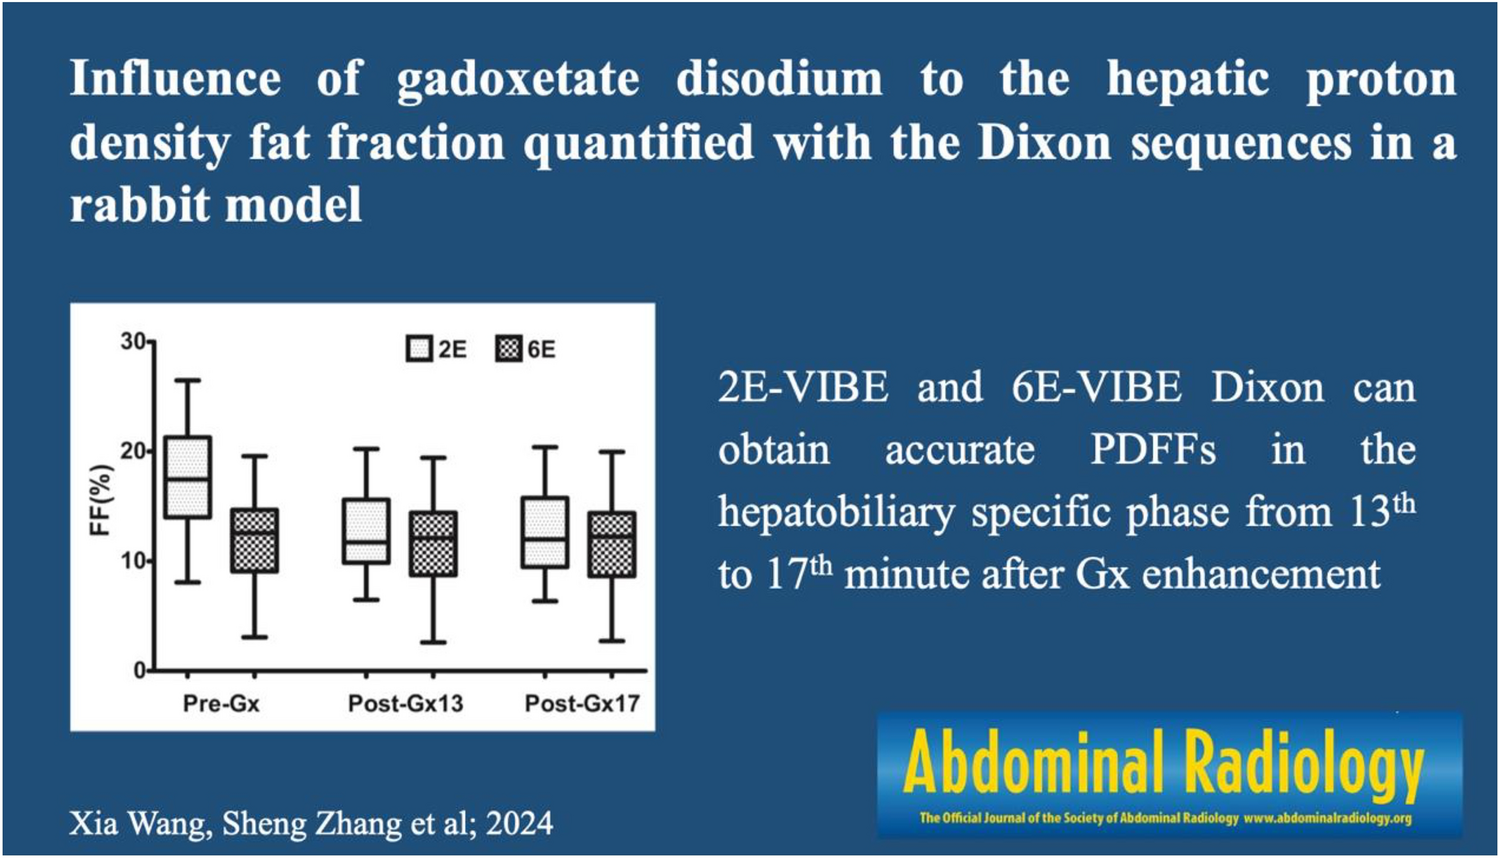
Taking axial T1-VIBE as the image, imaging was performed before Gx (Gd-EOB- DTPA, Primovist®, Bayer Healthcare, Berlin, Germany) enhancement (Pre-Gx), at the 13th (Post-Gx13) and 17th (Post-Gx17) min after enhancement with 2E-VIBE Dixon and 6E-VIBE Dixon (2E/6E-VIBE Dixon) to determine the hepatic PDFFs. In a bolus injection for the enhanced scan, the Gx (0.025 mmol/kg) contrast medium was administered to rabbits in the ear vein, followed by an injection of 6ml saline (1.5 ml/s) through a high-pressure syringe, after which the scan started. The MRI parameters are shown in Table 1.
Table 1 MRI pulse sequences and parametersImage analysis
Two radiologists performed image analysis (X.W and YD.H) blinded to the histopathologic results in consensus with more than 5 years of experience in abdominal MR imaging on postprocessing workstation (Syngo.via, Siemens Medical Solutions). The images of Pre-Gx and Post-Gx, both from the 2E- and 6E-VIBE Dixon sequences, were processed using the software provided by the manufacturer to create different maps automatically. For 2E-VIBE Dixon scanning, four maps were generated, including water, fat, in-phase, and out-of-phase maps. For 6E-VIBE Dixon scanning, six maps were generated, including water, fat, water fraction, fat fraction, r2*, and Goodness of Fit maps. Three circular regions of interest (ROI) were selected in the left lateral, medium, and right lateral liver lobes on the images above. ROIs were initially placed on the Pre-Gx maps, and then copied to the corresponding locations on the Post-Gx maps. PDFFs, R2* (1/T2*), signal intensities of water and fat, were measured to achieve their mean values for subsequent analysis. The main blood vessels and obvious artifacts were avoided for each ROI.
Histopathological examination
The animals were euthanized by intravenous injection of sodium pentobarbital within 3 h after MR examination. Three liver tissue samples were excised from the left lateral, medium, and right lateral liver lobes of each rabbit. These samples were made into paraffin sections according to the routine procedure of pathological examination. The liver tissue was evaluated by pathologists (NN.L and XM.L) blinded to the diet and the imaging result of each rabbit in consensus with more than 5 years of liver disease research. The liver steatosis degree was observed by HE (Hematoxylin–eosin) staining: Grade 0 (normal): less than 5% of hepatocytes developed steatosis; grade 1 (mild hepatic adipose infiltration): 5%–33% of hepatocytes developed steatosis; grade 2 (moderate hepatic adipose infiltration): 34%–66% of hepatocytes developed steatosis; grade 3 (severe hepatic adipose infiltration): more than 66% of hepatocytes developed steatosis [20]. Using Image Pro-Plus Software 6.0 (Media Cybernetics, CA, United States), 5 representative microscopic fields were selected to calculate the vacuole percentage (VP) of fat vacuole area to total area in the field, average value was taken to evaluate the fat infiltration. Considering that 34.5% of patients with NAFLD were complicated with liver iron deposition [21], from which T2* value and afterwards PDFF being affected, our pathologists also observed whether iron particles existed in the liver and its degree thereof under Prussian blue staining according to Deugnier’s and Turlin’s histological scoring system [22].
Statistical analysis
Mean ± SD was used for all continuous data. Box plots were created to compare Pre-/Post-Gx PDFFs acquired by 2E-/6E-VIBE Dixon. The distributions of PDFFs acquired by 2E-/6E-VIBE Dixon and VPs were tested using the Kolmogorov–Smirnov test in order to select the proper method of correlation analysis. Correlation coefficient was used to compare the relationships between Pre-/Post-Gx PDFFs measured by 2E-/6E-VIBE Dixon and VPs in histopathology. Repetitive measure analysis of variance was used to evaluate the differences of PDFFs on Pre-Gx and Post-Gx 2E-/6E-VIBE Dixon, and signal intensities of the hepatic water and fat on Pre-Gx and Post-Gx 2E-VIBE Dxion. Bland–Altman analysis was used to evaluate the consistency of PDFFs obtained by 2E-/6E-VIBE Dixon. Limits of agreement (95%) were defined as the mean difference ± 1.96 × the standard deviation. Statistical results were significant at P < 0.05. All statistical analyses were performed by using SPSS 23.0 software (SPSS, Chicago, Ill).


留言 (0)