
記住我


Surgical pathology records were searched in pathology database using the terms "periampullary adenocarcinoma," "lower part of common bile duct," "duodenal papilla," or "Vater" in combination with "pancreaticobiliary" or "intestinal." The inclusion criteria were as follows: (1) patients diagnosed surgically with periampullary adenocarcinoma and histologically confirmed pancreatobiliary- or intestinal-type periampullary adenocarcinoma; (2) standard unenhanced and contrast-enhanced abdominal CT imaging performed < 30 days before surgical resection; and (3) no preoperative invasive therapy. We excluded patients using the following criteria: (1) histologically confirmed mixed pancreatobiliary and intestinal types; (2) patients with other synchronous malignant neoplasms or received previous anticancer treatment; and (3) tumor lesions could not be identified on CT.
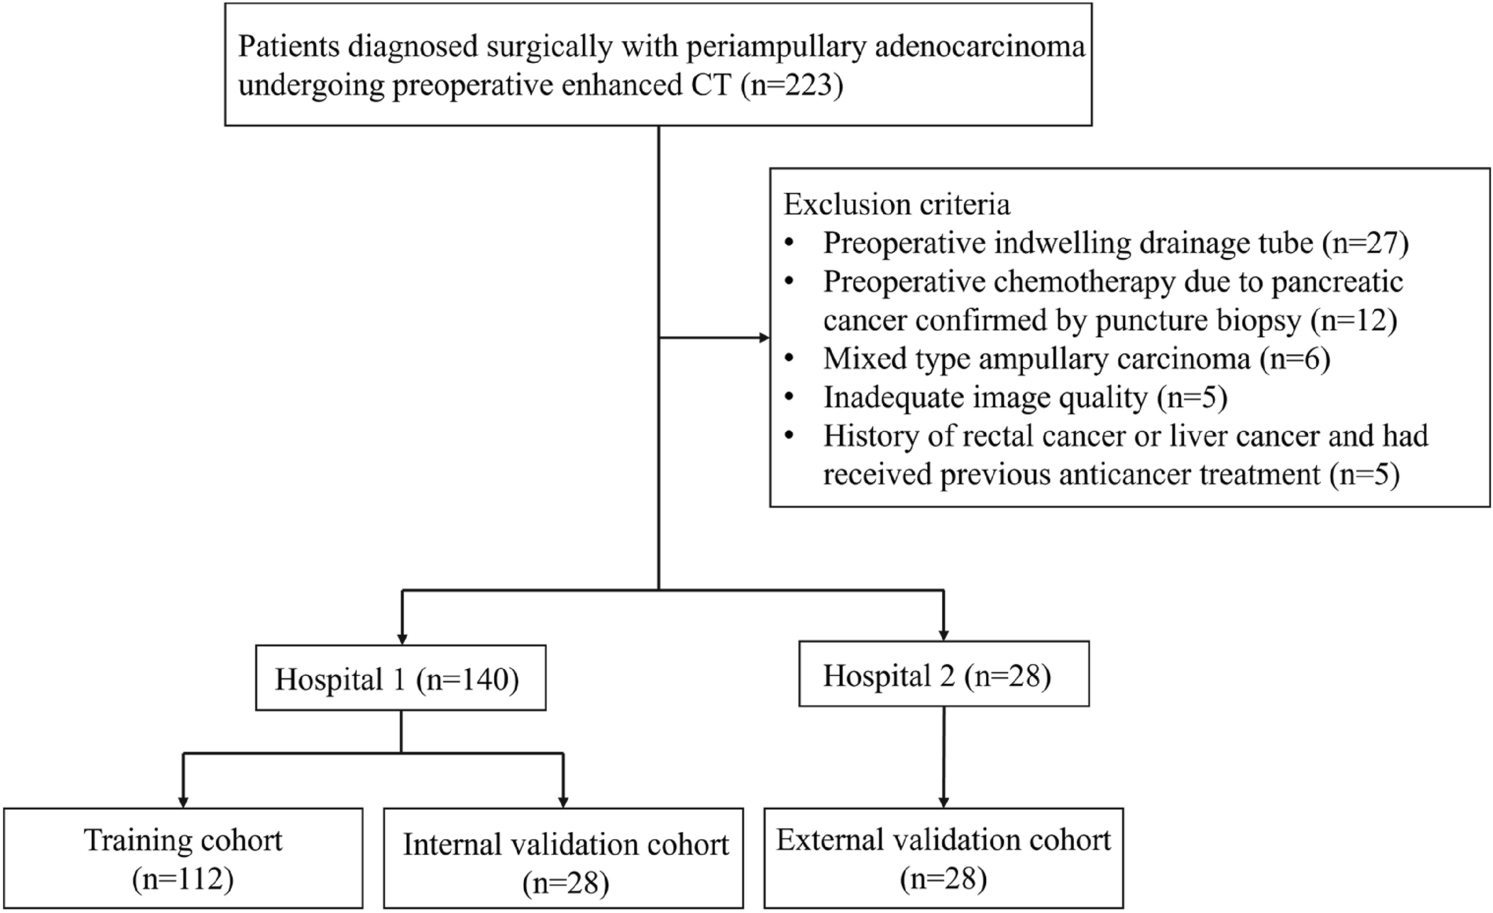
This was a multicenter retrospective study that included two hospitals and was approved by the institutional review board of the two hospitals and patient informed consent was waived. The data from Hospital one would be randomly assigned to the training cohort and the internal validation set in a ratio of 8:2, and the data from Hospital two would be the external validation set (Fig. 1). A total of 187 patients from January 2019 to December 2022 were enrolled from Hospital one. Among them, 23 patients underwent preoperative indwelling drainage tube, 10 patients received preoperative chemotherapy due to pancreatic cancer confirmed by puncture biopsy, 4 patients had mixed-type ampullary adenocarcinoma, 5 patients had unsatisfactory image quality assessment due to motion artifacts, and 5 patients who had history of rectal cancer or liver cancer and received previous anticancer treatment were excluded from the study. Consequently, 140 patients were enrolled in the study (Fig. 1).
Fig. 1
Flowchart of the study cohort
We recruited patients between November 2013 and December 2022 from Hospital two to form an external validation dataset. This dataset yielded 36 patients. Among them, 4 patients underwent preoperative indwelling drainage tube, 2 patients received preoperative chemotherapy due to pancreatic cancer confirmed by puncture biopsy, and 2 patients who had mixed-type ampullary adenocarcinoma were excluded from the study. Consequently, 28 patients were included in the study (Fig. 1).
Clinical data collectionThe patient clinical information, including age, sex, history of cholecystectomy, serum total bilirubin, and CA19-9 levels were retrieved from medical records. The recorded laboratory data must be measured within 2 weeks before CT examination. Elevated serum total bilirubin and CA19-9 were defined as total bilirubin ≥ 21 μmol/L and CA19-9 ≥ 37 U/mL.
CT image acquisitionPatients were required to fast for at least 4 h and drink at least 500 ml of pure water as an oral contrast agent to fill the duodenum cavity before the CT examination. Images from Hospital one were acquired using three CT scanners: a 16-slice canner (Aquilion; Toshiba Medical Systems, Tokyo, Japan), 64-slice scanner (LightSpeed VCT, GE Medical Systems, Milwaukee, USA), and a 256-slice scanner (Brilliance iCT; Philips Healthcare, Cleveland, OH, USA). The CT parameters were tube voltage of 100 or 120 kVp, tube current of 200–700 mAs, pixel spacing of 0.539–0.881 mm, and slice thickness of 0.625–5.000 mm (median slice thickness, 1 mm). The nonionic contrast agents used were Iohexol (Yangtze River Pharmaceutical Group, Taizhou, China) and Iodixanol and Iohexol (GE Healthcare Ireland, Carrigtohill, Ireland). The high-pressure syringe (3.0 mL/s) was used to inject nonionic contrast agent (1.5 mL/kg). After unenhanced scanning, arterial phase (25–35 s), portal venous phase (55–75 s), and delayed phase (120–180 s) were performed.
Images from Hospital two were acquired using two CT scanners: a 16-slice canner (Lightspeed; GE) and a 16-slice canner (Somatom Emotion; Siemens). The CT parameters were tube voltage of 120 kVp and tube current of 300 mAs. The layer thickness is 1 mm, and the layer spacing is 1 mm. The nonionic iodine contrast agent Ioferol (300 mgI/mL) was injected through the cubical vein with a total volume of 80–100 mL and an injection flow rate of 2.5–3.0 mL/s with a high-pressure syringe. After unenhanced scanning, arterial phase (25 s), portal venous phase (50–60 s), and delayed phase (150–180 s) were performed.
Image analysisAll images were reviewed by two radiologists independently (C.T. and C.S., with 6 and 7 years of experience in abdominal CT interpretation, respectively). Both observers were blinded to the clinical and histopathological data but knew the patients had periampullary adenocarcinoma. Any discrepancy was resolved by a third radiologist (Y.H. with 25 years of experience in abdominal CT interpretation). Throughout the whole evaluation process, the radiologist needs to evaluate the CT images comprehensively in the transverse, sagittal, and coronal views, as well as evaluating the CT images in all phases in order to make a final conclusion.
The evaluation of imaging features was referred to previous relevant studies [21,22,23]. The qualitative evaluation features were as follows: (a) presence of ampulla mass; (b) growth pattern (intrinsic, extrinsic, or mixed); (c) presence of bulging ampulla; (d) shape of distal common bile duct (CBD) margin (smooth or irregular); (e) symmetry of distal CBD lumen (symmetric or asymmetric); (f) pattern of distal CBD narrowing (gradual tapering or abrupt narrowing); (g) pattern of biliary dilatation (central or proportional); (h) presence of intrahepatic ducts (IHD) dilatation; (i) IHD dilatation extent (no to mild dilation or moderate to severe dilation); (j) presence of thickened distal CBD wall (> 1.5 mm); (k) presence of dilated main pancreatic duct (MPD) (> 3 mm); (l) presence of peripancreatic lymph node enlargement (short diameter > 1 cm); (m) presence of necrosis, calcification, or cystic within the lesion; (n) enhancement degree (similar or different enhancement degree to adjacent normal duodenal wall on the portal venous phase); (o) peak enhancement phase of lesion (arterial phase, portal venous phase or delayed phase); (p) presence of main vascular involvement; (q) presence of periampullary duodenal diverticulum; and (r) presence of pancreatic involvement.
The quantitative evaluation features were as follows: (a) size of ampullary mass (mm); (b) angle of distal CBD end (°); (c) diameter of dilated CBD (mm); and (d) diameter of MPD (mm).
To confirm that the radiological features were highly reproducible and reliable, intraclass correlation coefficients (ICCs) were calculated to test interobserver agreement in the Hospital one dataset.
Development and validation of prediction modelsWe used 18 qualitative CT features and 5 clinical variables to construct prediction models. To select the classifier prediction model with the highest discrimination between pancreatobiliary- and intestinal-type periampullary adenocarcinoma, we selected five ML classifiers including light gradient boosting (LightGBM), multi-layer perceptron (MLP), eXtreme Gradient Boosting (XGBoost), random forest, and logistic regression. We applied these classifiers in the training set and performed fivefold internal cross-validation to explore the optimal hyperparameters. Subsequently, the SHapley Additive exPlanations (SHAP) model interpretation method was used to individually calculate and analyze how each feature affected the output of the best classifier [24].
All models were validated in the internal validation cohort and external validation cohort. We plotted receiver operating characteristic curve (ROC) and compared the area under curve (AUC) using DeLong's test. Furthermore, we calculated the classifier’s accuracy, sensitivity, specificity, positive predictive value (PPV), negative predictive value (NPV), and F1 score. Finally, we selected the best predictive model based on metrics and plotted its calibration curve and clinical decision analysis (DCA) in external validation to assess their performance in clinical application.
Evaluation of prognosis for periampullary adenocarcinomaPrognostic analysis was performed in the Hospital one dataset (the training cohort and the internal validation cohort). Our prognostic outcomes included disease-free survival (DFS) and overall survival (OS), with DFS defined as the time from the start of tumor randomization to recurrence or death of the patient due to progression, and OS defined as the time to all-cause death. One patient was lost during follow-up.
Statistical analysisThe tests of normality were conducted for continuous variables, using the Student’s t-test, expressed as mean ± standard deviation, for normally distributed continuous variables; using the Mann–Whitney U test, described as median with interquartile range, for non-normally distributed continuous variables. Categorical variables were expressed as percentage values using the chi-square or Fisher’s exact tests. Cohen’s kappa value and ICC values were calculated to evaluate the strength of interobserver agreement between the two radiologists (0.00–0.20 poor agreement, 0.21–0.40 fair agreement, 0.41–0.60 moderate agreement, 0.61–0.80 good agreement, and 0.81–1.00 excellent agreement). We used Kaplan–Meier curves to evaluate DFS and OS in the actual and predicted PAC subgroups to assess prognosis value of the model. The same survival analysis was performed based on the organ origin of the lesion, which was divided into four groups including the ampulla, duodenum, pancreas, and the CBD.
All statistical analyses were performed using SPSS software (version 27.0) and Python software (version 3.11). A two-tailed P value of < 0.05 indicates statistical significance.
留言 (0)