
記住我


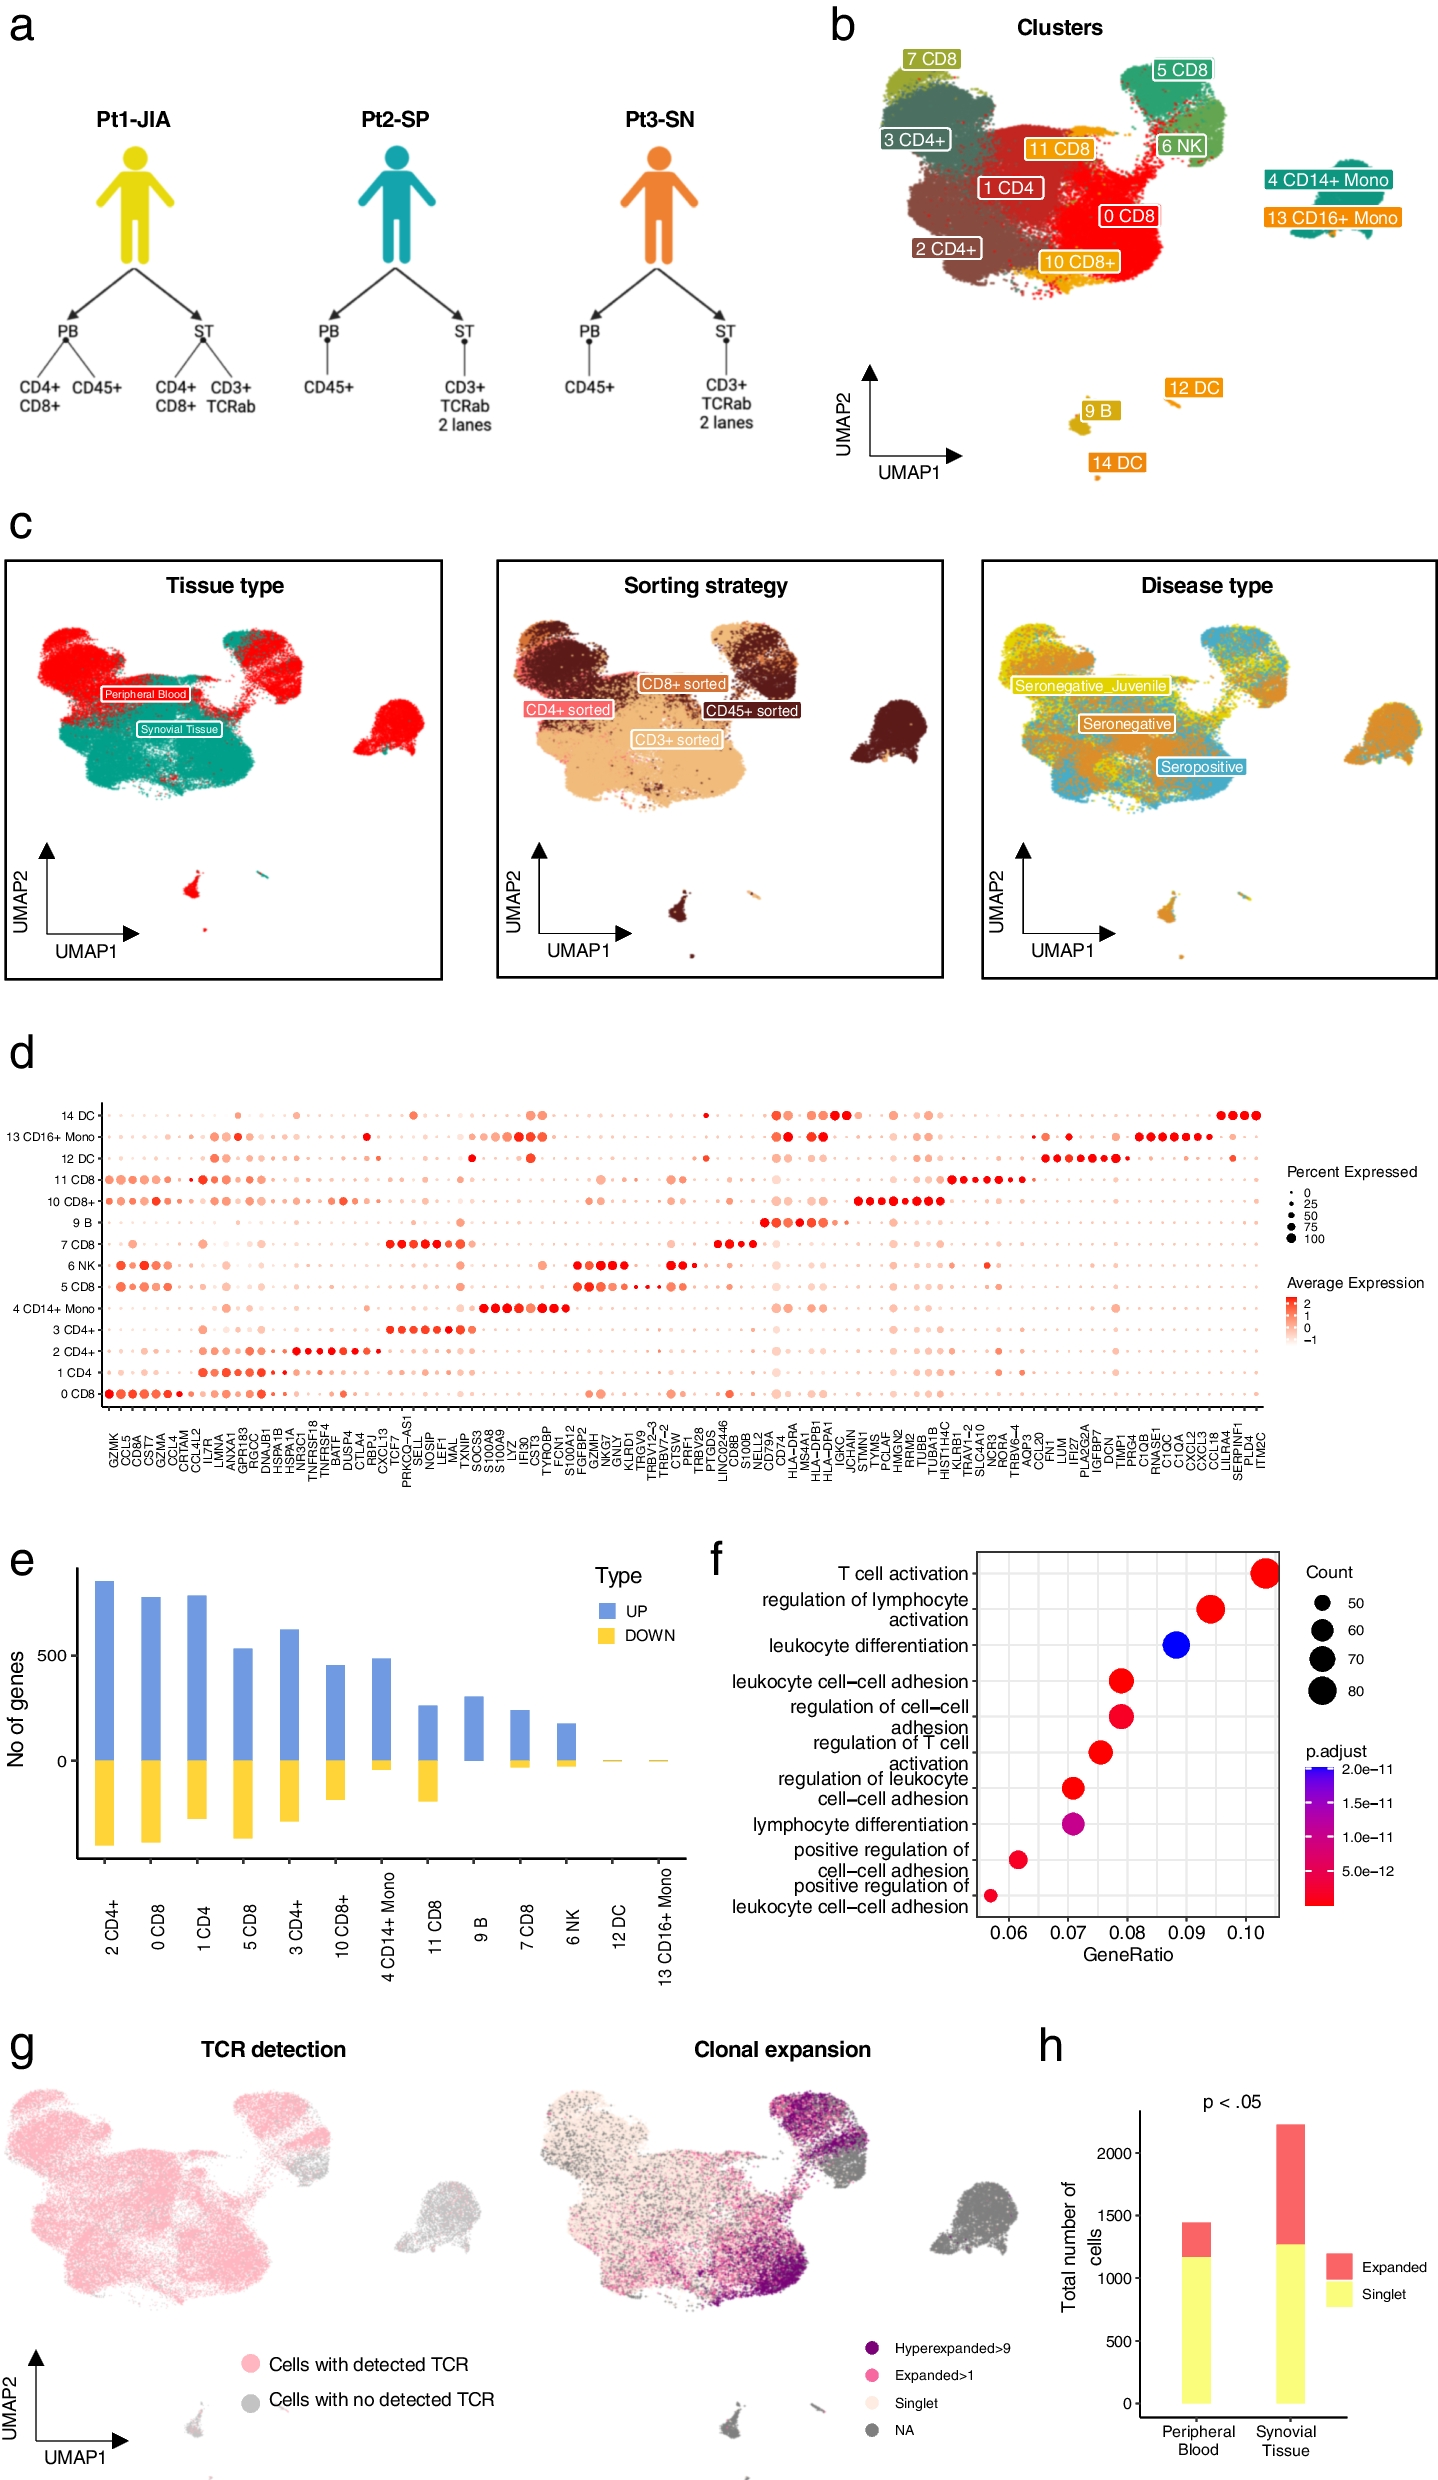
To characterise the phenotypic and clonal diversity of T cells in IMA, we analysed paired synovial tissue (ST) and peripheral blood (PB) samples from three patients. The patients had been diagnosed with seronegative juvenile arthritis (Pt1-JIA), seropositive RA (Pt2-SP) and seronegative RA (Pt3-SN), and at the time of sampling they were refractory to treatment (Fig. 1a, Additional file 2: Table). All patients have had prior treatments including anti-TNF, anti-CTLA4 and JAK inhibitors. Available clinical information is presented in the Additional file 2: Table.
Fig. 1
Phenotypic characterization of CD45 + cells in the cohort. a Overview of the study—Patient cohort and study samples. b Uniform Manifold Approximation and Projection (UMAP) representation and unsupervised clustering of all cells from the IMA samples (n = 3) profiled with scRNA + TCRαβ-seq. c Left: UMAP representation of the cells from ST and PB in each cluster as identified in our study. Middle: UMAP representation of the cells as per sorting strategy in each cluster as identified in our study. Right: UMAP representation of the cells representing different disease types. d Dot plot with scaled expression of top 8 DE genes between IMA phenotype clusters (Padj < 0.05, calculated as Bonferroni corrected Wilcoxon test). e Number of DE genes both upregulated and downregulated between cells from ST and PB for each cluster (Padj < 0.05, |Log2FC| > 0.5 calculated with Bonferroni corrected two-sided t-test). f Pathway enrichment analysis with GO biological processes (Hypergeometric testing). g Left: Focused UMAP of all cells with TCR from panel 1b. Right: Proportion of the cells identified as Hyperexpanded (> 9), Expanded (> 1) and Singlet as identified in the UMAP. h Cells detected as expanded versus cells detected as singlets in ST and PB in our data shows that expanded cells are enriched in ST (Padj < 0.05, Benjamini–Hochberg corrected Fisher’s one-sided exact test)
We profiled flow sorted T cells and CD45 + leukocytes from ST and PB using 10x Genomics 5´-scRNA + V(D)J-seq (Additional file 1: Fig. S1a). In addition, in one set of samples (from Pt1-JIA), CD4 + and CD8 + T cells were sorted and processed separately to corroborate the scRNA-seq based annotation of these cell types (Additional file 1: Fig. S1a). Altogether, we captured 68,610 cells passing quality control thresholds (Additional file 1: Fig. S1b). Batch effects between individual samples were corrected for using scVI (Lopez et al. 2018) (Additional file 1: Fig. S1c, d and Methods). We integrated the data from all individual samples and visualised the subpopulation structure using UMAP dimensionality reduction as implemented in the Seurat package (Satija et al. 2015) (Fig. 1b, Additional file 1: Fig. S2a). Clusters were primarily identified based on the expression of canonical markers (Additional file 1: Fig. S2b). We observed strong transcriptomic differences between the tissue of origin in concordance with previous reports (Wu et al. 2021; Argyriou et al. 2022) (Fig. 1c, leftmost panel). Although our patient cohort represented different disease subtypes and sorting strategies, the subpopulation structures did not exhibit marked differences based on disease type or patient (Fig. 1c, middle—right panel, Additional file 1: Fig. S2c–e). The top 8 differentially expressed (DE) genes from each of the clusters are represented in Fig. 1d. To better identify sources of heterogeneity in our clusters we computed differentially expressed (DE) genes between all cells from ST and all cells from PB for each cluster and found that the highest number of DE genes were found in CD4 + and CD8 + T cell clusters (Fig. 1e). As expected, cells from the synovial tissue represented a more inflamed (LMNA + , CREM +) and activated (CXCL13+ , CCL5 + CCL4 + , and RGCC+) phenotype (Additional file 1: Fig. S3a). Pathway enrichment analysis using GO biological processes as the reference gene set identified that cells in ST are enriched for processes including T cell activation and leukocyte adhesion (Fig. 1f). We additionally compared the compound expression values of gene modules from Azizi et al. (2018) and Long et al. (2015) between ST and PB, further confirming a more activated, inflammatory and exhausted state among the synovial cells (Additional file 1: Fig. S3b). Notably, the expression of each module was significantly higher among clonally expanded cells (Additional file 1: Fig. S3c).
To better understand how clonally expanded cells are distributed between PB and ST, we then integrated the single-cell TCR data from both tissue types. Cells with detected TCRs (either α or β or both chains) are highlighted in Fig. 1g. Clones were defined as either expanded (at least two cells with identical CDR3b) or singlets (unique CDR3b in each cell). Additionally, clones were categorised as hyperexpanded (at least ten cells with identical CDR3b) Fig. 1g right panel). As reported before (Seder and Ahmed 2003), CD8 + T cells had a higher number of hyperexpanded clones as compared to CD4 + T cells. We measured the overall clonality in all CD45 sorted samples (3115 cells from ST and 2473 from PB) using only one sequencing library per patient (to ensure that there was no sequencing depth related bias for samples that were profiled twice). Overall, ST T cells were found to be less clonal (Gini index 0.358) as compared to PB (Gini index 0.584) as the clones in PB were substantially bigger (Additional file 1: Fig. S3d, e). However, by comparing the number of expanded clones versus singlets, we found that ST compartment was enriched for expanded cells (Fig. 1h) (Fisher's exact test, p value < 2.2e-16, odds ratio 0.3).
Cytotoxic, inflamed, and highly activated CD4 + T cells with proliferation-associated gene expression signatures dominate the synovial tissue samplesTo further narrow down on the differences between the tissue types, we next subsetted the CD4 + and CD8 + T cells and analysed them separately. DE analysis of the CD4 + T cells from ST (17,720 cells) and PB (16,414 cells) confirmed that the ST cells represented a more inflamed (LMNA + CREM +), activated (CXCL13 + LGALS1 +), and exhausted (LAG3 + PDCD1 +) phenotype (Fig. 2a-b). Additionally, the ST cells uniformly expressed higher amounts of transcription factor TOX (Fig. 2a), a known marker for repeated antigen stimulation (Maschmeyer et al. 2021) and Th1 subset differentiation (Page et al. 2018; Guo et al. 2020). In contrast, PB cells had uniformly higher expression of TCF7 (Fig. 2a-b), a marker for T cell stemness and self-renewal capacity (Escobar et al. 2020) that has also been proposed to have a significant role in activating B cells via Tfh (Xu et al. 2015; Wu et al. 2015).
Fig. 2
CD4 + and CD8 + T cells and their phenotypes in IMA. a Feature plot of top DE genes between ST and PB CD4 + T cells (Padj < 0.05, |Log2FC| > 0.5 calculated with Bonferroni corrected two-sided t-test). b Left: UMAP representation of the re-clustered CD4 + T cells. Right: UMAP representation of the tissue origin. c UMAP representation of TCR clones identified as Hyperexpanded (> 9), Expanded (> 1) and Singlet. d Violin plot of top DE genes between ST and PB in re-clustered Tregs (Padj < 0.05, |Log2FC| > 0.5 calculated with Bonferroni corrected two-sided t-test). e Proportion of cells in different phases of cell cycle in all CD4 + cells in PB and ST. f Left: UMAP representation of the re-clustered CD8 + T cells. Right: UMAP representation of the tissue origin. g UMAP representation of TCR clones identified as Hyperexpanded (> 9), Expanded (> 1) and Singlet. h Feature plot of top DE genes that are different between ST and PB in CD8 + T cells (Padj < 0.05, |Log2FC| > 0.5 calculated with Bonferroni corrected two-sided t-test)
Subclustering of the CD4 + T cells resulted in 8 clusters (Fig. 2b left panel), with very limited overlap between the two tissues (Fig. 2b right panel, Additional file 1: Fig. S4a–c). Clusters 0 and 7 consisted primarily of PB cells. The cells in cluster 0 expressed genes associated with naïve phenotype such as TCF7, SELL, and CCR7 (Additional file 1: Fig. S4d). The cells in cluster 7 expressed immediate early response genes (Neeb et al. 2012) EGR1, IER2, JUN, and FOS (Additional file 1: Fig. S4d), resembling a population of EGR1 + naive CD4 + T cells described in a recent report by Argyriou et al. (Argyriou et al. 2022). Clusters 3, 4, and 6 consisted of cells from both tissues. The cells in cluster 3 expressed memory cell-associated genes IL7R and LTB. Cluster 4 consisted of regulatory T cells expressing FOXP3, IL2RA (encoding CD25), RTKN2, and IKZF2 (encoding Helios). The cells in cluster 6 expressed high levels of genes associated with cytotoxic phenotype, including FGFBP2, GNLY, and NKG7 (Additional file 1: Fig. S4d). Clusters 1, 2, and 5 were enriched to the ST. Cluster 1 consisted of memory cells co-expressing GZMK and IL7R. Cluster 2 consisted of ST cells expressing CXCL13, ADGRG1, PDCD1 (Additional file 1: Fig. S4d), and other markers associated with a peripheral helper phenotype (Argyriou et al. 2022). In addition, these cells expressed several known cell division markers (GOS2). The cells in cluster 5 expressed elevated levels of IFNG and TNF together with GZMK and stress-associated transcripts HSPA6 and DNAJB1 (Additional file 1: Fig. S4d). By comparing the TCR data with the clustering, we found that expanded clones were present in cluster 2 (Tph) and most significantly in cluster 6 (cytotoxic) (Fig. 2c). Notably, the clonally expanded cluster 6 was shared between Pt1-JIA and Pt2-SP (Additional file 1: Fig. S4c).
The cluster of Treg cells (cluster 4) was identified based on the expression of the canonical FOXP3 gene (Additional file 1: Fig. S4e). Interestingly, while falling into the same cluster, the Tregs from blood were phenotypically different from the ones in ST, with the ST Tregs comprising a more activated phenotype (Fig. 2d, Additional file 1: Fig. S4d). DE gene analysis showed that Tregs from ST expressed TNFRSF9, a marker for T cell activation (Bartkowiak and Curran 2015) and co-inhibitory receptor CTLA4 (Fig. 2d). The DE genes also included inhibitor of cell cycle TSPYL2, regulator of TLR4 signalling pathway PHLDA1, and PKM (Peng 2022; Xu et al. 2019) (Fig. 2d, Additional file 1: Fig. S4e). The TCR data indicated modest clonal expansion within the Treg cluster: 17% of the Tregs in ST were expanded as compared to 2% in PB (p < 0.05, Fisher’s exact test).
To gain further insights into the developmental relatedness of the observed clusters, we assessed the extent of clonal overlap amongst them using Morisita’s index (Rempala and Seweryn 2013). While we found that the overall frequency of shared TCR clones was low, a higher index score (translating to higher similarity) was found between clusters 1 (Tmem GZMK + CCR7 +) and 6 (cytotoxic CD4 +) (Additional file 1: Fig. S4f). The clonality between ST (Gini index 0.21) and PB (Gini 0.203) was comparable but the expanded clones, were still enriched to ST (p-value < 2.2e-16, Fisher's exact test).
Interestingly, cells from ST preferentially belonged to the G2/M phases (both overall and in all individual clusters) whereas in PB cells were mostly in G1 phase (Fig. 2e, Additional file 1: Fig. S4g). Additionally, the expression of proliferation-associated genes FABP5, G0S2, and MKI67 was significantly higher in ST than in PB (Additional file 1: Fig. S4h). Cluster 2 was enriched in cells assigned to G2/M phases, expressed high levels of proliferation-associated genes, and exhibited clonal expansion, suggesting antigen-driven proliferation in the ST. As the ST samples were mechanically dissociated, we cannot rule out stress-related response, but interestingly, this effect was stronger in expanded cells than in singlets, suggesting that the observed differences are related to clonal expansion (Additional file 1: Fig. S5a). We also performed additional tests to check if tissue related differences were technical artifacts. scVI was used with tissue of origin as batch key to mitigate possible batch effects but this did not remove the signature as cells from PB and ST still formed their distinct clusters (Additional file 1: Fig. S5b). To further validate the finding, we also analysed a single-cell RNA-seq dataset from both PB and synovial membrane of 20 patients with either seropositive or seronegative RA recently published by Wu et al. (Wu et al. 2021) (Methods). In concordance with our data, there was an overall higher proliferation score (defined by combined expression of LIF, IL2, CENPV, NME1, FABP5, ORC6, G0S2, and GCK) among the synovial membrane derived CD4 + T cells (Additional file 1: Fig. S5c, d).
Clonally expanded CD8 + T cells are predominantly localised in the synovial tissue in patients with seronegative diseaseWe next analysed CD8 + T cells and subclustered them separately to achieve a higher resolution of the phenotypes and their relationship with the TCR clonotypes. The clusters were annotated based on the top DE genes (Additional file 2: Table) and known CD8 + T cell markers. As with the CD4 + T cells, we observed high heterogeneity between the CD8 + T cells from ST and PB (Fig. 2f, Additional file 1: Fig. S6a–c). However, the CD8 + T cells represented a more heterogeneous population as the top expanded clone(s) from each patient occupied a distinct space in the UMAP representation of clusters. Both tissue types (PB and ST) harboured a high number of expanded and hyper expanded clones (Fig. 2g).
Sub-clustering of the CD8 + T cells resulted in 9 clusters (Fig. 2f). By comparing the top DE genes between ST and PB we found that similar to the CD4 + T cells, the CD8 + T cells in ST represented an inflamed (CREM, LMNA), activated (HLA genes, LAG3) and less cytotoxic (GNLY, FGFBP2) effector memory phenotype (GZMK) (Fig. 2h). However, CD8 + T cells lacked expression of the chemokine CXCL13 and the galectin LGALS1. Similar to the CD4 + T cells, ST CD8 + T cells were enriched in the G2/M phases of cell cycle (Additional file 1: Fig. S6d).
Clusters 2, 5, 6, and 10 consisted primarily of PB cells (Fig. 2f right panel). The cells in clusters 2 and 6 expressed effector-related genes FGFBP2, GNLY, and GZMH (Fig. 2h, Additional file 1: Fig. S6e). In addition, cluster 2 cells expressed ZNF683 (encoding Hobit (Mackay et al. 2016)) and cluster 6 cells expressed cytotoxicity-associated genes KLRC1 and KLRC2 (Additional file 1: Fig. S6e). Cluster 5 consisted of cells expressing genes associated with a naive phenotype, including LEF1, TCF7, and SELL (Additional file 1: Fig. S6e). Clusters 4, 7, 8, and 9 consisted of cells from both tissues. The top upregulated marker gene for cluster 4 was TXNIP, a key regulator of oxidative stress and inflammatory response (Jiang et al. 2022). Recently, TXNIP has been suggested to promote M1 pro-inflammatory polarisation thereby inhibiting the M2 anti-inflammatory polarisation in RA (Li et al. 2021). Cluster 7 represented a highly clonal cluster and consisted of top clones from multiple patients. Cluster 8 was identified as highly proliferative along with expression of cell cycle genes (MKI67, STMN1) (Additional file 1: Fig. S6e).
Clusters 0, 1, and 3 were enriched for ST cells. Cluster 0 harboured the hyper expanded clone from Pt2-SP and top markers included HLA genes (HLA-DRB5, HLA-DRB1, HLA-DQA1, HLA-DRA) and chemokine CXCR6 known to have a role in B cell migration in RA (Zhao 2022) (Fig. 2h). The top upregulated genes for cluster 1 included FTH1, previously shown to be upregulated in the synovium of RA patients (Ling et al. 2022). Both clusters 0 and 1 upregulated expression of inflammatory markers RGCC and CREM. Cluster 3 represented a highly activated signature with top upregulated genes including inflammatory cytokines (IFNG, TNF, TNFSF9) and transcription factors (JUN, FOSB) (Fig. 2h, Additional file 1: Fig. S6e).
Cells within clonal families acquire a more proliferative, inflammatory, and activated phenotype when trafficking from PB to STLastly, we examined the overlap of TCR sequences between the ST and PB in each individual patient. We pooled all CD4 + and CD8 + T cells separately (Methods) and further grouped all cells with identical CDR3b aa sequences into unique clones. Since there were no shared expanded clones between the patients, the results are reported at individual patient level.
In the CD4 + compartment, we searched for all TCRs that were found in both PB and ST and that were detected in at least three cells in both tissues. We found altogether 12 such intersecting TCR clones pertaining to 637 cells, and they were derived from two individual patients, Pt1-JIA and Pt2-SP (Fig. 3a, Additional file 1: Fig. S7a–c, Additional file 1: Table). Majority of these clones were coming from PB (458 cells from PB and 179 from ST) and were hyperexpanded in PB as compared to ST (Additional file 1: Fig. S7d) and thus could potentially reflect immune responses to previous infections. However, we found no matches for common viral or bacterial epitopes in the existing VDJ database (Goncharov et al. 2022) for any of the intersecting clones. All discovered TCR matches were only for singlets (Additional file 1: Fig. S7e).
Fig. 3
Clonal trafficking of CD4 + and CD8 + T cells between synovial tissue and peripheral blood. a All common clones (defined by the exact same CDR3b sequence) in CD4 + cells between ST and PB presented in the UMAP representation from panel 2b. b Cells with clones CASSPGETQYF (left panel) and CASSLSGGAGELFF (right panel) as projected in UMAP representation from 2b. c Left: DE genes between ST and PB cells sharing the same CDR3b sequence CASSPGETQYF in Pt1-JIA (Padj < 0.05, |Log2FC| > 0.5 calculated with Bonferroni corrected Wilcoxon test). Right: DE genes between ST and PB cells sharing the same CDR3b sequence. CASSLSGGAGELFF in Pt1-JIA (Padj < 0.05, |Log2FC| > 0.5 calculated with Bonferroni corrected two-sided t-test). d Number of cells with CDR3b clones CASSPGETQYF and CASSLSGGAGELFF in different clusters as identified in UMAP representation from 2b. e DE genes of all CD4 + T cells that are enriched in ST as compared to PB (Padj < 0.05, |Log2FC| > 0.5 calculated with Bonferroni corrected two-sided t-test). f Top upregulated GO-BP pathways in CD4 + T cells that are enriched in ST as compared to PB (Padj < 0.05, Benjamini–Hochberg corrected Fisher’s one-sided exact test on differentially expressed genes). g UMAP representation of all CD4 + T cells predicted to have a motif in GLIPH2 analysis as seen in expanded versus non expanded cells. h DE genes of CD4 + T cells that are predicted to have a pattern in GLIPH2 and are enriched to ST as compared to PB. i All common clones (defined by the exact same CDR3b sequence) in CD8 + T cells between ST and PB presented in the UMAP representation from panel 2f. j Cells with clones CASRGGTSITDTQYF as projected in UMAP representation from 2f. k DE genes between ST and PB cells sharing the same CDR3b sequence CASRGGTSITDTQYF in Pt2-SP (Padj < 0.05, calculated with Bonferroni corrected two-sided t-test)
We compared the phenotype of the clones between PB and ST, and only two clones (CDR3b sequence—CASSPGETQYF and CASSLSGGAGELFF), both originating from the PT1-JIA had significant DE genes between the two tissue types (Fig. 3b left and right panel). Both clones were enriched to PB and to cytotoxic CD4 + cluster 6 (p < 0.05, Fisher’s exact test). Top DE genes from both clones included the genes LMNA, RGCC, CREM, CDKN1A, and GPR35 (Fig. 3c) in the ST as compared to PB, suggesting that also cells belonging to bystander clones can develop an inflammatory ST phenotype when trafficked to the ST. Both clones were mainly detected within the cytotoxic cluster 6 (Fig. 3d). We found only one clone (CASSAFSAGATNEQFF) enriched to the ST but due to low cell numbers could not find any DE genes between the tissues for this clone.
Since this approach was somewhat limited by the number of cells, we then pooled all T cell clones that were enriched in the ST and found 113 clones (p < 0.05, Fisher's exact test). DE gene analysis showed that ST enriched clones have a more activated profile (Fig. 3e).
Pathway enrichment analysis with hypergeometric testing against the GO Biological Process database identified T cell activation and positive regulation of cell adhesion as the top hits (Fig. 3f). Using GLIPH2 (Sharma et al. 2021), we used publicly available data from a cohort of JIA patients, as reported by Henderson et al. (Henderson et al. 2016), to check TCR level similarity between the two cohorts. All patterns found in the healthy samples and Lyme disease patients were removed to retain possible RA associated motifs only. We found common motifs (Additional file 2: Table) between these two cohorts in some of the hyperexpanded clones from PB and ST (Fig. 3g) although with disparate phenotypes (Additional file 1: Fig. S7f). Interestingly, TCRs which were predicted to target similar antigens, were enriched to both expanded and intersecting clones. Additionally, by performing DE gene analysis we found that predicted TCRs with similarity were more cytotoxic (GZMH, GNLY, NKG7, GZMB, GZMA) and they overexpressed the TRBV7-6 gene (Fig. 3h). Previous publications have shown that TRBV7 family is overexpressed in JIA (Henderson et al. 2016).
In CD8 + T cells, as the average clone size was much bigger, a significantly higher number of clones (n = 101, pertaining to 7409 cells) was shared between PB and ST and in between clusters (Fig. 3i, Additional file 2: Table, Additional file 1: Fig. S7g, h). 8 of these clones were enriched to the ST as compared to PB. Interestingly, Pt2-SP harboured a large clone in the ST consisting of 27% of the CD8 + T cells (CDR3b sequence – CASRGGTSITDTQYF). This clone was also detected in PB with a much smaller frequency of only 2% and in a phenotypically different cluster, indicating local proliferation of specific T cell clones in the synovium (Fig. 3j, Additional file 1: Fig. S7g, h). By performing a DE gene analysis between cells with the same TCR but between different tissues of origin, we found that the top upregulated genes in ST were CCL4 and CREM (Fig. 3k).
留言 (0)