2.1 Study design
The animal experiment was approved by the Committee for Control and Supervision of Experiments on Animals (CPCSEA), New Delhi, India, after approval of the Institutional Animal Ethics Committee (IAEC) [IAEC/KMC/115/2016 dated 16/12/2016]. Twenty Wistar rats, irrespective of gender, 90 days of age, weighing between 200 and 300 g were included in the study. Fifteen of them were arbitrarily allocated to three groups. The test group included rats in which implants were placed after the incorporation of plant extract-derived NPs into the osteotomy site. Bone sample numbers for the test group derived after different time intervals are as follows: Sample numbers 1 (2 weeks); 3 and 9 (4 weeks) and 5 and 7 (6 weeks). The control group comprised rats in which only implants were placed devoid of NPs. The samples are number 10 (2 weeks); 6 and 8 (4 weeks) and 2 and 4 (6 weeks). The sham group involved rats used for blood collection for biochemical analysis and no implant was placed in them. This group included sample numbers 11 (2 weeks), 12 and 13 (4 weeks), and 14 and 15 (6 weeks).
2.2 Preparation of plant extract
CQ plant material was collected locally as detailed below in “Preparation of plant extract”. Ethanol (95%) was procured from Finar, Mumbai. Polyvinyl alcohol (PVA) and polycaprolactone (PCL) were purchased from Sigma-Aldrich, Bangalore. All other ingredients used were of analytical/ reagent grade.
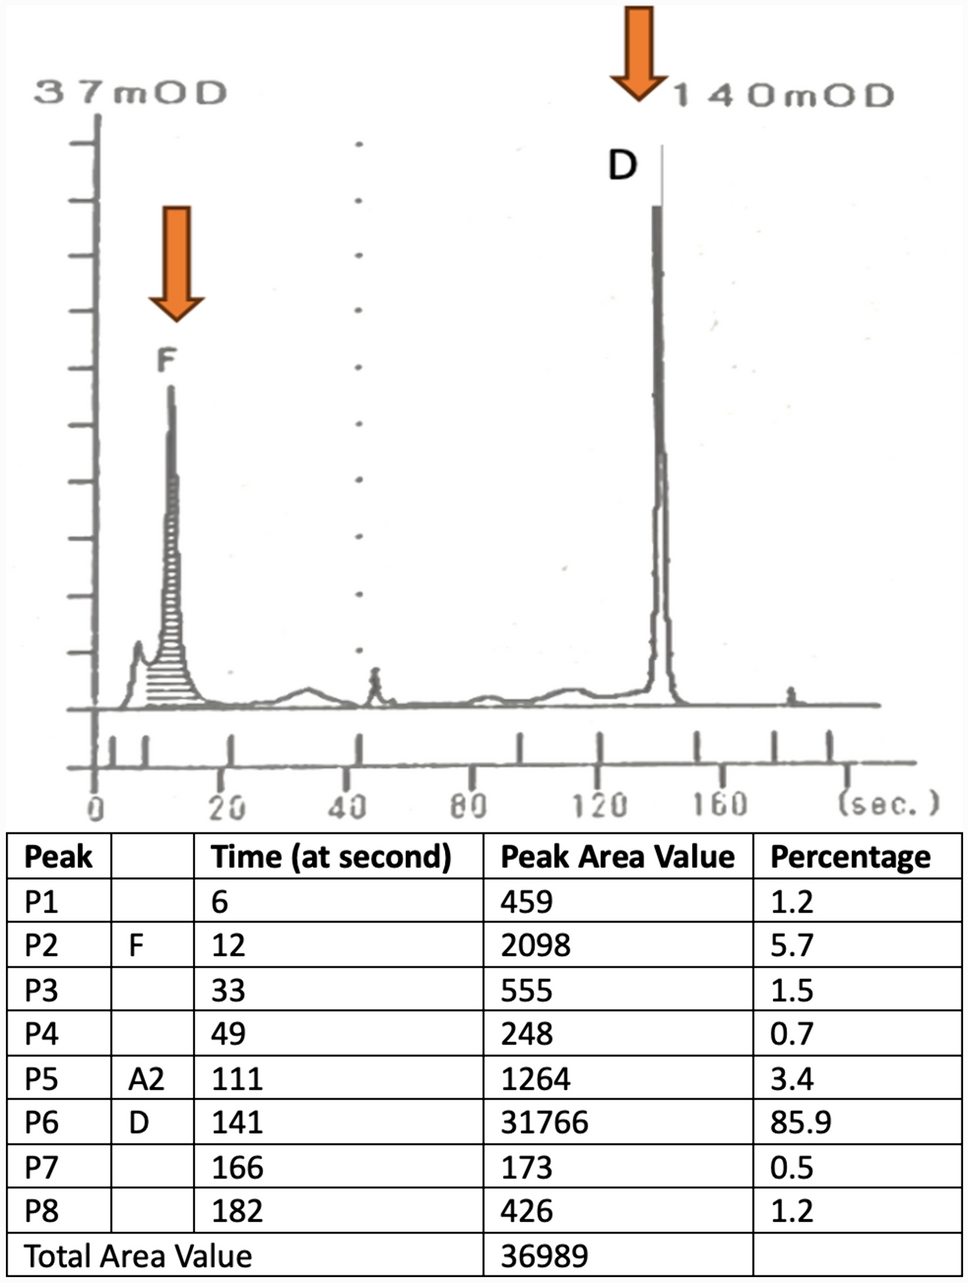
Fresh CQ plant material was collected from a local nursery and authenticated by a senior pharmacist. The herbarium was prepared (PP 616, voucher no. 514) and preserved at the Herbarium and Botanic Museum of the Pharmacy school. Four kilograms of plant stem were dried in a hot air oven at 110 °C for 30 min and ground into a coarse powder. Extraction from the plant material was carried out using a Soxhlet Extractor by the application of heat. Approximately 300 g of the fine powder was used with 2L of 95% ethanol as solvent. The collected extract was separated from the solvent by fractional distillation. The ethanolic plant extract was collected in a distillation flask and transferred into a petri dish for drying in a hot water bath at ≈ 60 °C for about 7 h and then collected in a glass beaker [6]. The prepared ethanolic extract was characterized by Reverse Phase High Performance Liquid Chromatography (HPLC).
2.3 Formulation of NPs from the plant extract
Acetone (5 ml) was used as the solvent to dissolve 10 mg of the extract and 50 mg of PCL. Acetone was added dropwise to PVA solution (20 ml of 1% w/v in water) using a magnetic stirrer at 500 rpm and continued for 30 min. The dispersion was subjected to probe sonication (Pulse: 6 s; Amplitude of 40%; Time: 20 min) for size reduction. The nano-suspension was kept for stirring overnight on a magnetic stirrer at 500 rpm to remove acetone. It was centrifuged at 15,000 rpm at 4 °C for 30 min and the pellet was re-dispersed in 5 ml of 5% w/v mannitol solution in water. The resultant dispersion was then subjected to lyophilization for 48 h. The NPs were characterized based on size, zeta potential, and polydispersity index (PDI) using a ZetaSizer (NanoZS, Malvern Instruments, UK) before and after lyophilization. The surface morphology of the nanoparticles was assessed by Transmission electron microscopy (TEM; CM200, Philips, USA). A small quantity of nanoparticles was diluted with Milli-Q water and stained with 2% w/v phosphotungstic acid for 1 min. Then, the sample was placed on the copper grid for visualization of particles.
2.4 Estimation of the entrapment efficiency (EE) of the NPs
Entrapment efficiency was determined by the procedure explained below: The supernatant obtained after centrifugation was collected and free ethanolic extract present in the supernatant was measured for its absorbance using a UV spectrophotometer. The absorbance readings obtained with the extract alone and the nanoparticulate extract demonstrated the EE of the NPs. The EE was calculated to determine the percentage of the extract entrapped or absorbed by the nanoparticles using the equation, EE (%) = [(T-F)/T] × 100, where T and F are total extract content and free or un-entrapped extract in the supernatant.
The lambda max of the extract was found to be 255.4 nm. The calibration curve was linear with an R2 value of 0.9914 in the concentration range of 1–5 µg/ml. The calibration curve equation was found to be y = 0.1997x–0.0371. The entrapment efficiency of the extract was found to be 94.5 ± 1.01%.
2.5 Pilot study
A pilot study was conducted in Two Wistar rats to check for the feasibility of molar tooth extraction under anesthesia. A 2 mm osteotomy site was prepared in the maxillary bone using a straight fissure bur. This procedure was carried out to ascertain whether the preparation of an implant receptor site was easier than the insertion of an implant into an extraction socket. As the thickness of the bone intra-orally was inadequate to place implants, we placed the implants in the femoral bone [7,8,9] following the Animal Research: Reporting of In Vivo Experiment (ARRIVE) guidelines.
2.6 Implant design and its configuration
In the present study, ten Straumann® Dental implants: SLA® Standard, Standard Plus, Tapered Effect, Bone Level, and Bone Level Tapered were used. (Test group: 5; Control group: 5; Dimensions: 3.3 mm in diameter and 8 mm in length).
2.7 Surgical implant placement procedure
Rats were anesthetized using an intraperitoneal injection of 500 mg of thiopental sodium in 20 ml of distilled water. The dosage was determined based on the body weight of the rodent and an approximate amount of 0.5–0.6 ml was used [10, 11].
About 2 ml of blood was collected from the retro-orbital site by the capillary method in plain vacutainer (without any anticoagulant) and sent to the laboratory for cryopreservation. The animals were immobilized supine, and the hind limbs were shaved and disinfected with 10% povidone-iodine. The knee joint was fully exposed. A cylindrical hole was prepared at the intercondylar notch, parallel to the femoral long axis, using implant drills (Straumann implant placement kit). The drills were used in an ascending diameter to prepare the osteotomy site such that the longitudinal axis of the drill hole was placed parallel to the longitudinal axis of the femoral diaphysis. The drilling sequence was as follows: initial punch with a round bur (1200 rpm), pilot drill (800 rpm), 2 mm diameter drill (600 rpm), and finally 3.3 mm diameter drill (500 rpm). A short drill for bone-level implants up to the mark of 8 mm (length) was used and continuous profuse irrigation with physiological saline via syringe was done to minimize frictional heat and thermal necrosis. One implant was placed in each of the osteotomy sites mechanically with the implant driver.
2.8 Experimental analysis
2mgs of NPs were incorporated into the osteotomy before implantation in the animals belonging to the test group. For the control group, the implants were directly placed after the osteotomy procedure without the incorporation of NPs. An average insertion torque of around 30N-cm was achieved. After the insertion of the implants, the operating field was cleaned, and the wound was closed with non-resorbable sutures (Polyamide 4.0; Ethicon Products). Animals were monitored daily for 1-week post-surgery to detect issues related to wound healing and mobility. Post-procedure, all rats had free access to the normal pellet of food and water.
The rats were euthanized after 2, 4, and 6 weeks, the femoral condyles were dissected and cleaned from adhering tissues. Specimens were then processed for the evaluation of peri-implant bone regeneration. The femoral bone harvested from all the rats was analyzed by Cone Beam Computed Tomography (CBCT) for the quantification of implant osseointegration. The histologic evaluation was done to assess the quality of bone-implant osseointegration. Biochemical analysis was performed before and after placing the implants to monitor the levels of Alkaline phosphatase (ALP) and Acid phosphatase (ACP). Finally, the surface topography of the implant post-osseointegration was analyzed with scanning electron microscopy (SEM).
2.9 Radiographic imaging of the implant site
The bone samples were scanned using a CBCT system (iCAT Vision Q) with a scan resolution of 0.25 Voxel (120–kVP, 20.2 mA, and an integration time of 14.7 s). The region of interest was marked as a circle of 0.5 mm diameter to evaluate the density of the trabecular bone around the implant. The samples were segmented and the region of interest for Bone-Implant Contact (BIC) evaluation was defined 2 pixels away from the implant surface. CBCT machines have proved to cause beam attenuation in the presence of a metal [12, 13]. To avoid any discrepancy in the obtained results, digital radiographs were taken with an Intra-Oral X-ray System (Kodak Cs 2100, 60 kV, 7 mA, 0.125 secs).
2.10 Histological examination
The femoral bones that were retrieved were fixed in 10% buffered formalin. The implant site was excised using a carborundum disk. The samples were dehydrated with an increasing concentration of alcohol following which the tissue was submerged in self-cure acrylic resin (Dentsply, Rapid Repair Clear Acrylic), and the blocks were processed with the Leica SP1600 saw microtome (Leica Biosystems, Danaher Corporation). Thin ground sections were prepared parallel to the longitudinal axis of the femur. These sections were then decalcified, decreased to a thickness of 30 µm, and stained with Toluidine Blue dye. Digital light microscopic images were produced with an Olympus dotSlide 2.0 Virtual Microscopy system (dotSlide—Virtual Slide System, Olympus; 200 × magnification) [14, 15].
2.11 Scanning electron microscopy (SEM)
The calcified bone-implant samples mounted in polymethylmethacrylate were uniformly sputtered with silver using a sputtering system. Four different sides of the sputtered section were compared—an image presenting the entire length of the implant (longitudinal section) with the host bone, an image focused on the left side of the implant, an image focused on the right side of the implant and an image focused on the apex of the implant. These samples were then examined by SEM (EVO MA 18 with Oxford EDS (X-act) to characterize the surface morphology of the osseointegrated implants [16, 17]. The samples were visualized under different magnifications at 2, 4, and 6-week intervals and the results of the radiographic investigation were confirmed.
2.12 Biochemical analysis
Determination of serum alkaline phosphatase (ALP) was carried out by para-nitrophenyl phosphate (pNPP) Kinetic method (Diagnostic reagent kit, Tulip Diagnostics Ltd.). Estimation of Serum acid phosphatase (ACP) was done by α—Naphthylphosphate Kinetic method (Tulip Diagnostics Ltd.). The absorbance for ALP and ACP was measured at a wavelength of 405 nm. Animal experiments have evaluated ALP and ACP (Tartrate-resistant acid phosphatase; TRAP) levels to assess osteoblastic and osteoclastic activity respectively around dental implants [18, 19].
2.13 Statistical analysis
All statistical evaluations and data presentations were performed with SPSS (version 24.0, IBM Corporation). The data were subjected to a one-way analysis of variance test (ANOVA). Statistical significance was determined at a 95 percent confidence level. The normality of data was analyzed by the Shapiro–Wilk test. As the data followed normal distribution, the parametric tests were used to analyze the data. The one-way ANOVA test was used to check the mean dissimilarities among the groups. Post hoc analysis was done using Tukey’s (honestly significant difference) HSD test.


留言 (0)