
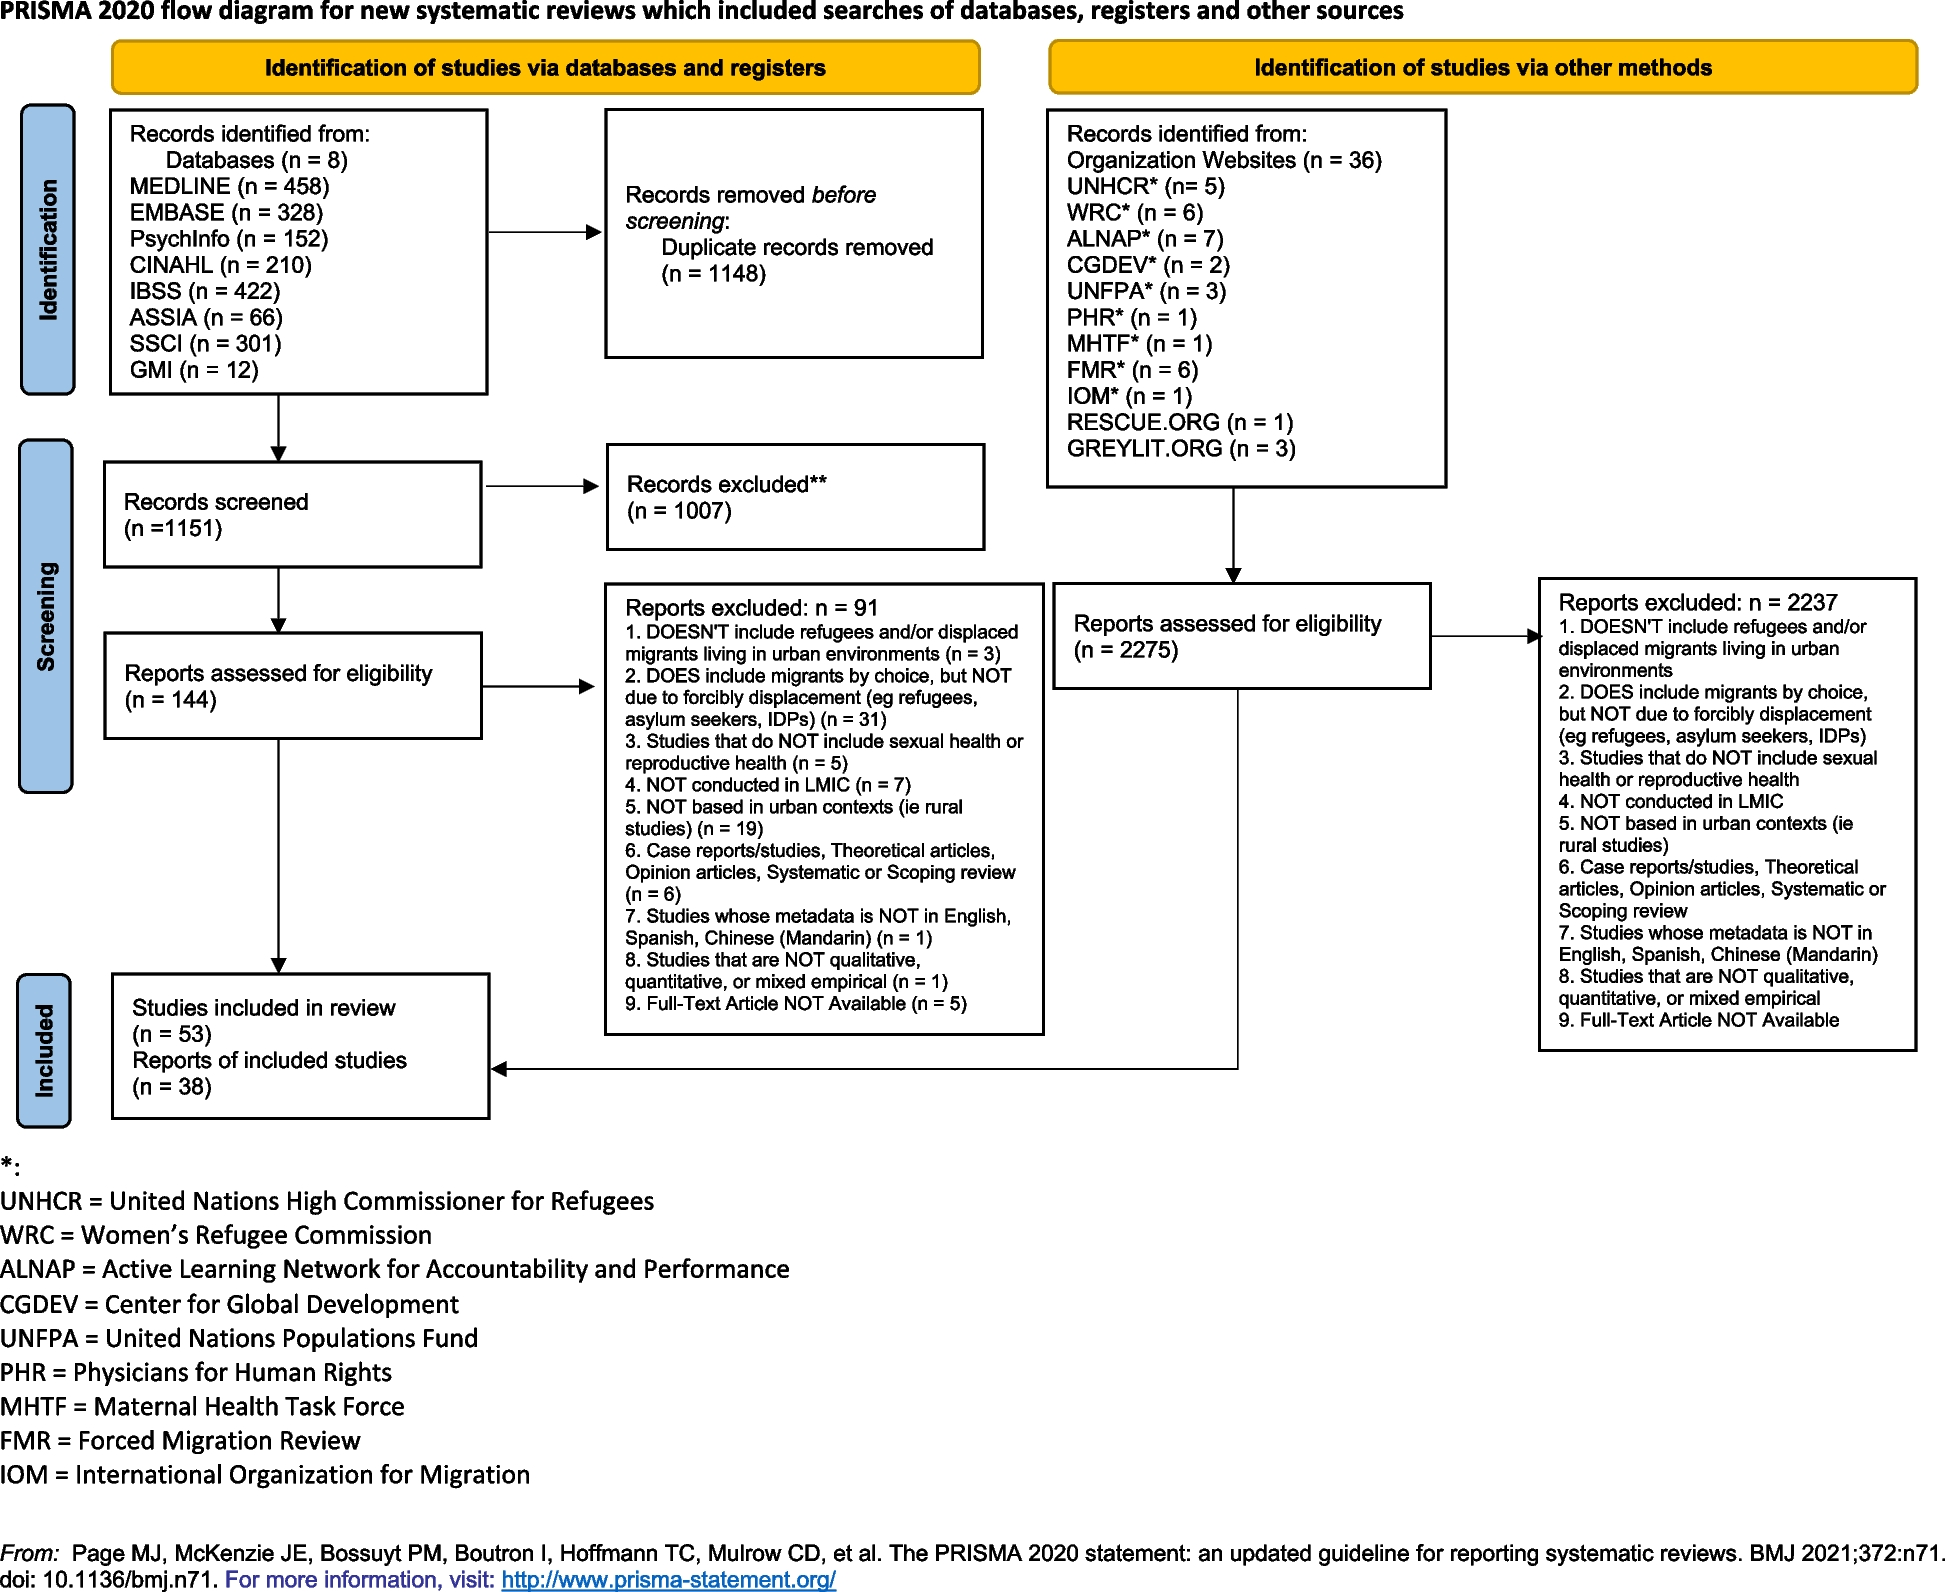
記住我


The number of currently married/in union women of ages 15–49 years varied from 84,289 in 1993 to 512,408 in 2021. The 1993 survey had the largest number of missing responses to unmet need-related questions with 1,183 missing responses, which accounted for 1·4% of all responses that year. The final analytic sample for each survey round is represented in Table 1.
Patterns of Change in Unmet Need PrevalenceAll–India total unmet need prevalence decreased from 20·6% (95% CI: 20·1–21·2%) in 1993, to 9·4% (95% CI: 9·3–9·6%) in 2021 (Table 2 and Fig. 1), representing an absolute annual change of –0·40 percentage points (Fig. 2). The largest decline in total unmet need prevalence occurred between 1993 and 1999, with an annual absolute reduction of 0·75 percentage points.
Table 2 Prevalence of Unmet Need (%) and 95% Confidence Interval (CI), 1993–2021Fig. 1
Prevalence of Total Unmet Need for India and 36 States/Union Territories, 1993–2021
Fig. 2
Standardized Absolute Change (Percentage Points) for prevalence of Total Unmet Need
All–India prevalence of unmet need for spacing reduced from 12·4% (95% CI: 10·0– 12·8%) in 1993, to 4·0% (95% CI: 4·0–4·2%) in 2021. Prevalence of unmet need for limiting declined from 8·2% (95% CI: 7·9–8·6%) in 1993, to 5·4% (95% CI: 5·3–5·5%) in 2021 (Table 2).
Assessing the patterns in change of total unmet need prevalence across states/UTs from 1993 to 2021, the largest standardized absolute changes representing worsening prevalence as indicated by positive values, were observed for Kerala (0·01%) and Mizoram (0·24%) (Fig. 2). In the most recent period (2016–2021), Manipur (–3·57%) and Nagaland (–2·63%) had the largest negative standardized absolute change, thus had the greatest decrease in total unmet need prevalence.
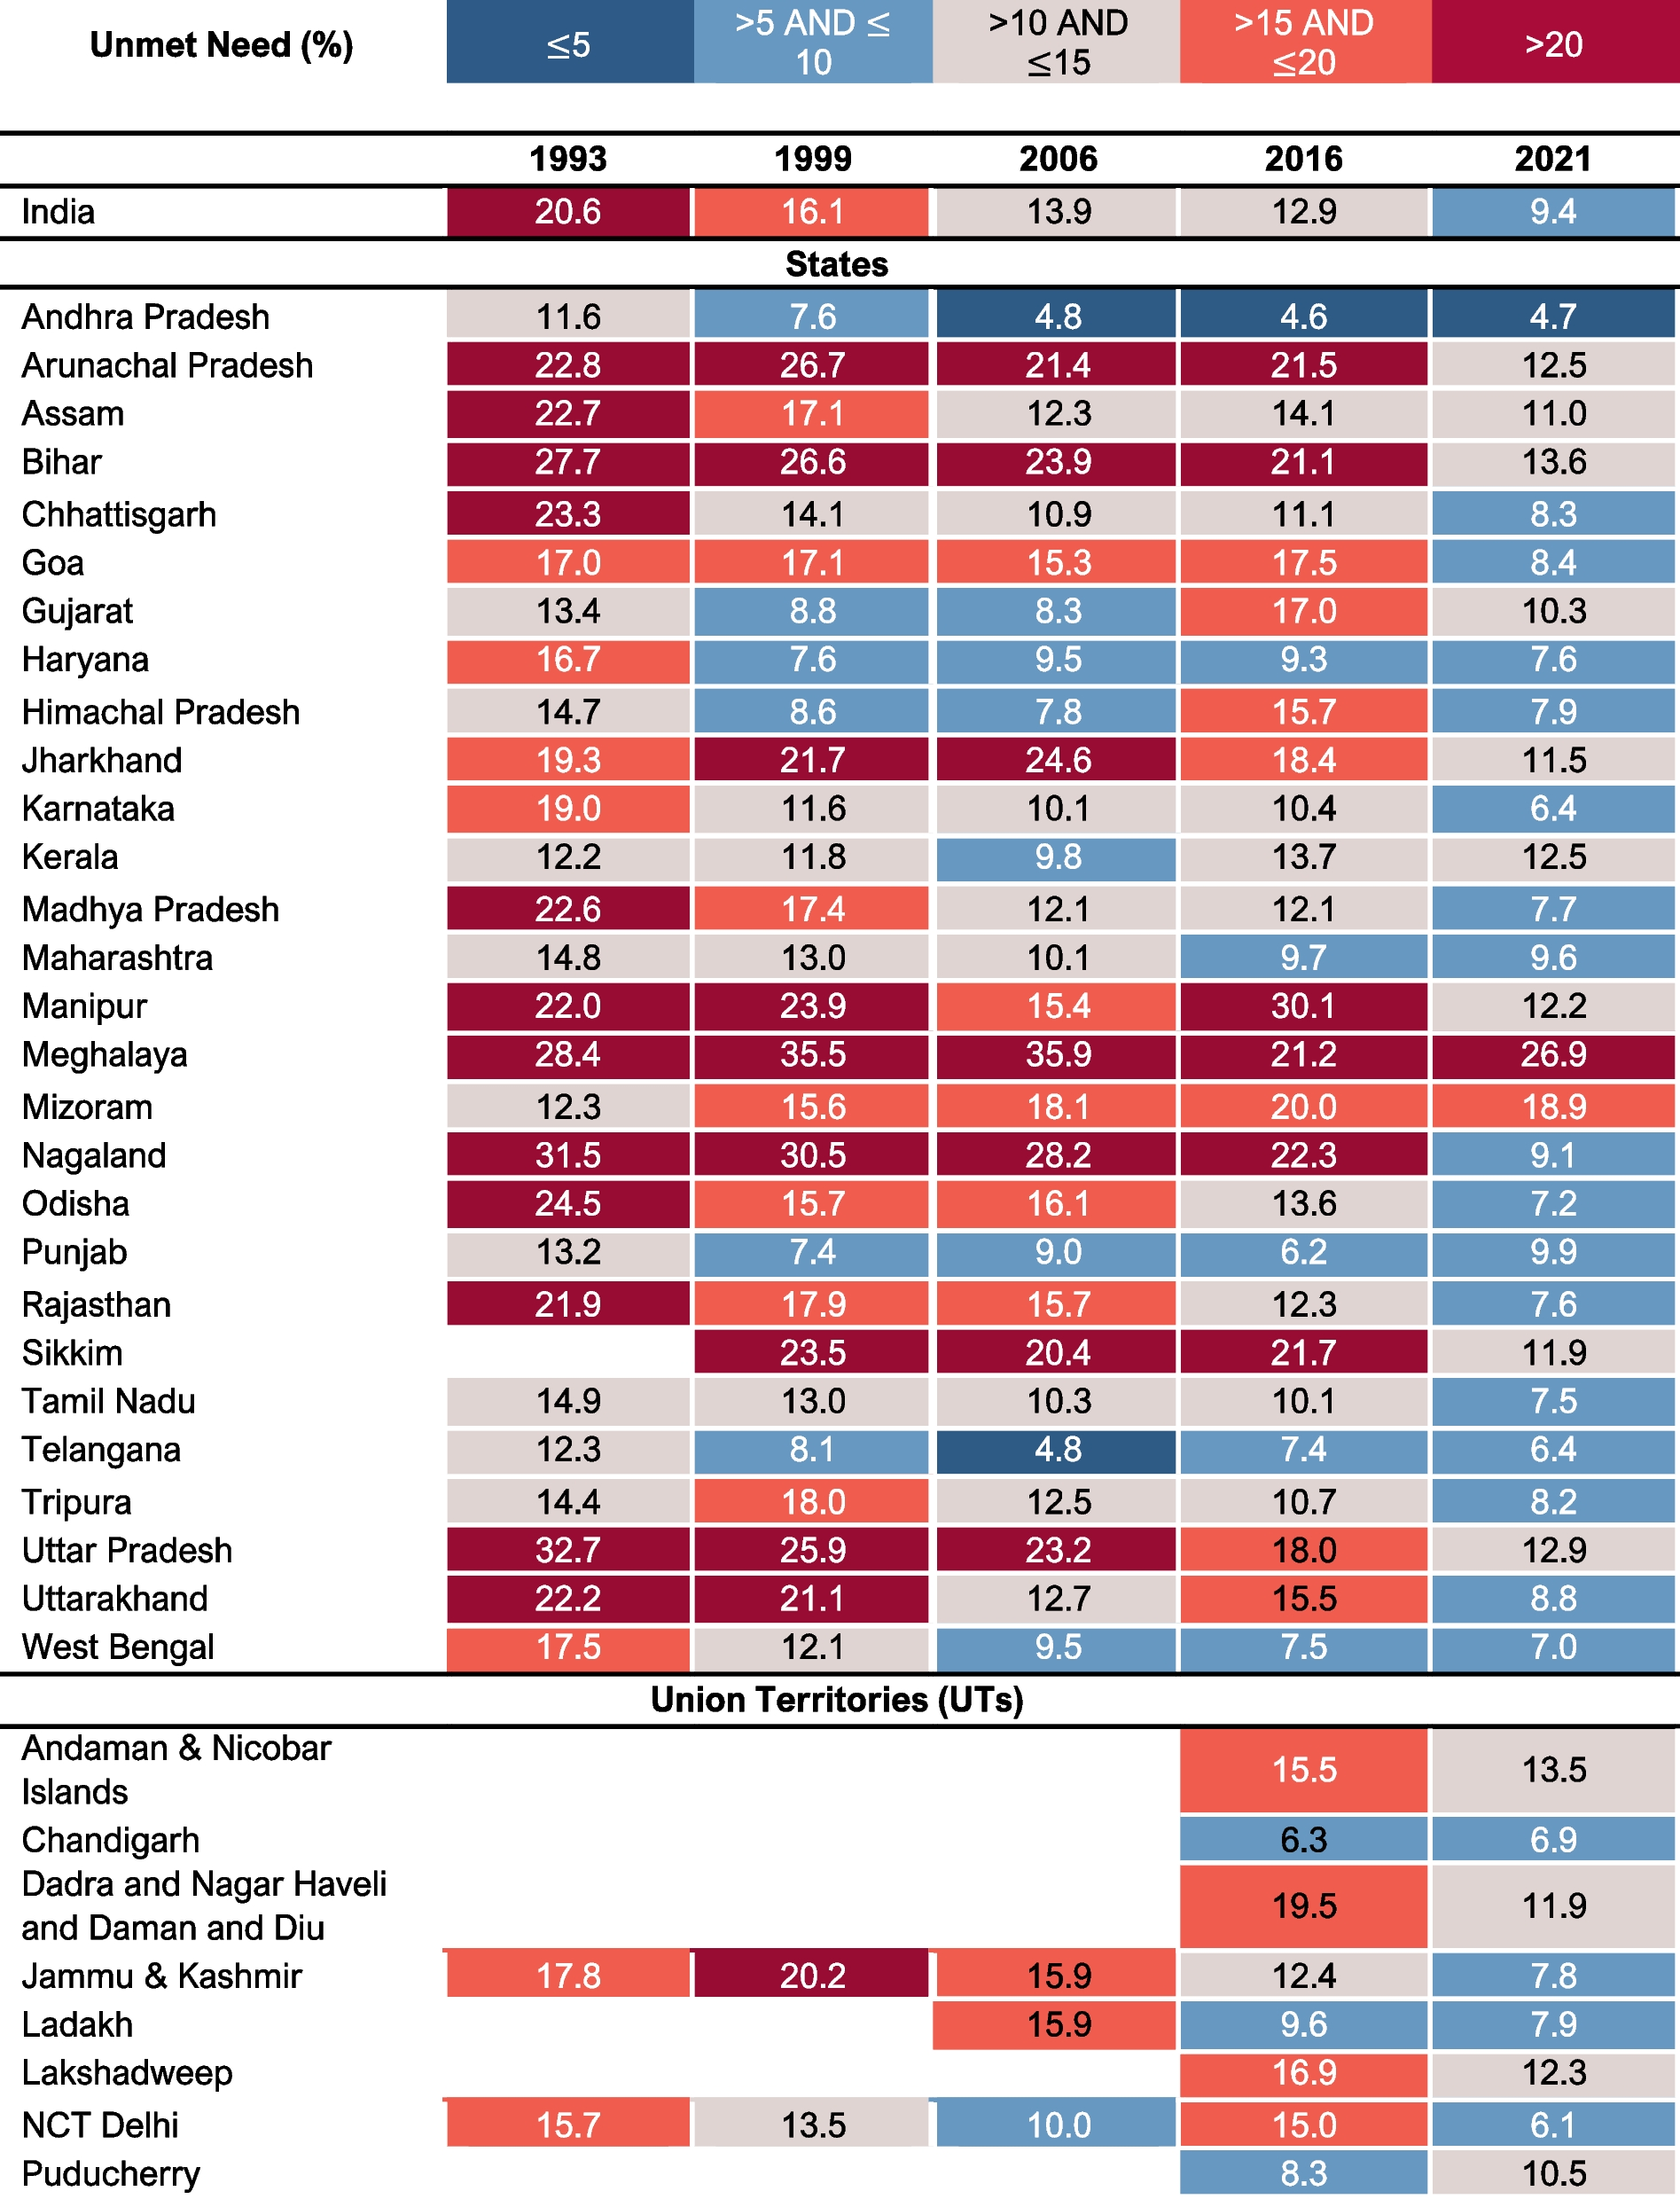
Overall, the number of states with prevalence of total unmet need greater than 20% declined in 2021 as compared to 1993, with 12 states in 1993 as opposed to one state in 2021 (Fig. 1 and Additional File 1 Table S1). In 1993, Uttar Pradesh (32·7%, 95% CI: 31·4–34·1%) had the highest prevalence, followed by Nagaland (31·5%, 95% CI: 27·7–35·3%) and Meghalaya (28·4%, 95% CI: 24·7–32·1%). By 2021, the prevalence decreased significantly in Uttar Pradesh (12·9%, 95% CI: 12·5–13·2%) and Nagaland (9·1%, 95% CI: 7·8–10·4%). However, Meghalaya (26·9%, 95% CI: 25·3–28·6%) did not see a large decrease and it was the only state with prevalence greater than 20%.
The number of states with prevalence of unmet need for spacing greater than 15% decreased from seven states in 1993 to one state in 2021 (Additional File 1 Table S2). Meghalaya was the state with the highest prevalence from 1993 (24·1%, 95% CI: 20·8–27·5%) to 2021 (18·3%, 95% CI: 16·7–19·9%). In 1993, Uttar Pradesh (19·1%, 95% CI: 18·0–20·1%) had the second-highest prevalence and it saw a significant decrease by 2021 (4·8%, 95% CI: 4·6–5·0%).
Similarly, the number of states with prevalence of unmet need for limiting greater than 10%, declined from five states in 1993 to zero states in 2021 (Additional File 1 Table S3). In 1993, Nagaland (14·4%, 95% CI: 11·8–16·9%) had the highest prevalence, and it saw a notable decline by 2021 (4·7%, 95% CI: 3·8–5·6%). Meghalaya had a relatively low prevalence in 1993 (4·2%, 95% CI: 3·0–5·4%), however it had the greatest prevalence in 2021 (8·6%, 95% CI: 7·6–9·7%).
It was discerned that total unmet need prevalence in 1993 (baseline) was inversely associated with the standardized absolute change between 1993 and 2021 (r = –0·73), i.e. states with a higher prevalence in 1993 experienced a greater decline on average (Fig. 3).
Fig. 3
Relationship between 1993 Total Unmet Need Prevalence and Standardized Absolute Change for 1993–2021. Note: AN: Andaman & Nicobar, AP: Andhra Pradesh, AR: Arunachal Pradesh, AS: Assam, BR: Bihar, CH: Chandigarh, CG: Chhattisgarh, DH: Dadra and Nagar Haveli and Daman and Diu, GA: Goa, GJ: Gujarat, HR: Haryana, HP: Himachal Pradesh, JK: Jammu & Kashmir, JH: Jharkhand, KA: Karnataka, KL: Kerala, LK: Ladakh, LD: Lakshadweep, MP: Madhya Pradesh, MH: Maharashtra, MN: Manipur, ML: Meghalaya, MZ: Mizoram, DL:NCT Delhi, NL: Nagaland, OR: Odisha, PY: Puducherry, PB: Punjab, RJ: Rajasthan, SK: Sikkim, TN: Tamil Nadu, TL: Telangana, TR: Tripura, UP: Uttar Pradesh, UK: Uttarakhand, WB: West Bengal
Changes in the Geographic Distribution of Unmet Need PrevalenceInequalities in prevalence among states and UTs, measured by interquartile range (IQR), which is a measure of statistical variability, significantly decreased from 1993 to 2021, with a sharp decline after 2016 (Fig. 4). The IQR decreased from 8·0% (25th percentile: 14·7%, 75th percentile: 22·7%) in 1993 to 4·5% (25th percentile: 7·6%, 75th percentile: 12·1%) in 2021 (Additional File 1 Table S4).
Fig. 4
Summary distribution of state/union territory-level Total Unmet Need for family planning, 1993–2021. Note: Box-and-whisker plots show the variability of a data set using lowest and highest values, and quartiles of the data. The upper and lower whiskers represent minimum and maximum values respectively. The upper outline of the box depicts 75th percentile and the lower outline represents the 25th percentile. The line within the box shows the median (i.e., 50th percentile)
In 2021, total unmet need was concentrated in the north and north east with Meghalaya (26·9%, 95% CI: 25·3–28·6%) and Mizoram (18·9%, 95% CI: 17·2–20·6%) having the highest total unmet need prevalence, followed by the northern states of Bihar (13·6%, 95% CI: 13·1–14·1%) and Uttar Pradesh (12·9%, 95% CI: 12·5–13·2%) (Additional File 1 Table S1). Substantially lower prevalence were noted in the southern states of Andhra Pradesh (4·7%, 95% CI: 4·2–5·2%), Karnataka (6·4%, 95% CI: 6·0–6·9%), and Telangana (6·4%, 95% CI: 6·0–6·9%), and the northern UT of NCT Delhi (6·1%, 95% CI: 5·4–6·8%). A similar geographic distribution was observed in 1993.
Unmet need for spacing was similar amongst northern and southern states in 2021. However, higher prevalence was observed in north-eastern states, and Mizoram (12·9%, 95% CI: 11·2–14·5%) and Meghalaya (18·3%, 95% CI: 16·7–19·9%) had the highest values (Additional File 1 Table S2). This trend was also observed in 1993, with Arunachal Pradesh (15·4%, 95% CI: 12·6–18·3%), Nagaland (17·2%, 95% CI: 14·0–20·3%), and Meghalaya (24·1%, 95% CI: 20·8–27·5%) having some of the highest values.
In 2021, the unmet need for limiting was substantially lower in most southern states as compared to northern states, and the southern state of Andhra Pradesh had the lowest prevalence (2·0%, 95% CI: 1·7–2·4%) (Additional File 1 Table S3). Similarly, in 1993, northern states tended to have higher prevalence than other geographical areas. The states of Bihar (10·6%, 95% CI: 9·5–11·8%), Uttarakhand (11·4%, 95% CI: 8·3–14·4%), and Uttar Pradesh (13·7%, 95% CI: 12·8–14·6%) had higher prevalence values than the national estimate in 1993.
It was estimated that 17 states/UTs are on track to meet the ICPD + 25 target of zero unmet need by 2030, while 19 will not, based on their current trajectories (Additional File 1 Table S5). All southern states/UTs except Karnataka are off-target, and Andhra Pradesh is expected to never reach the target at its current rate as the AAC from 2016–2021 in total unmet need prevalence (0·01%) was lower than the RAC (–0·3%). The negative value indicates that a decline of 0·3% per year is required, however an increase of 0·01% per year from 2016–2021 was observed. Meghalaya, Punjab, Chandigarh, and Puducherry are also expected to never reach the target due to having lower AAC than RAC. Maharashtra, Mizoram and West Bengal are expected to reach the target after 2100, if the current AAC persists.
Estimated Headcount of Total Unmet Need PrevalenceWe estimated that 24,194,428 women had an unmet need for family planning in 2021. The headcount varied from 5,140,642 in Uttar Pradesh to 1,793 in Lakshadweep (Table 3). Nine of these states accounted for approximately 75% of the population with unmet need. These were Uttar Pradesh (21·25%), Bihar (12·78%), Maharashtra (9·65%), West Bengal (6·72%), Gujarat (5·11%), Rajasthan (4·88%), Madhya Pradesh (4·77%), Tamil Nadu (4·74%), and Karnataka (3·58%). Of the UTs, NCT Delhi was the largest contributor with 220,630 women (0·91%).
Table 3 Estimated headcount of women with Unmet Need for India and 36 States/Union Territories, 2021Correlates of Total Unmet Need PrevalenceWe found that all-India total unmet need prevalence in 2021 was the greatest among women of ages 15–19 (17·8%, 95% CI: 17·0–18·6%), followed by women of ages 20–24 (17·3%, 95% CI: 16·9–17·7%). When patterned by religion and caste, unmet need was highest among Muslim women (11·8%, 95% CI: 11·3–12·3%), and women from Other Backward Class households (9·6%, 95% CI: 9·4–9·8%). It was found that larger proportion of women living in rural areas experience unmet need (9·9%, 95% CI: 9·7–10·0%), than those living in urban areas (8·4%, 95% CI: 8·2–8·7%). Unmet need prevalence increased with level of education attained and 12·6% (95% CI: 12·1–13·1%) of women with higher education had an unmet need for family planning. Patterning by wealth quintile depicted that the prevalence in the poorest group was approximately three percentage points higher than the richest group (Table 4 and Additional File 1 Table S6).
Table 4 Prevalence of Total Unmet Need (%) by Demographic and Socioeconomic characteristics, 2021
留言 (0)