
記住我
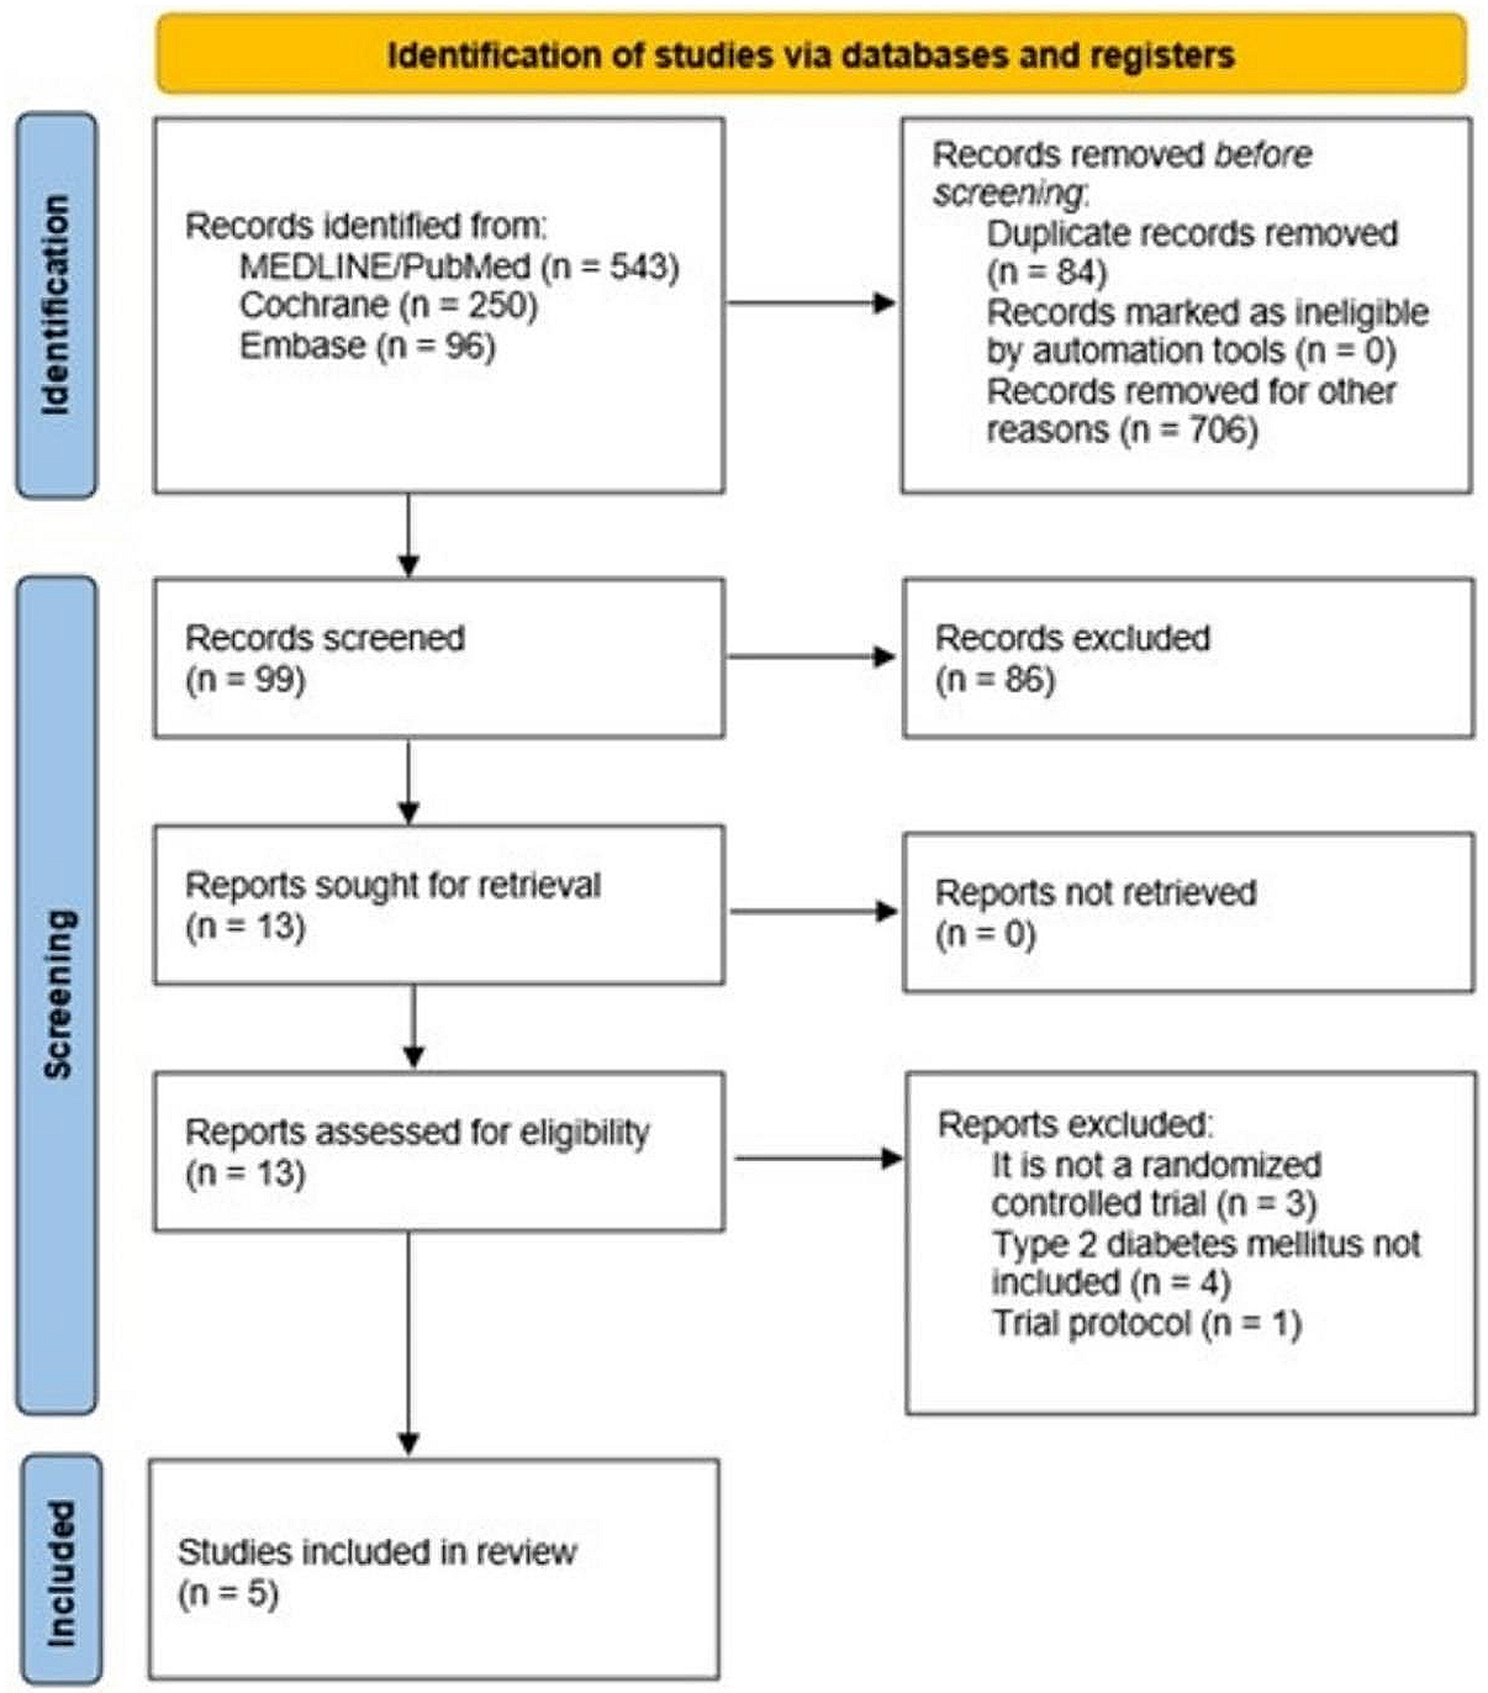


A total of 900 studies were identified after the initial search. After removing 32 duplicates, 868 studies were screened, and 860 were excluded based on the titles and abstracts. The full text of the remaining eight studies was reviewed. Ultimately, four studies [17,18,19,20] were found to be eligible for inclusion, shown in detail in (Fig. 1), while the other four were excluded (Additional file 1: Table S1).
Among the four included studies, one was published in 2020 [17], two in 2021 [18, 19], and another one in 2023 [20]. All the studies were double-blinded and had parallel group designs, and three were open-label. The main characteristics of the included studies, such as the mean age of the participants in the study and control groups, are presented in (Table 1).
Table 1 Study characteristics of the included studiesQuality assessmentRCTs were evaluated qualitatively using the Cochrane Risk of Bias Assessment Tool (ROB1) [14], findings presented in (Fig. 2). All studies were considered to be of high quality and had low risk of bias. Moreover, publication bias was not assessed for any of the outcomes as the number of included studies did not exceed 10.
Fig. 2
Risk of bias summary. The Cochrane “risk of bias” tool was used for quality assessment. Green for “no risk” and yellow for “unclear risk”
Glycemic parameters1. Estimated Mean Change in TIR (%)
The pooled analysis included all included studies with a sample size of 1035, random effects model was deemed suitable for this analysis, which demonstrated a significant 4.68% extended TIR with Insulin Icodec as compared to the once daily Glargine , shown in (Fig. 3). For the moderate heterogeneity associated with the overall result we performed leave-one-out analysis, removing the outlier study by Mathieu et al. [20], which resulted in complete resolution of heterogeneity and the MD still being significant 6.60 , (Additional file 2: Fig. S1). Furthermore, we analyzed the heterogeneity in detail, by employing various estimation methods, all of which resulted in similar I2 values, shown in (Additional file 2: Fig. S2).
Fig. 3
Forest plot of comparison: 1 Once weekly Insulin Icodec vs Once daily Insulin Glargine U-100, outcome: 1.1 Estimated Mean Change in Time with glucose in range (%) from baseline. Pooled analysis has been shown based on both common and random effects model
2. Estimated Mean Change in HbA1c (%)
All the included studies with a combined patient population of 1035 were pooled using a common effects model, which showed significant difference between the two insulins [MD = -0.09 ], presented in (Fig. 4). However, when we applied a random effects model to incorporate the heterogeneity in between studies the pooled result showed an insignificant difference between the two drugs in lowering mean HbA1c (%) from baseline [MD = − 0.12 ), (Fig. 4).
Fig. 4
Forest plot of comparison: 1 Once weekly Insulin Icodec vs Once daily Insulin Glargine U-100, outcome: 1.2 Estimated Mean Change in HbA1c (%) from baseline. Pooled analysis has been shown based on both common and random effects model
Leave-one-out analysis was conducted to find out the outlier study, after removing the study by Mathieu et al. [20], the heterogeneity reduced to 0% and the overall result turned to significantly better reduction in HbA1c (%) with Insulin Icodec [MD = − 0.20 ], (Additional file 2: Fig. S3).
3. Estimated Mean Change in FPG (mg/dL)
All the included studies were pooled for this analysis. No significant difference between Icodec and Once-Daily Insulin Glargine U-100 were shown with a MD of − 2.59 , shown in (Fig. 5).
Fig. 5
Forest plot of comparison: 1 Once weekly Insulin Icodec vs Once daily Insulin Glargine U-100, outcome: 1.3 Estimated Mean Change in Fasting Plasma Glucose (md/dL) from baseline
4. HbA1c Lower Than 7%
The OR for participants reaching HbA1c lower than 7% was 1.20 , showing no significant difference between the two comparators, (Fig. 6).
Fig. 6
Forest plot of comparison: 1 Once weekly Insulin Icodec vs Once daily Insulin Glargine U-100, outcome: 1.4 Odds ratio of participants achieving HbA1c < 7%
Safety parameters1. Any Adverse Event
The pooled OR for any adverse event was 1.10 , indicating no significant difference between weekly Icodec and Once-Daily Insulin Glargine U-100 with homogenous results, (Fig. 7).
Fig. 7
Forest plot of comparison: 1 Once weekly Insulin Icodec vs Once daily Insulin Glargine U-100, outcome: 1.5 Odds ratio for Any Adverse Event
2. Overall Hypoglycemia
The overall OR for hypoglycemia was 1.04 , (Fig. 8), indicating no significant difference between the two interventions. Subgroup analysis was performed based on the severity of hypoglycemia I.e., Hypoglycemia alert and combined clinically significant or severe hypoglycemia. The test for subgroup differences between Insulin Icodec and Insulin Glargine U-100 was insignificant (p-value = 0.90), (Fig. 8), demonstrating similar safety profiles in both subgroups.
Fig. 8
Forest plot of comparison: 1 Once weekly Insulin Icodec vs Once daily Insulin Glargine U-100, outcome: 1.6 Odds ratio of Overall Hypoglycemia. Subgroup analysis was performed based on the severity of hypoglycemia I.e., Hypoglycemia alert and combined clinically significant or severe hypoglycemia
3. Estimated Mean Body Weight Change (kg)
The overall MD in the estimated mean body weight change (kg) including all the four trials was 0.38 , indicating no significant difference between the two Insulin regimens, shown in (Fig. 9).
Fig. 9
Forest plot of comparison: 1 Once weekly Insulin Icodec vs Once daily Insulin Glargine U-100, outcome: 1.7 Estimated Mean Change in Body weight (kg) from baseline
4. Injection Site Reactions
The OR for injection site reactions between Insulin Icodec versus Insulin Glargine U-100 was nonsignificant , (Fig. 10).
Fig. 10
Forest plot of comparison: 1 Once weekly Insulin Icodec vs Once daily Insulin Glargine U-100, outcome: 1.8 Odds ratio for Injection site reactions
5. Hypersensitivity Reactions
All the included studies reported incidence of hypersensitivity reactions among the two interventions, the OR for this comparison was found to be , showing insignificant difference between the two drugs, (Fig. 11).
Fig. 11
Forest plot of comparison: 1 Once weekly Insulin Icodec vs Once daily Insulin Glargine U-100, outcome: 1.9 Odds ratio for Hypersensitivity reactions
6. Adverse Events Probably/Possibly Related to Basal Insulin
The combined pooled analysis suggested no significant difference between Icodec and Once-Daily Insulin Glargine U-100 , (Fig. 12).
Fig. 12
Forest plot of comparison: 1 Once weekly Insulin Icodec vs Once daily Insulin Glargine U-100, outcome: 1.10 Odds ratio for Adverse events probably/possibly due to basal insulin
留言 (0)