Study design and setting
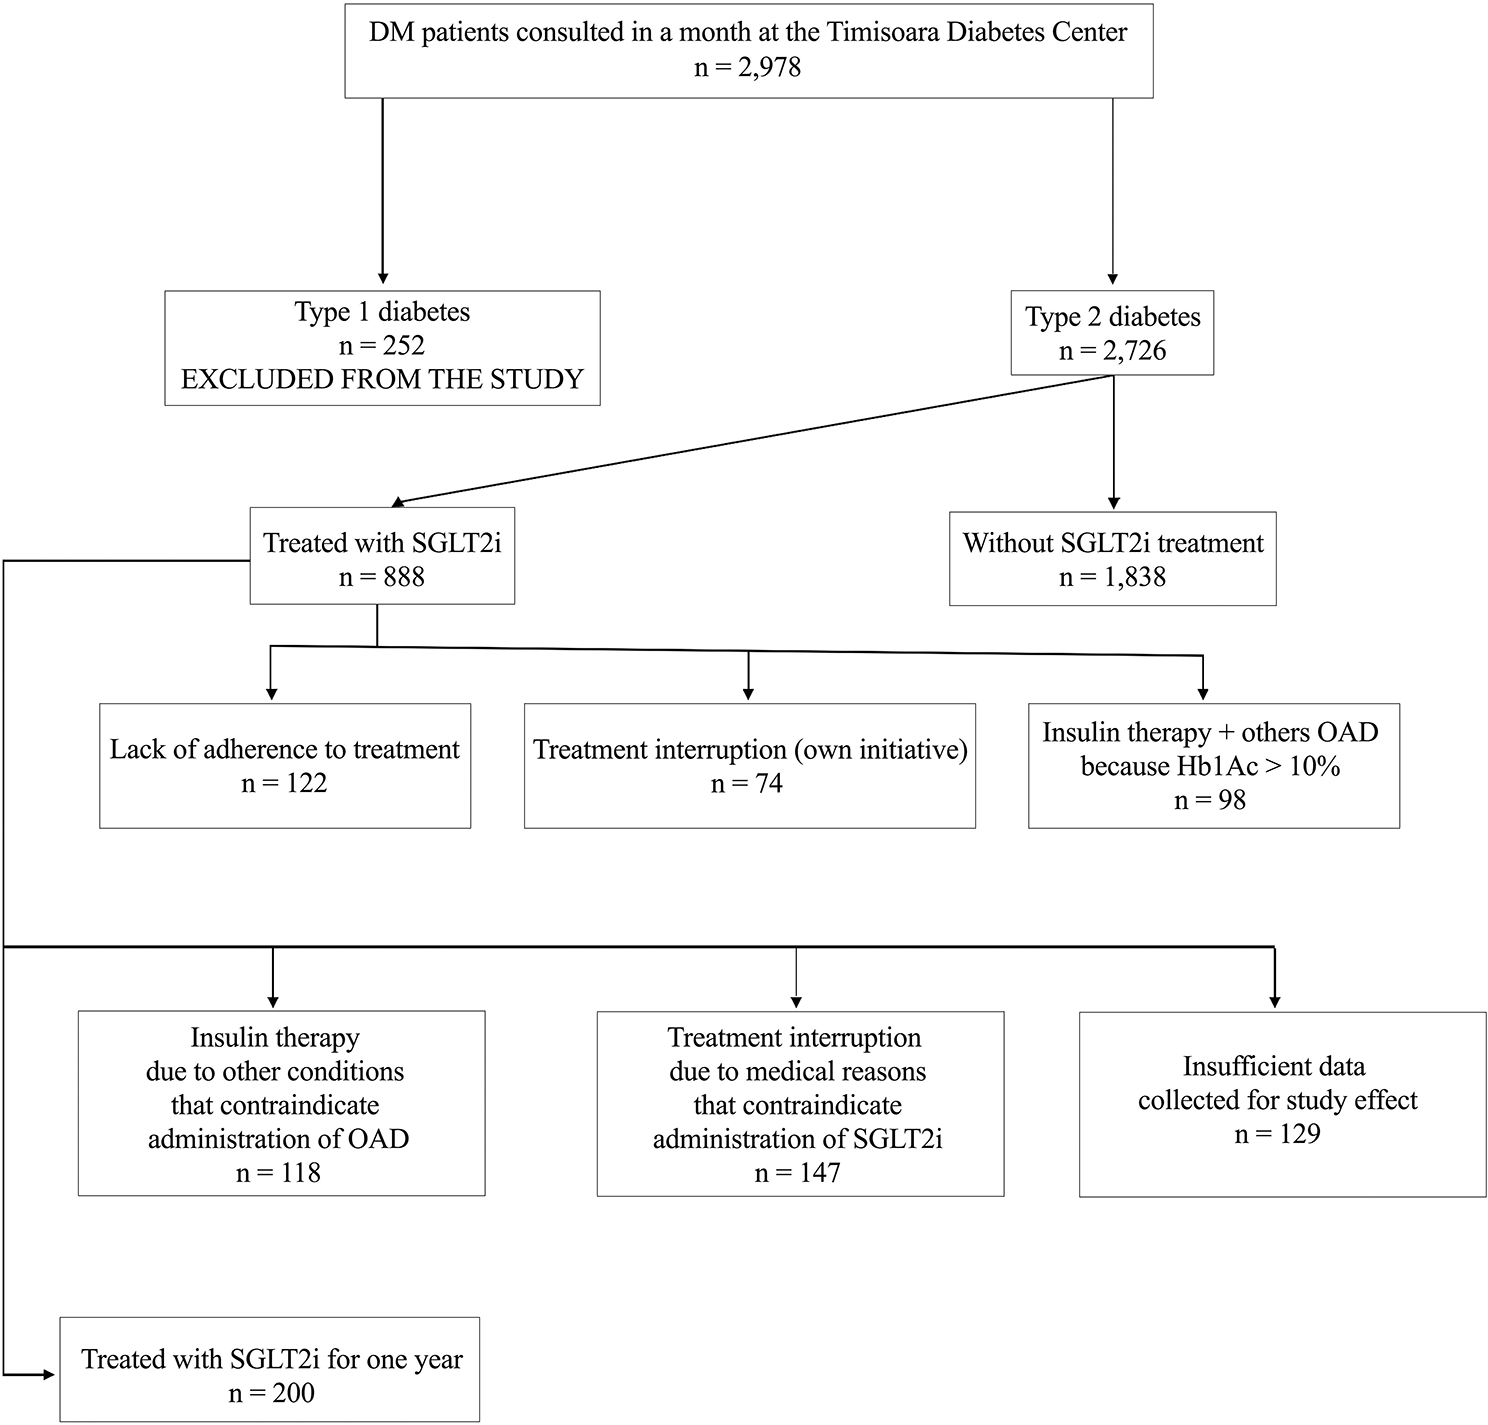
This was a retrospective cohort study conducted on adult patients who were hospitalized for HHC at a university hospital in Spain from June 2014 to October 2023. All the patients included fulfilled HHC criteria on admission, as adapted from previous criteria [1, 2, 8]: blood glucose > 1000 mg/dL, or blood glucose > 500 mg/dL and plasma osmolality ≥ 315 mOsm/kg. Among the patients with HHC, those with metabolic acidosis (pH ≤ 7.30 and bicarbonate ≤ 18 mEq/L) with positive ketonemia (point-of-care β-hydroxybutyrate levels ≥ 3 mmol/L) or, failing that (n = 4), positive ketonuria (≥ 3 + intensity), were considered to have hyperosmolar DKA. The remaining patients with HHC were considered to have pure HHS [1, 2, 8, 27]. Given that all the patients were admitted for symptomatic hyperglycemia ≥ 200 mg/dL, all patients had a diagnosis of diabetes on admission [28]. Patients were classified as having T1DM, T2DM, or diabetes secondary to pancreatic disease according to the American Diabetes Association (ADA) criteria [28]. All patients admitted with hyperosmolar DKA were tested for pancreatic autoimmunity and/or C-peptide to differentiate T1DM from T2DM [28].
We reviewed hospital admissions between June 2014 and December 2015 coded as 249.1, 250.1, 249.2, and 250.2; admissions between January 2016 and October 2023 coded as E08.1, E09.1, E10.1, E11.1, E13.1, E08.0, E09.0, E11.0, and E13.0; and all Endocrinology admissions between June 2014 and October 2023. The search identified 174 adults who met the above-mentioned criteria for HHC. For patients admitted more than once for HHC, the first admission meeting HHC criteria was selected. Four patients were excluded from the study because they received insulin therapy for less than 24 h due to death during the first hours after admission, thus having a very short exposure time to insulin therapy for hypoglycemia onset. A total of 170 patients (82 [48.2%] men, median age 72 years, range 19–98 years) met the criteria and were included in the study.
Consensus recommendations for the treatment of HHC were followed for all patients: first an IIITP, then transition to a LSITP when the clinical situation allowed [1]. Seven patients died during the IIITP, without receiving subcutaneous insulin. The hospital's standard protocol for monitoring glycemic control in patients admitted for HHC involves taking 5–10 capillary blood glucose measurements per day.
Main determinationsOutcomesIn-hospital hypoglycemia
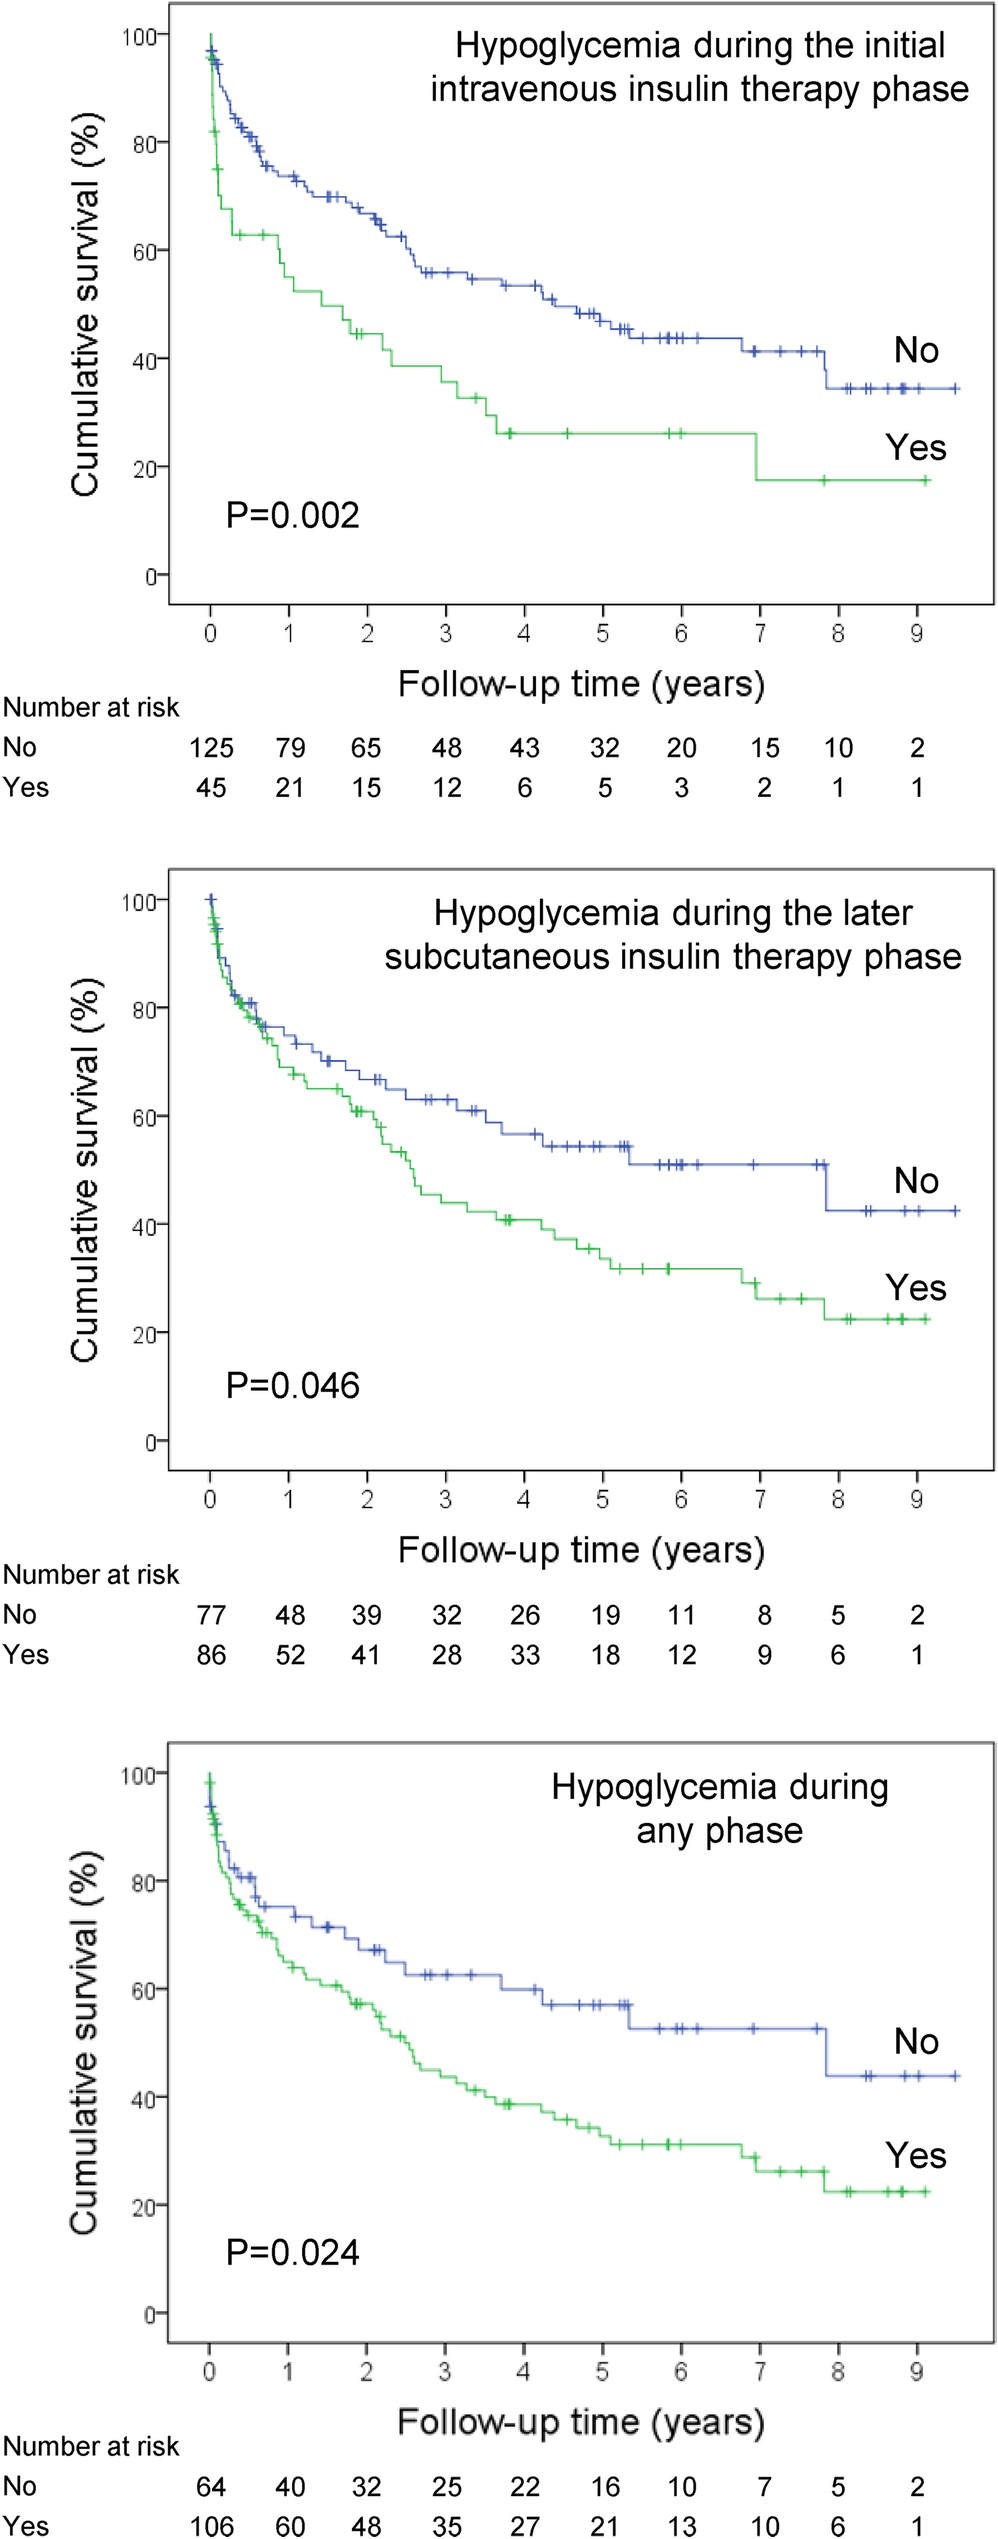
A patient was considered to have hypoglycemia when he/she had at least 1 capillary blood glucose determination of ≤ 69 mg/dL during hospitalization. According to the ADA classification [22], level 1 hypoglycemia was defined as a blood glucose level between 54 and 69 mg/dL, and level 2 hypoglycemia was defined as a blood glucose level < 54 mg/dL. The total days of hospitalization with at least 1 determination in the hypoglycemia range were recorded; based on these data, the percentage of hospitalization days with hypoglycemia was calculated, using the total duration of hospitalization as the denominator.
In-hospital hypoglycemia during the IIITP
A patient was considered to have had hypoglycemia during the IIITP if he/she had at least 1 capillary blood glucose determination of ≤ 69 mg/dL from the time of admission to the time of discontinuation of intravenous insulin therapy. For patients who experienced hypoglycemia during the IIITP, the lowest capillary glucose value recorded during that phase was registered.
In-hospital hypoglycemia during the LSITP
A patient was considered to have had hypoglycemia during the LSITP if he/she had at least 1 capillary blood glucose determination of ≤ 69 mg/dL from the time of discontinuation of intravenous insulin therapy (i.e., the beginning of the subcutaneous insulin therapy) until discharge from the hospital. For patients who experienced hypoglycemia during the LSITP, the lowest capillary glucose value recorded during that phase was registered.
Length of hospital stay
It was calculated as the number of days elapsed from the date of admission to the date of discharge.
Metabolic control after hospital discharge
Follow-up glycated hemoglobin (HbA1c) was the first available determination after hospital discharge, provided that at least 2 months and no more than 12 months had elapsed after discharge. A patient was considered to have good glycemic control at discharge if he/she had a follow-up HbA1c < 7% [22].
In-hospital and long-term mortality
Mortality during hospitalization was recorded. Long-term all-cause mortality was also registered using the electronic clinical record, which registers all patient contacts with the public health system (including hospital admissions and consultations, primary care visits, and mortality). Follow-up was extended until January 2024. Survival was calculated from the day of hospital admission until death or until the last reliable contact with the health system to account for possible misclassification due to change of address. Median follow-up was 652 days (range 2–3460 days).
Covariates
The following variables were registered from each patient: age, sex, serum glucose on admission, serum osmolality on admission (if not determined, it was calculated by using the following formula: Sodium [in mEq/L] × 2 + Glucose [in mg/dL]/18 + Urea [in mg/dL]/6), serum potassium on admission (a patient was considered to have hypokalemia if serum potassium levels were ≤ 3.5 mmol/L, and hyperkalemia if potassium levels were ≥ 5.5 mmol/L), glomerular filtration rate on admission (calculated from serum creatinine levels applying the CKD-EPI formula) [29], body mass index (BMI), pre-existing diagnosis of diabetes prior to admission (as per the ADA criteria) [28], previous ambulatory treatment with insulin, baseline HbA1c value (obtained during hospitalization or, failing that, the most recent value available in the previous year), Charlson Comorbidity Index (CCI, an estimator that includes age, baseline glomerular filtration rate, previous history of diabetes, myocardial infarction, heart failure, peripheral vascular disease, cerebrovascular accident, hemiplegia, dementia, chronic obstructive pulmonary disease, connective tissue disease, acquired immunodeficiency syndrome, peptic ulcer disease, liver disease, solid tumor, leukemia, and lymphoma) [30], admission to an intensive care unit (ICU), presence of a probable infection (a patient was considered to have a probable infection if he/she had a fever or received antibiotic treatment during hospitalization), international units (IU) of intravenous insulin received in the first 24 h of admission, duration (hours) of the IIITP, IU of subcutaneous insulin received in the first 24 h of the LSITP, and other treatments received during hospitalization (oral or intravenous corticosteroids, sulfonylureas, meglitinides, metformin, dipeptidyl peptidase-4 inhibitors, sodium-glucose cotransporter-2 inhibitors, glucagon-like peptide-1 agonists, and thiazolidinediones).
Statistical analyses
We employed the chi-squared test to compare proportions, the Mann–Whitney test to compare numerical data between independent groups, and Spearman’s rank test to evaluate correlation. We employed Kaplan–Meier curves for the assessment of long-term mortality rates according to hypoglycemia during admission, and the log-rank test for between-group comparisons. Cox regression (proportional hazards regression) was used for multivariate analysis of survival during follow-up. Logistic regression was used for multivariate analyses of factors associated with mortality risk at a given time point. In those models, age was entered in years, CCI in points, and IIITP duration in hours. Age was not factored into the models including the CCI because age is a component of this index. The remaining variables were entered into the models as binary (yes/no), including sex (reference category, female), infection (reference category, no), HHC variant (reference category, hyperosmolar DKA), and form of hypoglycemia during hospitalization (reference category, no). Covariates were forced to enter the equation in all multivariate models. The proportional hazards assumption was checked using statistical tests and graphical diagnostics based on the Schoenfeld residuals. All tests were 2-tailed. P-values lower than 0.05 were considered statistically significant.


留言 (0)