
記住我

See Table 1 for participant characteristics; n = 30 participants, median age 76.5 years (range 70–83 years), 72.2% male, n = 26 (76.9%) lived with a partner, were frail (mean Rockwood 4.1), with multiple conditions (mean Charlson comorbidity index score 8.1). Most common diagnoses were upper gastrointestinal (33.3%) and lung cancers (26.7%), with over half (59%) having localised disease.
Table 1 Participant demographics and clinical characteristics.Feasibility of screeningScreening questions had minimal missing data (0.55%). Completion rates were high for all biochemical markers (66.7–100%) and most anthropometric measures (height, weight, body mass index (BMI) (96.7%), midarm circumference (93.3%), and hand-grip strength (86.7%)). Chair-stand test (33.3% complete), timed up and go test (30.8%), and bioelectrical impedance analysis (BIA) (41.7%) completion were low, with participants declining or unable to complete these measures.
Condition prevalence and overlapPrevalence of malnutrition, sarcopenia and cachexia varied by screening tool or diagnostic criteria. For the malnutrition screening tools, prevalence varied between 39.3% (MUST) and 43.3% (3-MinNS) for severe risk of malnutrition, and 53.6% (MUST) to 76.7% (PG-SGA) for moderate to severe risk. For cachexia, prevalence was between 55.5% (MCASCO) and 56.7% (Fearon criteria), and sarcopenia, 48.2% (EWGSOP2) to 66.7% (SARC-F).
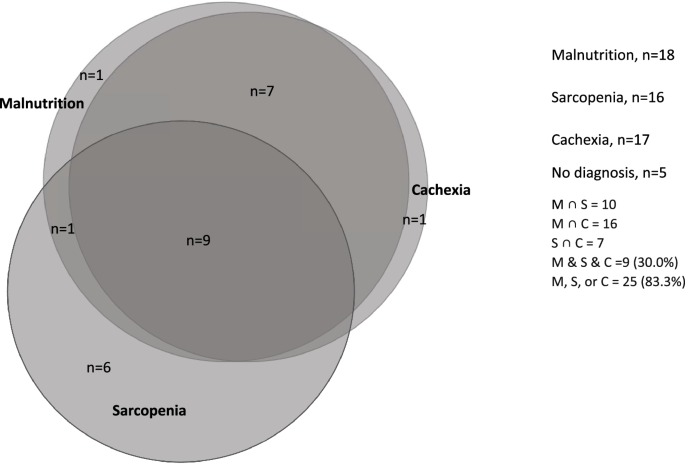
In total, 83.3% of participants were identified as having at least one of the three conditions, of which, 26.7% were identified as having only one condition, 30.0% were identified as having all three conditions (Fig. 1).
Fig. 1: Venn diagram of the overlap of malnutrition, sarcopenia, and cachexia.
The figure illustrates the overlap of each of the three conditions, with 83.3% of participants (n = 25) identified as having at least one of the three conditions. With this, 26.7% (n = 8) were identified as having only one of the conditions, 56.7% (n = 17) with two or more, and 30.0% (n = 9) were identified as having all three conditions. ∩ = intersection.
Of those who had localised disease (n = 16), n = 5 (31.3%) had evidence of severe malnutrition, n = 6 (37.5%) had evidence of sarcopenia, and n = 9 (50%) had evidence of cachexia.
A statistically significant overlap was seen between severe malnutrition and cachexia (OR: 28.8 [95% CI: 2.91–284.76], p = 0.004). When including moderate and severe risk of malnutrition, this relationship remained highly significant (OR: 88 [95% CI: 7.08–1094], p = <0.0001). No statistically significant relationships were seen between malnutrition and sarcopenia (OR 1.8 [95% CI: 0.41–7.81] p = 0.433), or between sarcopenia and cachexia (OR: 0.96 [95% CI: 0.23–4.10], p = 0.961).
Looking at baseline clinical characteristics, a strong positive relationship was seen between Timed Up and Go and Skeletal Muscle Index (correlation 0.8554, p = 0.0141), BMI and mid-arm circumference (correlation 0.785, p = <0.0001), and Charlson Comorbidity Index score and chair stand test (correlation 0.788, p = 0.0068). Moderate positive relationship was seen between Rockwood score and timed up and go (correlation 0.697, p = 0.0368).
Streamlining screeningResults of earlier systematic reviews [8, 31], alongside qualitative findings, were used to identify potential predictor variables for the univariate analysis. Table 2 displays odds ratios from univariate logistic regression analysis, of variables predicting each of the three conditions, with Bonferroni corrections also presented. BMI was a statistically significant predictor (OR: 0.78, [95% CI: 0.61–0.98], p = 0.04) of malnutrition, as were percentage meal consumption (OR: 2.28 [95% CI: 1.24–4.19], p = 0.008), appetite (OR: 2.21 [95% CI: 1.16–4.20], p = 0.015), and sunken temples (OR 8.43 [95% CI: 1.9–37.3], p = 0.005). Following a Bonferroni correction for multiple testing, only sunken temples remained significant.
Table 2 Univariate logistic regression of candidate predictors of key patient characteristics.Appetite (OR: 1.85 [95% CI: 1.01–3.39], p = 0.048) and percentage monthly weight loss (OR: 8.71 [95% CI: 1.87–40.60] p = 0.006), were significant predictors of cachexia, with percentage monthly weight loss remaining significant after multiple correction.
When predicting sarcopenia, both hand-grip strength (OR 0.75 [95% CI: 0.60–0.94], p = 0.015), with an approximate 25% decrease odds for every 1 kg increase in hand-grip strength, and Rockwood score (OR 2.94 [95% CI: 1.26–6.89] p = 0.013) were statistically significant predictors in univariate analysis, but did not remain significant following Bonferroni correction.
Qualitative findingsEight participants (75% male, median age 75 years), participated in interviews. Four major themes were generated; (1) Dissonance, a misalignment, or disagreement, in participants’ beliefs, and contradictions in their views and opinions regarding the role, and impact of the three conditions, (2) Diagnostic overshadowing was seen when symptoms relating to these conditions were attributed to the cancer or its treatment, or other issues, (3) Between a rock and a hard place, nutrition and physical function remained overlooked until weight loss impacted upon treatment options, however participants faced difficulties having concerns heard, and (4) Study screening was seen as a positive intervention and a gateway to help, but screening was often not conducted, or acted upon. Summarised in Table 3. Full details of the thematic analysis will be presented elsewhere.
Table 3 Main themes, sub-themes and data codes.Following thematic analysis, to gain a deeper understanding of the role of the three conditions in a patient’s health pathway and further understand their experiences and how any issues could be addressed, a loop analysis, to investigate relationships between themes, was undertaken and presented here.
Feedback loopsThree loops were generated from the qualitative thematic analysis. Figure 2 maps the relationships between themes, and the positive and negative feedback loops which influenced patients’ views and experiences.
Fig. 2: Feedback loop diagram illustrating interlinking themes of the views and experiences of malnutrition, sarcopenia, and cachexia in older adults with cancer.
Loop 1: impact of misunderstanding, Loop 2: ending in a ‘rock and a hard place’, and Loop 3: the role of screening for malnutrition, sarcopenia, and cachexia. Loop 1 negatively impacts upon each of the associated themes (perceptions of risk, dissonance), which, alongside the impact of diagnostic overshadowing (loop 2)—both by patients and clinicians, terminates in patients being trapped between ‘a rock and a hard place’. However, screening for malnutrition, sarcopenia, and cachexia presented a possible solution to this (loop 3).
Loop one: impact of misunderstandingA lack of knowledge by participants regarding malnutrition, sarcopenia, and cachexia, and their causes and consequences, affected perceptions of risk of developing these problems. The assumed impact of the conditions on personal health was often minimised. This was despite acknowledgement that nutritional and functional problems may cause negative effects in others e.g., poorer health, reduced quality of life. Low perception of risk continued, despite nutritional and functional problems being viewed as a normal part of the cancer journey, and an expected part of ageing—exposing a dissonance in participants’ beliefs regarding nutrition and physical function, fuelled by a misunderstanding of the aetiology and potential severity of these conditions.
Loop two: ending in a ‘rock and a hard place’Low perception of risk of developing these conditions was contributed to by diagnostic overshadowing [32]—with clinicians perceived as downplaying or disregarding concerns participants had regarding nutrition or physical function. Problems e.g., weight loss, were attributed the cancer, its treatment, other health problems, or ageing, by both patients, and in patients’ perceptions, by their clinicians, therefore were seen as expected, normalised and therefore disregarded. This disregarding of symptoms by clinicians confirmed to participants that these issues were minor, and therefore posed little risk to their health.
A belief that past positive health behaviours e.g., following a ‘healthy’ diet, or staying ‘active’, were protective against any future nutrition or functional problems, which was reinforced when participants received inadequate or unhelpful ‘generic’ nutrition or physical activity advice. Finally, the emotional, physical, and mental burdens that resulted from a cancer diagnosis were prioritised by participants over nutritional and/or physical function problems.
This overshadowing and misperception of risk, caused conflict when participants eventually became concerned with these problems. The ‘tipping point’ into concern appeared to be when visual changes e.g., rapid weight loss, or poor physical function were noticed, or endangered their chances of receiving anti-cancer treatments. This left participants at an impasse; realising their predicament with nowhere to turn to have their concerns addressed.
Loop three: the role of screening for malnutrition, sarcopenia and cachexiaAssessments for these conditions, completed as part of this study, were seen as acceptable. Screening presented an opportunity for participants to consider and raise concerns regarding their nutrition or physical function, in an environment where their concerns would not be disregarded or minimised. Screening could also be seen as an intervention in itself, with physical tests of function reassuring participants that they were able to complete basic movements. This suggested screening could act as an opportunity to positively affect each aspect of the loop diagram; with screening providing an opportunity to educate patients on these conditions, and provide an outlet for those worried but where their concerns had been overshadowed, as concerns regarding nutrition and physical function were actively sought and addressed. However, participant receptiveness to advice was affected by self-belief in current health; with confidence in past health behaviours and attributes preventing participants from believing screening is required.
留言 (0)