
記住我

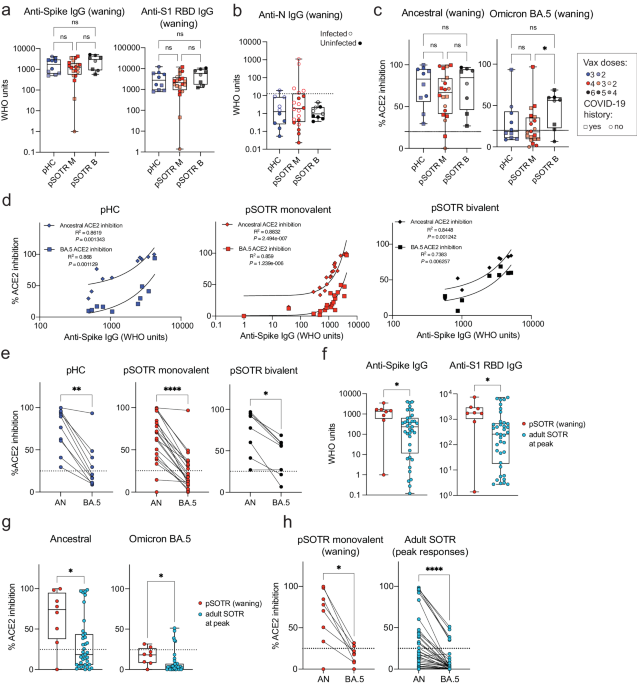
Humoral responses were evaluated in pHCs and pSOTRs who received the ancestral monovalent vaccines only (pSOTR M) after approximately 200 days and pSOTR bivalent recipients (pSOTR B) after 300 days post-vaccination, just before the time at which boosting has been recommended for older adults and adult SOTRs due to waning immunity. The pSOTR M group received, on average one additional mRNA vaccine dose compared to pHCs (median three vs. two doses, respectively), while pSOTR B group received on average five mRNA vaccines, including the bivalent dose (Supplementary Table 1). Anti-S immunoglobulin (Ig)-G and anti-S1 receptor binding domain (RBD) IgG titers were not significantly different between pHCs and pSOTR groups (Fig. 1a). Interestingly, despite a previously documented infection in 11 (55%) pSOTR M, four (44%) pSOTR B, and five (50%) pHC participants, we observed no detectable anti-nucleocapsid (N) IgG in most individuals (Fig. 1b). While failure to acquire anti-N IgG following infection in children has not been reported, this is consistent with what has been observed in adults who were infected following vaccination22.
Fig. 1: Pediatric solid organ transplant recipients with an extra dose of ancestral monovalent vaccine do not exhibit significantly different humoral responses from their healthy siblings.
a Anti-S and anti-S1 RBD IgG titers in pHCs (n = 10) and pSOTR monovalently vaccinated (M) (n = 20) at approximately 6 months (180 days) since last vaccination and pSOTRs who received the bivalent dose (B) (n = 8) 300 days post-vaccination. Squares denote individuals with history of COVID-19, circles represent no history of COVID-19. Darker shades of color indicate more vaccines received. Kruskal–Wallis test, ns = not significant. b Anti-nucleocapsid IgG titers. The WHO cutoff of 12.3 units (positivity for natural infection) is depicted by dotted line. Filled circles represent individuals with self-reported or documented SARS-CoV-2 infection. c Percent ACE2 binding inhibition of ancestral strain and Omicron BA.5. Squares denote individuals with history of COVID-19, circles represent no history of COVID-19. Darker shades of color indicate more vaccines received. Kruskal–Wallis tests, *p < 0.05. The dotted line represents 25% ACE2 inhibition (limit of detection). d Correlations between anti-S IgG titers and ACE2 binding inhibition of ancestral strain and Omicron BA.5. e Matched pair percent ACE2 binding inhibition of ancestral strain vs. Omicron BA.5 for each individual within the groups. Wilcoxon matched-pairs rank test, *p < 0.05, **p < 0.01, ***p < 0.001, ****p < 0.0001. f Anti-S and anti-S1 RBD IgG titers in pSOTR (n = 8) six months since last vaccination and adult SOTRs (n = 38) at peak vaccine responses (day 14). Mann–Whitney test, *p < 0.05. g Percent ACE2 binding inhibition of ancestral strain and Omicron BA.5 in pSOTRs (n = 8) and adult SOTRs (n = 38). Mann–Whitney tests, *p < 0.05. The dotted line represents 25% ACE2 inhibition (limit of detection). h Matched pair percent ACE2 binding inhibition of ancestral strain vs. Omicron BA.5 in pSOTRs (n = 8) and adult SOTRs (n = 38). Wilcoxon matched-pairs rank test, *p < 0.05, ****p < 0.0001. In (a–c, f, g), boxplots were used to summarize data (median, 1st–3rd quartiles (IRQ), whiskers represent minimum and maximum values).
To assess antibody functionality, we measured percent angiotensin-converting enzyme 2 (ACE2) binding inhibition of the SARS-CoV-2 ancestral strain and Omicron BA.5 as a surrogate of neutralizing antibody function. This assay was previously validated in adult SOTRs23,24 and strongly correlated with live virus-neutralizing antibody titers in transplant recipients. Inhibition of the ancestral strain and BA.5 following monovalent vaccination was not significantly different between pSOTRs and pHCs; however, the pSOTR B group continued to exhibit slightly enhanced inhibition of Omicron BA.5 ten months post-vaccination (Fig. 1c). Although anti-S IgG titers positively correlated with ACE2 inhibition of both ancestral strain and Omicron BA.5 for all groups, there was a significant decrease in BA.5 surrogate neutralization compared to the ancestral strain, especially in monovalently vaccinated pHCs and pSOTRs (Fig. 1d, e).
Next, we compared antibody responses between pSOTR six months post-vaccination to 38 adult SOTRs two weeks post-third mRNA COVID-19 vaccine dose (i.e., peak response). To minimize heterogeneity, this analysis included only pSOTRs and adult SOTRs who were previously uninfected and who received three mRNA ancestral monovalent doses. pSOTRs six months post-vaccination exhibited significantly higher IgG titers (Fig. 1f) and greater neutralization capacity (Fig. 1g) compared to adult SOTRs at peak vaccine responses. Comparing percent inhibition of ancestral and Omicron BA.5 protein binding to ACE2 in the same individuals demonstrates that pSOTR and adult SOTRs had significantly lower BA.5 surrogate neutralization versus ancestral strain (Fig. 1h). Collectively, these data indicate that an additional mRNA vaccine dose in pSOTRs induced comparable IgG titers and neutralization capacity compared to immunocompetent children and that, despite waning, pSOTRs had significantly enhanced antibody responses six months post-vaccination compared to adult SOTRs at peak vaccine responses. Additionally, bivalent doses enhanced neutralization capacity against Omicron BA.5 in pSOTRs.
Bivalent boosting improves vaccine-induced antibody responses to both the ancestral and Omicron BA.5 variantsAs anticipated, anti-S IgG antibody levels in pSOTRs significantly increased after the bivalent vaccination (day 14) compared to pre-vaccination (day 0), followed by a decline in responses approximately ten months later (day 300) (Fig. 2a). Given that monovalent vaccination was discontinued, it was not possible to determine if the same effect would be observed if the additional dose were not a bivalent vaccine. Three individuals in the bivalent group had matched pre- and post-bivalent dose samples. Anti-S IgG titers increased for all three, and anti-S1 RBD IgG titers increased for two out of the three individuals at day 14, before decreasing again at six months post-vaccination (Fig. 2b). Bivalently boosted pSOTRs also displayed a high capacity to neutralize both the ancestral strain and Omicron BA.5 at day 14 (Fig. 2c) in the surrogate neutralization assay. The three pSOTRs with matched pre- and post-bivalent dose samples all demonstrated a significant increase in ACE2 inhibition following the bivalent boost, especially for the BA.5 subvariant (Fig. 2d), including the child who did not demonstrate globally increased antibody titers (Fig. 2b, green star). Additionally, at day 14, bivalent recipients exhibited robust ACE2 binding inhibition of other Omicron subvariants, including BA.1, BA.2.75, BA.4.6, BF.7, and the more recently circulating BQ.1.1, BQ.1, and XBB.1, that was not significantly different from that of BA.5 surrogate neutralization (Fig. 2e). Importantly, no individuals had neutralizing capacity below the 25% ACE2 binding inhibition cutoff (previously shown to be specific for the presence of live-virus neutralization in SOTRs), suggesting overall excellent performance against Omicron subvariants. This suggests that not only are pSOTRs capable of effectively neutralizing Omicron BA.5, but also that an additional dose may help to protect this population from newly emerging SARS-CoV-2 variants. Ten months post-bivalent dose, pSOTRs exhibited decreased neutralizing capacity for every Omicron subvariant tested, with approximately half of individuals staying above the 25% cutoff (Fig. 2e). Lastly, while there was a positive correlation between anti-S IgG titers and ACE2 inhibition for both the ancestral strain and Omicron BA.5, decreased BA.5 inhibition was observed compared to the ancestral strain (Fig. 2f, g). Together, these findings provide evidence that either bivalent boosting or an additional mRNA vaccine dose significantly enhances antibody responses in pSOTRs, including increased total anti-SARS-CoV-2 IgG titers and improved surrogate neutralizing capacity against the ancestral strain, Omicron BA.5 and other variants of concern. However, anti-SARS-CoV-2 IgG titers and neutralizing capacities wane by ten months post-vaccination, suggesting that additional boosting might be beneficial in this population.
Fig. 2: Bivalent boosting improves vaccine-induced antibody responses to both the ancestral strain and Omicron BA.5 and wane over time.
a Anti-S and anti-S1 RBD IgG titers in the pSOTR bivalent group at days 0 (D0; pre-bivalent) (n = 4), 14 (D14; peak responses) (n = 9) and 300 (D300; waning responses) (n = 8). Kruskal–Wallis test, *p < 0.05, **p < 0.01. Boxplots were used to summarize data (median, 1st–3rd quartiles (IRQ), whiskers represent minimum and maximum values). b Anti-S and anti-S1 RBD IgG titers at days 0, 14, and 300 since the bivalent vaccination in three individuals with matched plasma samples. c Percent ACE2 binding inhibition of ancestral strain and Omicron BA.5 in bivalent vaccine pSOTR recipients. Kruskal–Wallis tests, *p < 0.05, **p < 0.01, ***p < 0.001. The dotted line represents 25% ACE2 inhibition (limit of detection). Boxplots were used to summarize data (median, 1st–3rd quartiles (IRQ), whiskers represent minimum and maximum values). d Percent ACE2 binding inhibition of the ancestral strain and Omicron BA.5 at days 0, 14, and 300 since the bivalent vaccination in three individuals with matched plasma samples. e Percent ACE2 binding inhibition of the ancestral strain and Omicron variants of concern (VOC) in bivalent dose recipients at peak (left) and day 300 (right). A single individual was infected between days 14 and 300 (red circles). Boxplots were used to summarize data (median, 1st–3rd quartiles (IRQ), whiskers represent minimum and maximum values). f Correlations between anti-S IgG titers and ACE2 binding inhibition of ancestral strain and Omicron BA.5 at peak responses (see Fig. 1d for correlations at day 300). g Matched pair percent ACE2 binding inhibition of ancestral strain vs. Omicron BA.5 at days 0 and 14 (see Fig. 1e for day 300). Wilcoxon matched-pairs rank test, **p < 0.01.
Humoral responses in vaccinated uninfected and vaccinated infected individuals are not significantly differentAlthough 22% of the U.S. pediatric population has reported a positive COVID-19 test since the beginning of the COVID-19 pandemic, infection seroprevalence could be as high as 96%21,25. In this cohort, approximately 50% of participants in each group reported an infection (Supplementary Table 1). Given the frequency of pediatric infection in the U.S. and that little is known about SARS-CoV-2 vaccine immunity in pSOTRs since the Omicron variant emerged, we stratified antibody responses by COVID-19 infection status (Supplementary Table 1).
One individual in the pSOTR group had COVID-19 twice and one of the infections occurred when Omicron BA.5 was circulating. All other study participants were infected between May 2021 and June 2022 (i.e., before Omicron BA.5 became the dominant variant in the U.S.). There were no significant differences in total IgG titers and ancestral or BA.5 surrogate neutralization between vaccinated uninfected and vaccinated infected individuals within each group (Supplementary Fig. 1a, b). This suggests that the antibody results likely reflect vaccine-induced rather than infection-induced or hybrid immune responses.
S-specific CD4 T+ cells in immunocompetent children produce more interferon-γ compared to pediatric solid organ transplant recipientsTo examine S antigen-specific T cells induced by ancestral monovalent vaccination and vaccination plus infection, participant PBMCs were stimulated with overlapping ancestral (W.1) and Omicron BA.4/5 S protein peptides. Subsequently, the production of interferon (IFN)-γ, tumor necrosis factor (TNF), interleukin (IL)-2, and IL-21 cytokines was assessed by flow cytometry (Fig. 3a, b). As with antibody responses, no significant differences in CD4+ T-cell responses were observed between uninfected vaccinated participants and those vaccinated and previously infected (Supplementary Fig. 2). In contrast to the antibody responses, pSOTRs and pHCs vaccinated with monovalent mRNA vaccines exhibited no significant differences in the frequency of CD4+ T-cell responses recognizing Omicron BA.5 epitopes compared to the ancestral strain (Fig. 3c). Interestingly, despite receiving one fewer vaccine dose on average than the pSOTR M group and more than two fewer doses on average than the pSOTR B group, pHCs demonstrated greater production of IFN-γ by S-specific CD4+ T cells in response to both ancestral and BA.4/5 peptides (Fig. 3d). This result remained significant after accounting for prior COVID-19 infection, immunosuppression (mycophenolate mofetil use), liver transplant history, age, number of vaccines received, and time between vaccination and sample collection (Supplementary Table 2). Production of other cytokines was not statistically significantly different between pSOTRs and pHCs six months post ancestral vaccination or pSOTRs ten months post bivalent dose. However, compared to three times vaccinated uninfected adult SOTRs at peak vaccine response26, three-times vaccinated and uninfected pSOTRs produced significantly more IFN-γ, IL-2, and TNF in response to ancestral S protein stimulation, and TNF in response to BA.4/5 S protein stimulation six months post-vaccination (Fig. 3e). In sum, while immunocompetent children produced significantly more IFN-γ in response to S peptide stimulation, pSOTRs showed comparable production of all other cytokines and greater production of most cytokines assessed six months post-vaccination compared to adult SOTRs at peak responses.
Fig. 3: S-specific CD4 T+ cells in immunocompetent children produce more interferon-γ compared to pediatric solid organ transplant recipients.
a Representative flow cytometry gating of cytokine-producing S-specific CD4+ T cells. b Representative cytokine production by S-specific CD4+ T cells unstimulated (baseline) or stimulated with ancestral (W.1) or Omicron BA.4/5 S protein peptides. c Cytokine production by S-specific CD4+ T cells in responses to ancestral and BA.4/5 S peptides in pSOTRs and pHCs vaccinated with monovalent mRNA COVID-19 vaccines. One-way ANOVA with Tukey correction, ns = not significant. d Frequencies of cytokine-producing S-specific CD4+ T cells in response to BA.4/5 or ancestral S peptide stimulation. Squares denote individuals with history of COVID-19, circles represent no history of COVID-19. Darker shades of color indicate more vaccines received. Two-way ANOVA with Tukey correction for multiple comparisons, **p < 0.01. An = ancestral strain. Boxplots were used to summarize data (median, 1st–3rd quartiles (IRQ), whiskers represent minimum and maximum values). e Frequencies of cytokine-producing S-specific CD4+ T cells in response to BA.4/5 or ancestral S peptides in pSOTRs (n = 8) six months since the last vaccine dose and adult SOTRs (n = 19) for which we had PBMC samples at peak vaccine responses (day 14). Two-way ANOVA with Tukey correction, *p < 0.05, **p < 0.01. An = ancestral strain. Boxplots were used to summarize data (median, 1st–3rd quartiles (IRQ), whiskers represent minimum and maximum values).
CD4+ T-cell responses are improved after bivalent boosting and maintain cross-reactivity against Omicron BA.5Bivalent boosting in pSOTRs enhanced CD4+ T-cell production of IFN-γ and TNF following ancestral S peptide stimulation compared to days 0 and 300, and IL-21 compared to day 300 (Fig. 4a). Similarly, bivalent recipients exhibited improved production of IFN-γ and TNF in response to BA.4/5 peptides compared to days 0 and 300 (Fig. 4a). This suggests that memory CD4+ T cells in pSOTRs can be boosted and successfully recalled following additional mRNA vaccine doses and/or the bivalent dose, but wane over time to pre-bivalent levels. Two out of three matched bivalent recipients exhibited increased CD4+ T-cell responses following bivalent boosting in response to both ancestral and BA.4/5 peptides (Fig. 4b, c). Interestingly, IFN-γ production increased in one individual in response to ancestral peptide, and two individuals in response to BA.4/5 peptides, however, neither had a reported SARS-CoV-2 infection between days 14 and 300 post-vaccination. There were no differences in the frequency of CD4+ T-cell responses recognizing ancestral and Omicron BA.4/5 epitopes in pSOTRs bivalent recipients at days 0, 14, and 300 (Fig. 4d). Overall, bivalent boosting in pSOTRs led to an enhanced cytokine production by CD4+ T cells at peak with conserved recognition of ancestral strain and BA.4/5 peptides. CD4+ T-cell cytokine production waned over time, which is in contrast with cytokine production observed in immunocompetent children after two to three doses of ancestral monovalent vaccines (Fig. 3).
Fig. 4: CD4+ T-cell responses are improved after bivalent boosting and maintain cross-reactivity against Omicron BA.5.
a Frequencies of cytokine-producing S-specific CD4+ T cells in response to BA.4/5 or ancestral S peptides at 0, 14, and 300 days post-bivalent vaccination. Two-way ANOVA with Tukey correction, *p < 0.05, **p < 0.01. An = ancestral strain. Boxplots were used to summarize data (median, 1st–3rd quartiles (IRQ), whiskers represent minimum and maximum values). b, c Cytokine production by S-specific CD4+ T cells in response to BA.4/5 or ancestral S peptides for three pSOTR individuals with matched PBMC samples at 0, 14, and 300 days post-bivalent vaccination. d Cytokine production by S-specific CD4+ T cells in responses to ancestral and BA.4/5 S peptides at days 0, 14, and 300 post-bivalent vaccination. One-way ANOVA with Tukey correction, ns = not significant.
CD8+ T-cell responses are low, including following bivalent boostingLive attenuated and viral vector-based vaccines have traditionally elicited strong CD8+ T-cell responses, which may offer additional protection independent of antibody responses27,28,29. Although mRNA vaccine-induced S-specific CD8+ T-cell responses in pSOTRs have not been comprehensively characterized, studies in adult SOTRs have reported limited CD8+ T-cell responses26,30. For both pSOTRs and pHCs, the overall frequency of cytokine producing CD8+ T cells upon stimulation with ancestral or Omicron BA.4/5 peptides remained low, often comparable to background (S peptide unstimulated) levels (Fig. 5a–c). Furthermore, at six months post bivalent dose, pSOTRs exhibited limited cytokine production by S-specific CD8+ T cells (Fig. 5c). Bivalent boosting slightly improved CD8+ T-cell production of IFN-γ and TNF at peak vaccine responses, but not significantly (Fig. 6a–d). Overall, cytokine production by CD8+ T cells was limited, demonstrating that mRNA COVID-19 vaccines induce more robust CD4+ than CD8+ T-cell responses in pediatric populations.
Fig. 5: CD8+ T-cell responses are low six+ months post-vaccination.
a Representative cytokine production by S-specific CD8+ T cells unstimulated (baseline) or stimulated with ancestral (W.1) or Omicron BA.4/5 S protein peptides. b Cytokine production by S-specific CD8+ T cells in response to ancestral and BA.4/5 S peptides in monovalently vaccinated pSOTRs and pHCs. One-way ANOVA with Tukey correction, ns = not significant. c Frequencies of cytokine-producing S-specific CD8+ T cells in response to BA.4/5 or ancestral S peptides. Two-way ANOVA with Tukey correction. An = ancestral strain. Boxplots were used to summarize data (median, 1st–3rd quartiles (IRQ), whiskers represent minimum and maximum values).
Fig. 6: Bivalent boosting does not improve CD8+ T-cell responses vaccine responses in pSOTRs.
a Frequencies of cytokine-producing S-specific CD8+ T cells in response to BA.4/5 or ancestral S peptides in pSOTRs at days 0, 14, and 300 post-bivalent dose. Two-way ANOVA with Tukey correction. An = ancestral strain. Boxplots were used to summarize data (median, 1st–3rd quartiles (IRQ), whiskers represent minimum and maximum values). b, c Cytokine production by S-specific CD8+ T cells in response to BA.5 or ancestral S peptides for three pSOTR individuals with matched PBMC samples at days 0, 14, and 300 post-bivalent dose. d Cytokine production by S-specific CD8+ T cells in response to ancestral and BA.4/5 S peptides in pSOTRs bivalent recipients at days 0, 14, and 300 post-bivalent dose. One-way ANOVA with Tukey correction, ns = not significant.
No significant difference in CD8+ T-cell responses in vaccinated uninfected and vaccinated and infected individualsEarly studies reported that SARS-CoV-2 infection induces robust CD8+ T-cell responses in adults31,32. Hence, we stratified CD8+ T-cell responses by previous history of COVID-19. Comparable to CD4+ T-cell and antibody results, CD8+ T-cell responses were not significantly different between those with and without a history of SARS-CoV-2 infection (Supplementary Fig. 3). Additionally, as mentioned previously, all cytokines tested were present in very low frequencies preventing trend evaluation in each group. These results further confirm that the responses we observed were induced mainly by vaccination and that S-specific CD8+ T-cell responses were low compared to CD4+ T-cell responses.
pSOTRs produce qualitatively different polyfunctional CD4+ T cells compared to pHCsPolyfunctionality is defined as the ability of T cells to produce more than one cytokine simultaneously and has been associated with protection in previous studies against other infections33,34. Due to overall low CD8+ T-cell responses (Figs. 5, 6), we evaluated polyfunctionality in CD4+ T cells only. Ancestral and BA.4/5 peptide stimulation induced no significant difference in overall frequencies of S-specific polyfunctional CD4+ T cells within each group (Fig. 7a). However, pHC participants demonstrated increased polyfunctionality in response to ancestral and BA.4/5 S peptide stimulation compared to the pSOTR groups (Fig. 7b, c), primarily due to increased simultaneous production of TNF and IFN-γ (category 6, purple). Additionally, S-specific CD4+ T cells in pHCs produced significantly more IFN-γ only (category 8, orange), while pSOTR CD4+ T cells produced more TNF only in response to both ancestral and BA.4/5 peptides (category 14, dark pink) (Fig. 7c). Together, these findings suggest that while pSOTRs produce polyfunctional CD4+ T cells in response to mRNA vaccination, they are qualitatively different compared to polyfunctional CD4+ T cells produced by immunocompetent children, and lack robust production of IFN-γ.
Fig. 7: pSOTRs produce qualitatively different polyfunctional CD4+ T cells compared to pHCs in response to vaccination.
a Ancestral and BA.4/5 peptide stimulation induced no significant differences in frequencies of polyfunctional CD4+ T cells in each group. Pie charts are broken down by the 15 cytokine combination categories. Arcs identify slices of the pie that express each specific cytokine. b Heatmap identifying absolute differences between groups for each category (1–15). c Frequencies of CD4+ T cells producing cytokine combinations in response to ancestral or BA.4/5 peptides. Two-way ANOVA with Tukey correction, *p < 0.05, **p < 0.01, ***p < 0.001, ****p < 0.0001. Error bars represent standard error of the mean.
Bivalent boosting improved CD4+ T-cell polyfunctionality in pSOTRsWe next assessed S-specific CD4+ T-cell polyfunctionality and whether an additional dose of vaccine could increase IFN-γ production by pSOTRs (Fig. 8). We did not observe significant differences in ancestral or BA.4/5-induced cytokine production (Fig. 8a), but overall polyfunctionality was significantly improved shortly after post-bivalent vaccination (Fig. 8b, c). Bivalent boosting primarily increased the frequency of CD4+ T cells simultaneously producing IL-2 and TNF (category 10, green) in response to BA.4/5 S peptides at peak responses. Additionally, the production of IFN-γ only (category 8, orange), IL-2 only (category 12, dark blue), and TNF only (category 14, dark pink) significantly increased at peak compared to prior and ten months post-bivalent boosting (Fig. 8b, c). In sum, bivalent boosting enhances IFN-γ production by CD4+ T cells 14 days post-vaccination, but not long-term, as seen in pHCs. Instead, bivalent doses in pSOTRs enhanced long-term TNF and IL-2 cytokine production (Figs. 7c, 8c).
Fig. 8: Bivalent boosting temporarily improved CD4+ T-cell polyfunctionality in pSOTRs.
a Cytokine production by CD4+ T cells in response to ancestral and Omicron BA.4/5 peptides at days 0, 14, and 300 post-bivalent vaccination. Pie charts depict the 15 cytokine combination categories. Arcs identify slices of the pie that express each specific cytokine. b Heatmap identifying absolute differences between groups for each category. c Frequencies of CD4+ T cells producing cytokine combinations in response to ancestral or BA.4/5 peptide stimulation. Two-way ANOVA with Tukey correction, *p < 0.05, **p < 0.01, ***p < 0.001, ****p < 0.0001. Error bars represent standard error of the mean.
Subsequently, we investigated whether CD4+ T-cell polyfunctionality differs in the nine pSOTR bivalent recipients depending on history of COVID-19 (Supplementary Fig. 4). While infected individuals tended to exhibit slightly increased production of IFN-γ (category 8) and TNF (category 14), no significant differences in cytokine production or polyfunctionality between individuals with or without previously documented SARS-CoV-2 infection were noted (Supplementary Fig. 4a, b), further indicating that the responses observed in this study are predominantly vaccine-induced.
pSOTRs generate metabolically active but qualitatively distinct CD4+ T cells following mRNA vaccinationWe then comprehensively evaluated phenotypic and functional markers of S-specific CD4+ T cells induced in response to ancestral and BA.4/5 peptides using high parameter flow cytometry. The panel includes 29 surface and intracellular markers designed to evaluate T-cell subsets, metabolism, activation, and exhaustion phenotypes (Supplementary Table 3). No significant differences in S-specific CD4+ T-cell phenotypes were observed between responses to the ancestral (Supplementary Fig. 5) and BA.4/5 peptides (Fig. 9). Therefore, the subsequent analysis represents the response to BA.4/5 peptide stimulation.
Fig. 9: pSOTRs generate metabolically active but qualitatively distinct CD4+ T cells following mRNA vaccination compared to pHCs.
a UMAP dimension reduction plot for each group. b Unsupervised clustering algorithm Xshift identified 8 clusters on the UMAP. c Heatmap of normalized mean fluorescent intensity (MFI) values of markers expressed in each cluster. d Frequency of clusters in each group. Two-way ANOVA with Tukey correction, *p < 0.05, **p < 0.01, ***p < 0.001, ****p < 0.0001. Error bars represent standard error of the mean. e MFI plots for significant clusters determined in (d), ungated clusters (gray) and bulk T cells (black).
The uniform manifold approximation and projection (UMAP) revealed significant differences in S-specific CD4+ T-cell phenotypes, especially between the transplant recipient groups and pHCs (Fig. 9a). The unsupervised clustering algorithm that uses k-nearest neighbors density estimation, Xshift35, was then applied, and identified eight distinct S-specific CD4+ T-cell clusters on the UMAP (Fig. 9b). The mean fluorescent intensities (MFIs) of markers expressed in each cluster are depicted in Fig. 9c. The frequencies of three clusters (6, 7, and 8) were statistically significantly different among the groups (Fig. 9d, e). Clusters 6 and 7 were enriched in the pHC group compared to the transplant recipient groups (Fig. 9d). Cells in these two clusters were metabolically active (GLUT1+, PD-1+), and expressed comparatively very high levels of IFN-γ (Fig. 9e). Cluster 7 cells were more polyfunctional than cluster 6 cells, expressing high frequencies of all four cytokines. Clusters 6 and 7 also expressed CD27 and CD28, consistent with a functional memory T-cell phenotype. Monovalently and bivalently vaccinated pSOTRs had the highest frequency of S-specific CD4+ T cells in cluster 8 (Fig. 9d, e). Cluster 8 cells expressed high levels of cytokines TNF and IL-2, but very little IFN-γ compared to other clusters (Fig. 9e). This is consistent with our polyfunctionality results in which pSOTR bivalent recipient CD4+ T cells co-expressed TNF and IL-2 (Fig. 8). Similar to clusters 6 and 7, cluster 8 cells expressed CD27, CD28, PD-1 and GLUT1, indicative of activated and functional memory T-cell phenotype.
We then applied the same analytical pipeline to cells from bivalent recipients prior to boosting, at peak and ten months post-vaccination. Again, no significant differences in S-specific CD4+ T-cell phenotypes were observed between responses to the ancestral (Supplementary Fig. 6) and BA.4/5 peptides (Fig. 10). The UMAP revealed slight differences in S-specific CD4+ T-cell phenotypes (Fig. 10a), especially expression of various cell markers on day 14 compared to days 0 and 300, and Xshift then identified seven S-specific CD4+ T-cell clusters on the UMAP (Fig. 10b). MFIs of markers expressed in each cluster are depicted in Fig. 10c. All seven clusters were present in comparable frequencies in each group (Fig. 10d).
Fig. 10: Bivalent boosting further promotes altered CD4+ T-cell phenotype in pSOTRs.
a UMAP dimension reduction plot for each group. b Unsupervised clustering algorithm Xshift identified 7 clusters on the UMAP. c Heatmap of normalized mean fluorescent intensity (MFI) values of markers expressed in each cluster. d Frequency of clusters in each group. Two-way ANOVA with Tukey correction, all not significant. Error bars represent standard error of the mean.
Overall, our analysis of S-specific CD4+ T cells induced in response to BA.4/5 peptide stimulation suggests that despite immunosuppression, pSOTR recipients can generate metabolically active S-specific CD4+ T cells that are qualitatively distinct, primarily producing TNF and IL-2, less IL-21 and very little IFN-γ relative to pHCs. T cells of this phenotype were enhanced following bivalent vaccination, demonstrating that bivalent vaccination did not result in a higher proportion of T cells producing IFN-γ. This is distinct from CD4+ T cells generated in pHCs that were also metabolically active but mostly produced IFN-γ. Since monovalent pSOTR recipients produce similar frequencies of IFN-γ-producing CD4+ T cells as bivalent recipients, we hypothesize that immunosuppressive regimens alter the S-specific CD4+ T-cell compartment rather than that IFN-γ production is associated with fewer vaccine doses.
Spike-specific CD4+ T-cell proliferation correlates with cytokine production in healthy children but not pSOTRsFinally, we performed T-cell proliferation assay to further assess T-cell responses following vaccination (Fig. 11a). Cell trace violet dye-labeled PBMCs were cultured for five days in the presence of ancestral S peptides to drive the proliferation of S-specific T cells. Individuals who received bivalent vaccination exhibited the highest proliferation 14 days post-vaccination, as expected (Fig. 11b, c). Surprisingly, the pHC and pSOTR groups showed comparable S-specific T-cell proliferation at the time of waning immunity, potentially because children generally require lower doses of immunosuppressive regimes compared to adults. Interestingly, S-specific CD8+ T cells exhibited remarkable proliferation despite limited cytokine production. We then correlated CD4+ T cells proliferation with cytokine production and found a strong correlation between cytokine production and CD4+ T-cell proliferation in healthy children, but this correlation was not observed in pSOTRs (Fig. 11d). This
留言 (0)