
記住我


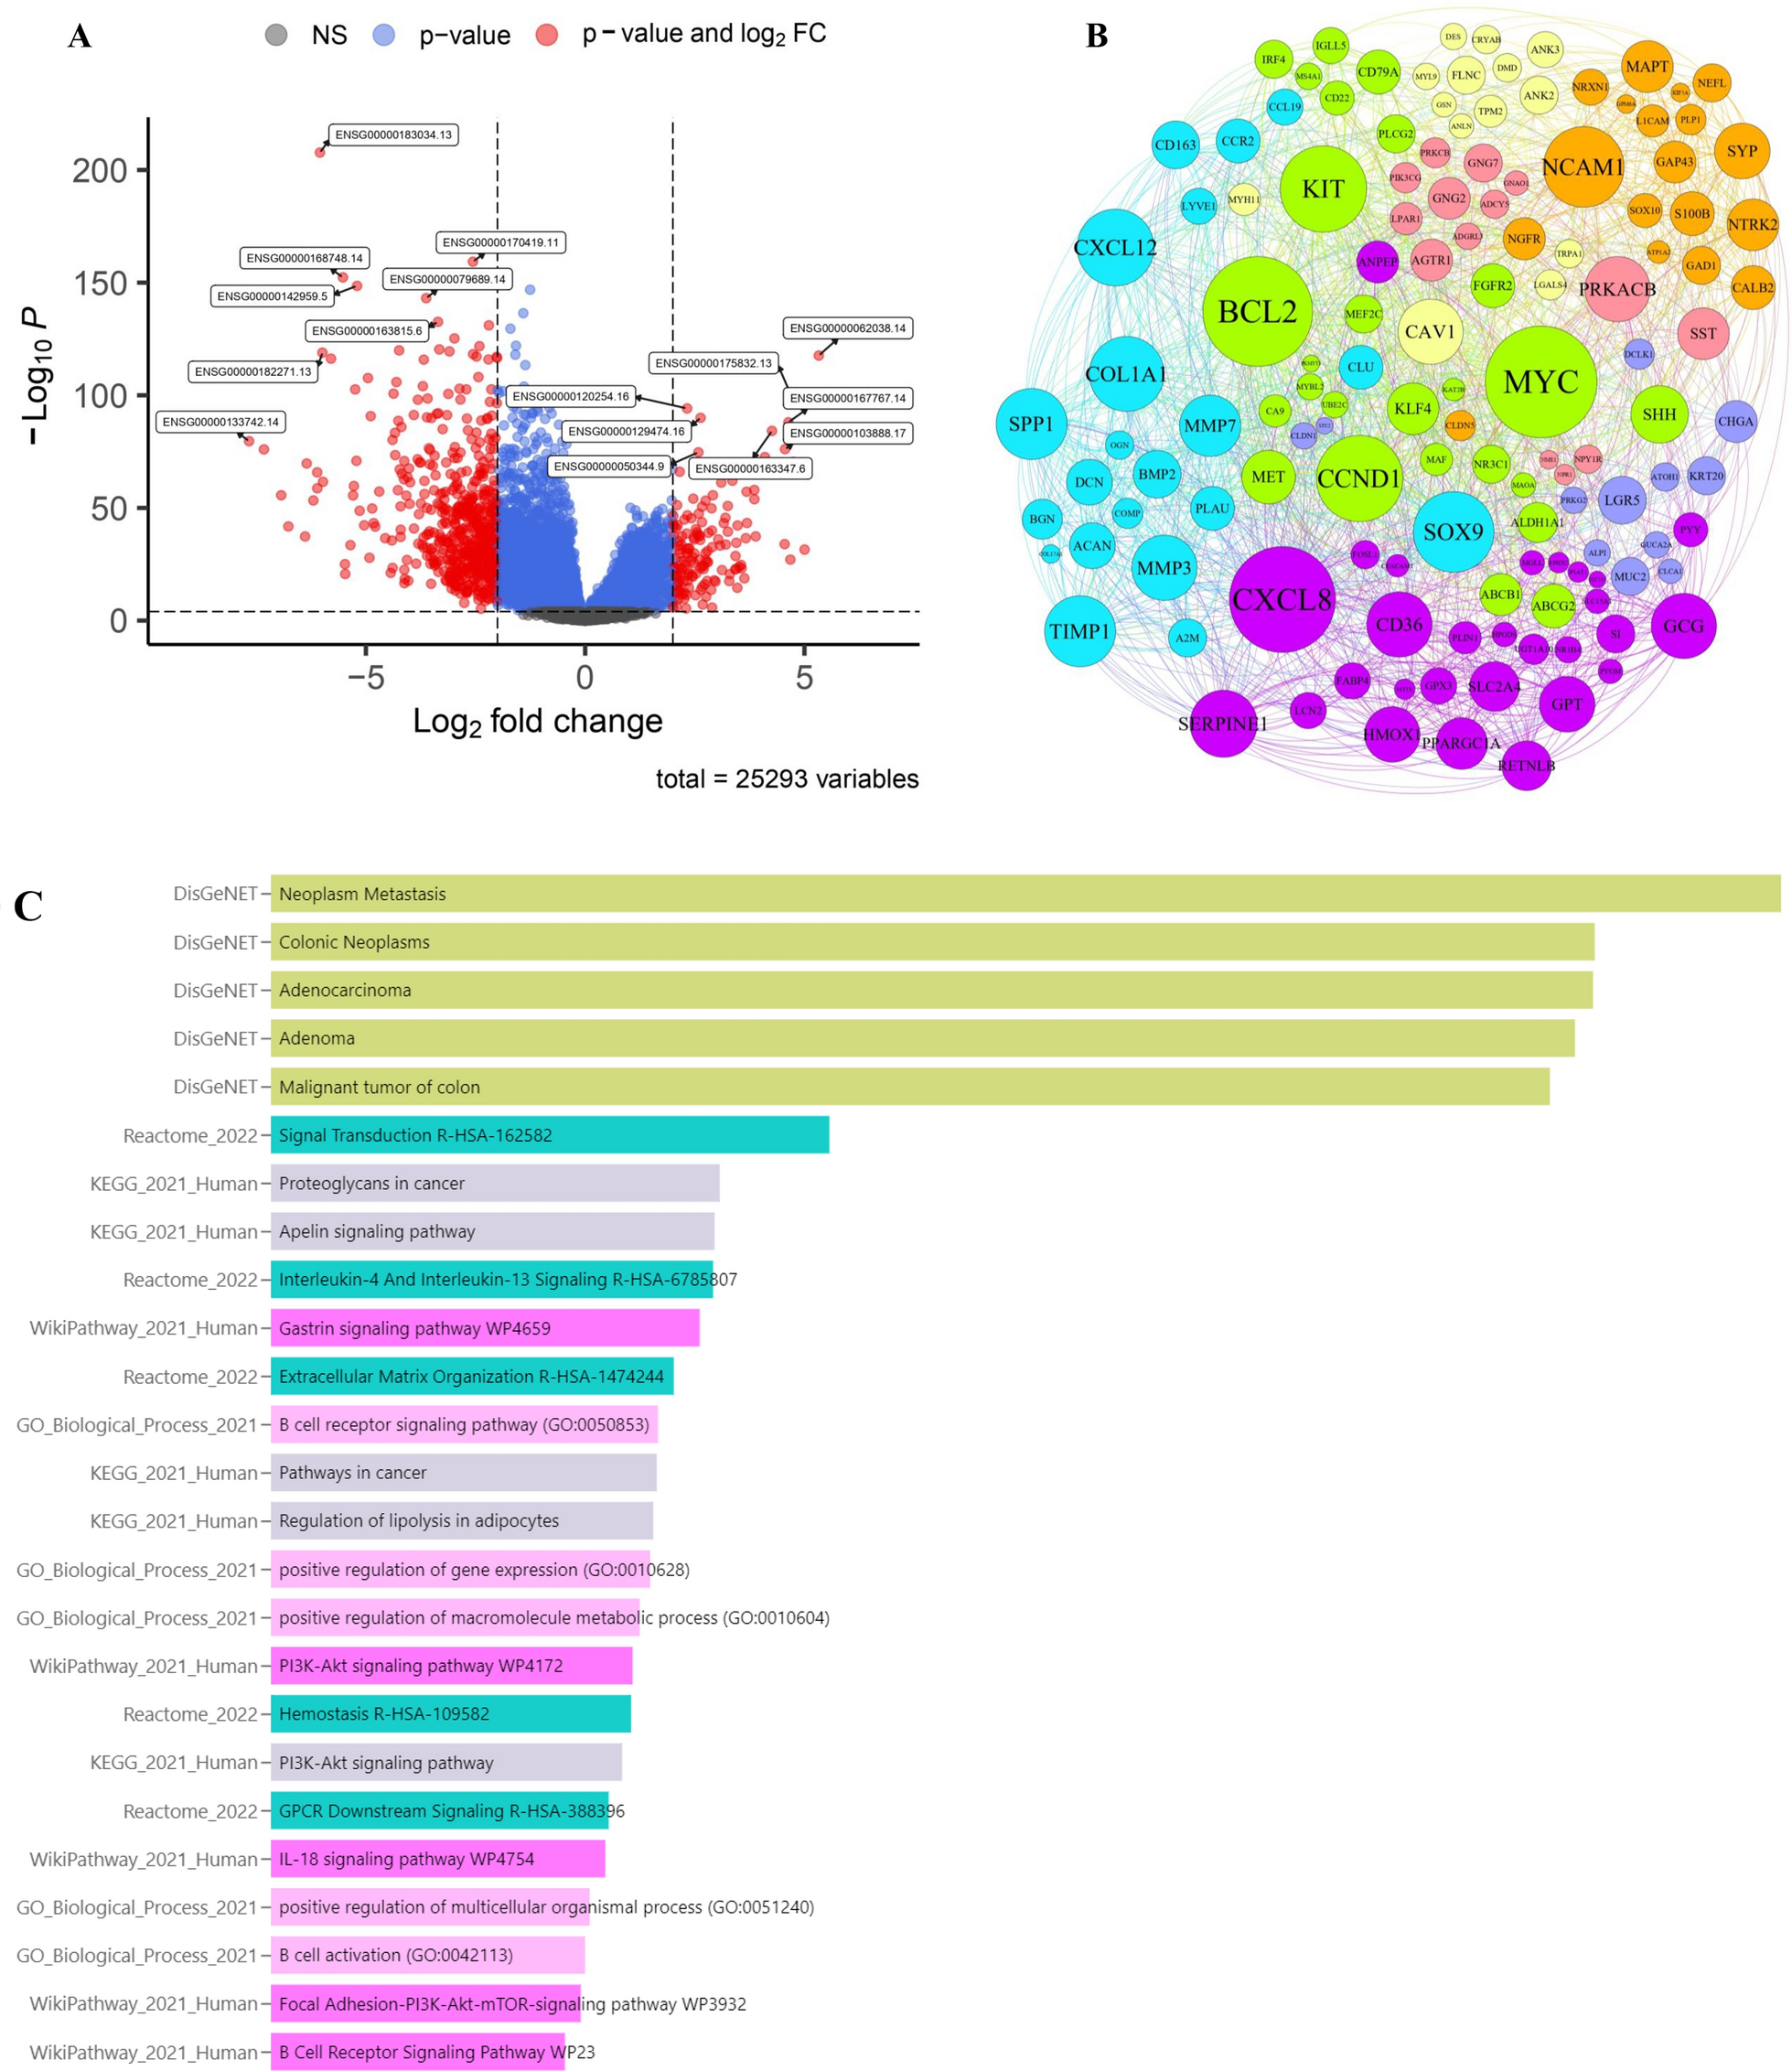
The analytical process of this study is detailed in Additional file 1: Fig. S1. To delineate the transcriptome of GBM patients, we conducted a screening for differentially expressed genes, focusing on those with a substantial log fold change (|logFC|> 1) and statistical significance (p < 0.05) (Fig. 1A) (Additional file 1: Table S1). This analysis revealed that genes such as ADCY5, DRD2, SST, TAC1, SNAP25, GRIN1, ATP1A3, HSPA1A, PRKCZ, SNCA, CAPN3, TF, HBA1, CBS, GSTM2, NDUFB9, ETFB, PINK1, MAPK10, SRXN1, VARS2, CPT1B, NDUFS7, NDUFV2, SDHA, MIF, MUTYH, COX4I1, ALDH2, and PRODH were underexpressed in tumor tissues, while AGT, EGFR, CCL2, CXCL8, PLA2G2A, LTF, FTL, CXCR4, HMOX1, CD44, SPP1, MSR1, CYBB, TREM2, JUN, EGR1, HSPA5, CALR, ANXA5, GPX1, GPX7, PRDX4, MMP2, ODC1, PCNA, MMP9, LOX, TIMP1, PLAU, and SERPINE1 showed higher expression in tumor tissues (Fig. 1B).
Fig. 1
Identification of DEGs and functional enrichment analysis. A Screening for DEGs based on the TCGA, GEO combined GTEx cohort. B The expression of DEGs in the control group and glioma patients. C Enrichment analysis of GSEA in the DEGs. D-F Enrichment analysis of upregulated and downregulated genes
Further exploration into the functions of these GBM-associated differential genes, via GESA, indicated that many of these genes were enriched in pathways related to cytokine receptor interactions, secretions from glands, regulation of coagulation mechanisms, and drug metabolism (Fig. 1C). Additionally, we analyzed the functional aspects of both upregulated and downregulated genes. The findings indicated that the overexpressed genes were primarily enriched in interactions involving receptors for cytokines, lineage of hematopoietic cells, mechanisms of coagulation, rheumatoid arthritis, and interactions between proteins of viruses and receptors of cells. Conversely, downregulated genes were predominantly associated with bile, insulin, and salivary gland secretion, drug metabolism, and phosphatidylinositol signaling systems (Fig. 1D–F). The results indicate that the genes expressed in different ways might have important functions in the growth and advancement of GBM by influencing diverse pathways of communication.
Determining the association between prognosis and ORGsTo further explore the mechanisms of ORGs in glioma, we merged the survival data of patients and identified 40 ORGs closely related to GBM prognosis through univariate analysis. The analysis results show that these genes are associated with poorer overall survival in GBM patients (Fig. 2A). Through gene prognostic network mapping, we discerned co-expression interactions among these oxidative stress-related differential genes, integral to GBM prognosis. These interactions seemingly play a role in shaping GBM’s formation and progression through mutual regulatory effects (Fig. 2B). Additionally, our study brought to light regulatory mutations associated with oxidative stress, with the most frequent mutation found in H6PD (Fig. 2C–D). Collectively, these findings indicate that the expression levels of ORGs are intricately connected with gliomas, potentially mirroring a spectrum of patient characteristics.
Fig. 2
Determining the association between glioma and ORGs. A Univariate prognostic analysis of ORGs in glioblastoma. B Co-expression interactions between ORGs. C, D SNP and CNV analysis of mutations in ORGs
Consensus clustering identified three relevant isoforms of ORGsUsing expression profiles, we delineated three ORG-associated isoforms for optimal clustering stability at K = 3 (Additional file 1: Fig. S2A). Of the 241 GBM patients studied, 113 were categorized into subtype A, 93 into subtype B, and 35 into subtype C. These ORG-related gene subtypes were sorted into three distinct clusters. Heat maps display the normalized enrichment scores for ORGs across these subtypes (Additional file 1: Fig. S2B–D). Glioma patients were distinctly segregated into all three groups as per PCA and tSNE analyses (Additional file 1:Fig. S2E–G). Survival analysis indicated that each subgroup, demarcated by differences in ORGs, had diverse clinical outcomes. Subtype C patients enjoyed a more favorable prognosis compared to A and B, with B faring the worst (Fig. 3A). We discovered that the expression of these prognostic ORGs varied among the groups. Investigating immune correlations, ssGSEA revealed differential immune cell distributions across the subgroups (Fig. 3B, C). By conducting GSVA analysis pairwise among the three subgroups, the results suggest that in the comparison of the AC subgroups, Ribosome and Non-homologous end joining are significantly enriched in the C subgroup, while Glycolysis, Apoptosis, and PPAR signaling pathway are significantly enriched in the A subgroup (Fig. 3D). In the comparison of the AB subgroups, Oocyte meiosis is significantly enriched in the A subgroup, while Apoptosis, NOD-like receptor signaling, and Tryptophan metabolism are significantly enriched in the B subgroup (Fig. 3E). The BC subgroup comparison analysis shows that ECM-receptor interaction, Starch and sucrose metabolism, and Cell adhesion molecules (cams) are significantly enriched in the C subtype (Fig. 3F). Furthermore, GSEA analysis of the possible mechanisms of action between the three subgroups found that the Chemokine signaling pathway, Cytokine-cytokine receptor interaction, and NOD-like receptor signaling pathway are significantly enriched in the A subgroup. The NOD-like receptor signaling pathway and Complement and coagulation cascades are significantly enriched in the B subgroup, while the C subgroup is significantly enriched in Cytokine-cytokine receptor interaction and Graft versus host disease (Fig. 3G–I). The above results indicate that our model effectively predicts the prognosis of GBM patients and proposes the predictive value of oxidative stress-related gene subtype.
Fig. 3
Determining the association between glioma and ORGs. A Survival analysis of 3 subgroups. B, C ssGSEA revealed differential immune cell distributions across the subgroups. D–I GSEA and GSVA analysis of 3 subgroups
Modeling oxidative stress-related gene signaturesWe employed LASSO and Cox regression analyses to assess the expression profiles of 40 genes, building a predictive model. Optimal values were used to characterize 9 critical genes. The optimal threshold linked high gene expression with suboptimal outcomes from previous analyses (Fig. 4A, B). Patients were stratified into high-risk (n = 114) and low-risk (n = 125) groups based on the median critical value. High-risk patients, across the overall cohort and in the training and validation groups, exhibited a higher mortality rate than those in the low-risk group, consistently indicating significantly lower overall survival for the high-risk group (Fig. 3C–E). Risk scores were evaluated with Receiver Operating Characteristic (ROC) curves, yielding areas under the curve (AUC) of 0.719, 0.759, and 0.778 for 1, 3, and 5 years, respectively, in the overall cohort. In the training group, AUCs were 0.799, 0.843, and 0.989 for the same time intervals, while the validation group recorded AUCs of 0.651, 0.662, and 0.727 for 1, 3, and 5 years, respectively (Fig. 4F, H). In summary, this paper presents a robust predictive model for risk classification in glioma patients, with consistent validation results across all cohorts, further affirming its sensitivity as a prognostic tool.
Fig. 4
Construction of a prognosis model for glioblastoma associated with ORGs. A, B LASSO and Cox regression analyses. C–E Analysis of overall survival in low-risk and high-risk groups. F–H ROC curves were used to evaluate the histograms over time
Clinical characterization of different genetic signatures associated with oxidative stress in low and high risk populationsAfterwards, we investigated the possibility of utilizing the oxidative stress pattern to forecast the outcome of GBM individuals, evaluating its practical use in medical environments. Distinct expression patterns were observed in the risk scoring groups. The low-risk group showed predominant expression of BMP2, CCND1, EEF1A1, and HADHA, whereas the high-risk group exhibited notable expression of TXNIP, SPP1, SLC25A20, H6PD, and ACTA1 (Fig. 5A). The mulberry diagram results showed that most patients in group B were placed in the high-risk scoring category, showing lower rates of survival in comparison to group C. Moreover, patients in group B generally displayed higher risk scores than those in groups A and C, which is consistent with our previous analysis findings (Fig. 5B, C). Fig. 5D, E are forest plots of the hazard ratio, showing the effects of age, gender, TMN status, and risk score on outcomes. Our study findings reveal significant associations between the high-risk group and various factors, such as higher tumor grade, older age, and higher risk score. These correlations underscore the relevance of these factors in the context of GBM prognosis and validate the utility of our oxidative stress-based prognostic model.
Fig. 5
Clinical characterization of different genetic signatures associated with oxidative stress in low and high risk populations. A Distribution of ORGs expression in low and high risk populations. B Riskscores for three subgroups. C Sankey diagram showing the prognosis of four GBM subtypes. D, E Univariate Cox analysis and Multivariate Cox analysis of the TGGA and GEO cohort
Tumor microenvironmental status in high and low risk scoring groups for oxidative stress Contemporary research indicates that ORGs are crucial in initiating specific anti-tumor immune responses. In this study, we compared the TME compositions of different risk groups. The presence and activity of immune cells in the TME have a profound impact on tumor development and treatment responses. Different types of immune cells, such as T cells, B cells, macrophages, and neutrophils, can be classified based on their roles in anti-tumor or pro-tumor processes. High-risk patients typically had greater proportions of monocytes, M0, M1, and M2 macrophages and patients in the low-risk group have a higher proportion of T cells and NK cells. (Fig. 6A, B). Further, a strong correlation was observed between neutrophils, eosinophils, resident B lymphocytes, and risk score (Fig. 6C–G). Evidence suggests that the altered expression of these genes is key in triggering distinct anti-tumor responses. When examining the TME in groups at different risk levels, we observed differences in ESTIMATE immunological scores. Specifically, the high-risk group had higher scores compared to the low-risk group (Fig. 6H). Based on these findings, we can speculate that variations in the cellular makeup of the TME could play a significant role in the diversity of oxidative stress. Particularly, there seems to be a noteworthy correlation between the extent of immune cell infiltration and the different risk group. Classifying patients with a risk score based on the cellular composition and level of oxidative stress in the TME can help doctors develop more personalized treatment plans for each patient. High-risk patients may require more aggressive treatment methods, including immunotherapy and targeted therapy, while low-risk patients may benefit from more conservative treatment approaches.
Fig. 6
Tumor microenvironmental status in high and low risk scoring groups for oxidative stress. A–C Correlations between high and low-risk groups and 16 kinds of immune cells. D Correlations between ORGs and 16 kinds of immune cells. E–G Correlations between neutrophils, eosinophils, resident B lymphocytes, and risk score. H Immune, Stromal, and Estimate Scores in high and low-risk groups
Correlation analysis of risk scores and drug sensitivity analysisTo elucidate the impact of our oxidative stress-related predictive model on GBM medication responses, we delved into the correlation between risk scores and GBM therapeutic drugs. The analysis unveiled a pronounced link between risk scores and drug efficacy. We highlighted certain medications like Bibr-1532, Bi-2536, Niraparib, Venetoclax, BMS-345541, AT13148, UMI-77, Tozasertib, and Dasatinib that displayed significant variations in effectiveness between high-risk and low-risk groups (Additional file 1: Fig. S3). These insights suggest that genes associated with oxidative stress could play a role in GBM treatment resistance and present as potential focal points for GBM drug therapy development.
Expression level of model genes in target tissuesThe qRT-PCR results indicated that the mRNA levels of H6PD, SPP1, SLC25A20, TXNIP, and ACTA1 in GBM cells were considerably greater than those in normal human astrocytes, whereas the expression of BMP2, HADHA, CCND1, and eEF1A1 in GBM cells was notably lower compared to normal human astrocytes. Significantly, the Western Blot test exhibited comparable findings. Furthermore, our immunohistochemical findings additionally demonstrated a substantial upregulation of H6PD, SPP1, and ACTA1 in the GBM patient tissues (Fig. 7). The findings validate that HADHA and BMP2 exhibit significant expression levels in glioma tissues, potentially playing a role in the development and advancement of glioma.
Fig. 7
The protein and mRNA expression of ORGs in GBM tissues and cells was detected by IHC, WB and PCR
Knockout of HADHA led to diminished proliferation, migration, and invasion abilities in GBM cells and tumor growth in vivoWe transfected HADHA lentivirus into cells to elucidate its role in GBM. To verify the effectiveness of the knockdown, PCR analyses were performed (Fig. 8A). In comparison to the control group, the group with HADHA knockdown showed a notably decreased cell count (Fig. 8B). A series of subsequent experiments revealed significant findings. The CCK8 assay indicated a substantial reduction in cell viability due to HADHA knockdown (Fig. 8C). Wound healing assays showed a marked decrease in the migration ability of U251 and LN229 cells (Fig. 8D). Additionally, HADHA knockdown resulted in a notable decrease in clone cell abundance (Fig. 8E). To deeply assess the effect of HADHA on gliomas in vivo, we chose two cell lines, LN229 and U251, and divided them into control groups and HADHA stable knockdown groups. These cells were then subcutaneously injected into female BALB/c nude mice to establish a xenograft model. As demonstrated in the figure, compared to the control group, the gliomas with HADHA knockdown in both cell lines showed significantly reduced volume and weight (Fig. 8F). Hence, HADHA significantly influences the development of gliomas, both in vivo and in vitro.
Fig. 8
The Impact of HADHA Knockout on GBM cell. A After 24 h of transfection, PCR was utilized to analyze the mRNA expression levels of HADHA. B Knockdown of HADHA markedly increased the invasion ability of GBM cells. C The vitality of transfected GBM cells was measured through CCK8 assay. D The migration ability of transfected U251 and LN229 cells was measured through wound healing assay. E Knockdown of HADHA significantly reduced the quantity of clones in GBM cells. F The knockdown efficiency of HADHA in tumor growth in vivo ** P < 0.01
留言 (0)