
記住我


A campaign was developed based on the above social norm messages. The communication department of the City of Antwerp, in collaboration with a design agency named Shtick, and closely supported by stakeholders including the communication service of the University of Antwerp, the study advice and student counseling service of the University of Antwerp, the researchers of the study team, and student representatives, contributed to its development.
Various prototypes for the social media campaign were developed, which were presented to the above stakeholders during the development process. During these discussions, the choice was made to use humorous memes that matched the social norm messages. Also in the further development of the campaign, the opinion of the stakeholders was taken into account, mostly in the form of consultations (level 4 of the participation ladder of Arnstein [18]). Apart from the use of social norms to correct misperceptions in the intervention group, other behavioural change techniques were used, such as increasing knowledge and raising awareness of alcohol use.
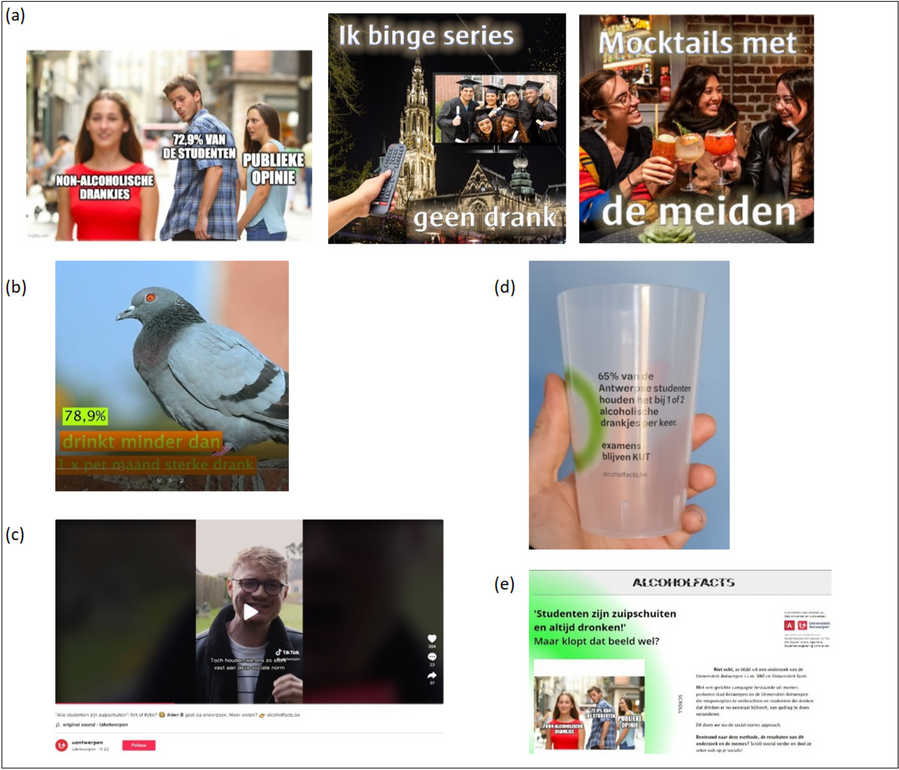
The final campaign, named ‘Alcoholfacts’, consisted of seven static memes (Fig. 1a), two video memes (Fig. 1b), a vlog by an Antwerp student (Fig. 1c) and reusable cups printed with social norm messages for use at student activities (10,000 cups, Fig. 1d). Furthermore, a website was developed (www.alcoholfacts.be, Fig. 1e) where students could find more information about the campaign, alcohol use in general, contact details of help organisations and download materials for the spreading of the campaign via their own social media channels [19]. The social norm messages were incorporated into the campaign by linking every social media post to one of the SNA messages in the caption. Furthermore, every social media post also included a reference to the campaign website.
Fig. 1
Examples of the campaign components of a social norms approach intervention on alcohol use among Flemish university students in 2022-2023
The campaign was launched on 16 November 2022 and initially ran for four weeks. In this period, the City of Antwerp advertised the (video) memes on their social media channels, via TikTok and Instagram. On TikTok, the videos were both posted as organic and paid content (500 euros budget). The latter was targeted at Flemish 18–24 years old with an interest in travel, sports & outdoor, food & beverage, beauty, news & entertainment, higher education or games. In addition, the (video) memes were spread via paid advertisements on Instagram (Reels, Stories, Feed and Explore). A budget of 800 euros was spent to increase the reach of the campaign and 300 euros were spent to raise the number of videos which were played to completion. The advertisements were targeted at people 18–25 years old from Antwerp and its surroundings (40 kms), with an interest in university/college. Furthermore, the student vlog was posted on the TikTok (organic) and Instagram channels (paid) of the University of Antwerp. For Instagram, a budget of 200 euros was spent on clicks to the website, with students aged 18–25 years from Antwerp and its surroundings (40 kms, the Netherlands excluded) and an interest in university/college as the target group. Moreover, student associations of the University of Antwerp were asked to spread the campaign on their social media channels. In addition, the 10,000 reusable cups were distributed among student associations in this period and subsequently used in their student activities. Finally, a combined press release from the city of Antwerp and the University of Antwerp was published, which was picked up by media (radio and newspapers).
During the running time of the campaign, it was decided to run the campaign for a second time, to increase the chance of exposure. Therefore, a boost campaign was launched on 20 March 2023, with a running time of two weeks. During this boost campaign, the city of Antwerp posted advertisements of the memes on their Instagram channel, with a budget of 1185 euros and reach as objective. The same targets were used, except for a smaller range of 20 kms around Antwerp instead of 40 kms. The student vlog was posted on the Instagram channel of the University of Antwerp with a budget of 200 euros and clicks to the website as the objective. Here, the same group as the initial campaign was targeted.
Study design and populationA quasi-experimental study design was used to assess the effect of the developed and implemented SNA intervention on the alcohol use and misperceptions about the alcohol use of peers of Flemish students. The allocation of the SNA intervention was non-randomised: students of the University of Antwerp formed the target group of the social media campaign, whereas Ghent University students served as the control group.
MeasurementsData collectionAnonymised data from the HITC survey edition 2021 [7] of the students of the University of Antwerp and Ghent University were used to assess characteristics at baseline (before the campaign). This survey includes questions on socio-demographics, alcohol use, other substance use, perception of alcohol and substance use, and mental well-being. In addition, an anonymous post-intervention survey was developed. In this post-intervention survey, similar questions regarding alcohol use and perception of alcohol use as in the baseline measurement were used, however, adopted to the appropriate period: these questions were not asked over the last 12 months as in the baseline measurement, but over the last 5 months, to cover the period since the release date of the SNA campaign. Furthermore, questions regarding socio-demographics, other substance use and mental well-being, were also incorporated in the post-intervention survey and asked in the same way as in the baseline measurement. Finally, the post-intervention survey also covered questions regarding the process evaluation. The survey consisted of two different versions, one for the University of Antwerp students and one for the Ghent University students, due to minor differences in reply options of socio-demographic questions. The survey was created using Qualtrics software, version 2022 [20]. Subsequently, the survey was conducted among students of both universities after the running time of the campaign, between 17 April 2023 and 11 May 2023. Recruitment of students took place via email and student portals, similar to the recruitment process of the HITC survey in 2021.
Students of the University of Antwerp and Ghent University of 17–25 years old who filled in the baseline and/or endline (post-intervention) survey were included in the study. Ghent University students who were exposed to the campaign, as indicated by the post-intervention survey, were excluded from the study. Students from the intervention group who were not exposed to the campaign, or had unknown exposure to the campaign, were still included in the outcome analyses, as is common in quasi-experimental studies [21]. By including all targeted students in the intervention group, students who were exposed subconsciously to the campaign were also included in the analyses. Moreover, this approach allowed to test the potential effects of the campaign policy, rather than the potential effects of the intervention on an individual level, which is often more relevant for policymakers and researchers. This approach therefore increased the external validity.
Outcome variablesA process evaluation was performed according to the Medical Research Council guidance for process evaluation of complex interventions [22, 23]. In this study, three different key components of process evaluations were analysed: the implementation of the intervention, the mechanisms of impact (level of satisfaction, relevance, and perceived benefit), and the context. Data for the process evaluation were obtained by asking various questions regarding the opinions and experiences of the students concerning the campaign in the post-intervention survey. For example, the level of satisfaction of the campaign as a whole and the different components of the campaign were asked by using a scale from 0 (low level of satisfaction) to 10 (high level of satisfaction). Also, statements regarding the credibility, attractiveness, relevance and perceived benefit were suggested to the students, with a 5-point Likert scale as answer option. For example, the following statements were presented: ‘I found the campaign credible’, and ‘My perception of the alcohol consumption of my peers decreased due to the campaign’. Furthermore, the process evaluation was complemented by data from the communication departments of the City of Antwerp and the University of Antwerp regarding the spent budget, reach (number of persons reached), impressions (number of impressions of the advertisements) and clicks to the website. These metrics were obtained through Google Analytics and Meta Insights.
The primary outcome assessed in the study was a change in students' alcohol consumption, measured by the number of glasses consumed per week during course periods. This continuous variable was computed in the same way as in the HITC study [7], by combining the answers to two specific questions from both the baseline and endline measurement, namely: how often students drank specific types of alcoholic beverages (light beers, strong beers, wine, spirits) during course periods in the last 12 months (baseline) or last 5 months (endline) (never, monthly or less, once a week, 2–3 times a week, 4 times a week or more) and the number of glasses of these specific beverage types per day during the questioned periods (1–2 glasses, 3–4 glasses, 5–6 glasses, 7–9 glasses, 10 or more glasses). First, the frequency question was quantified in days of drinking over the questioned period (12 months for baseline measurement and 5 months for post-intervention measurement). Second, the number of glasses per drinking day was quantified using the same method as Wicki et al., 2006 [24]. Here, the answers for heavy beers were multiplied by two to correct for the higher percentage of alcohol and higher volume in comparison with other beverages. Third, the total number of drinking days and the number of alcoholic drinks per day were multiplied to calculate the total amount of alcohol consumed during course periods. Next, an outlier correction based on adjusted boxplot analyses [25] using RStudio version 2023.06.0 [26] was performed. The calculated total was then divided by 24 (baseline measurement) or 11 (post-intervention measurement) to come to the number of glasses of alcoholic beverages per week in course periods, as the course period was set at 24 weeks for the baseline measurement (the questions were asked over the academic year which includes 24 weeks of courses) and at 11 weeks for the post-intervention measurement (here, the questions were asked over 5 months, December 2022 till May 2023, which included 11 weeks of courses).
The secondary outcome measured was a change in students' perception of their peers' alcohol consumption, quantified by the number of glasses consumed per week. This was questioned with the following open question: ‘How many alcohol glasses do you think an ordinary student drinks on average in one week during course periods?’
CovariatesPotential confounders were selected based on results of the baseline measurement, literature review, expert opinions and directed acyclic graphs (DAGs) that were drawn a priory to identify covariates that could influence the effect of the intervention (see Additional file 1). The following variables were obtained from both the baseline and post-intervention survey and analysed to assess confounding effects: sex (men/woman), age (open question), faculty (the specific faculties of the University of Antwerp and Ghent University, respectively, which were then recoded to be able to combine), type of education (bachelor program, master program, bridging program or other), living situation during weekdays (at parents or independently), working status (working less than 20 h per week, working more than 20 h per week, not working, which was subsequently recoded into working or not working), religion (Christian, Jewish, Islamic, Hindu, Buddhistic, no religion, other, which was subsequently recoded into Christian, Islamic, other and no religion), importance of religion (5-point Likert scale on importance, which was recoded into unimportant and neutral to important), being a fraternity member (never, in the past, passive member at the moment, active member at the moment, organising member at the moment, which was subsequently recoded into being an active/organising member at the moment or not), other substance use (see below for specific variables), mental wellbeing (see below for specific variables) and exposure to other campaigns (yes, no). When significant differences in these potentially confounding variables existed between the intervention and control group, they were added to the analyses to correct for a potential confounding effect in the outcome assessment.
Regarding other substance use as potential confounder, students were asked if they used tobacco, tranquillizers (non medical use), cannabis or stimulating medication (non medical use) in the past 12 months (yes, no). Furthermore, ever use of other illegal drugs than cannabis was also questioned (yes, no).
To assess the potential covariate mental wellbeing, life satisfaction was questioned using the Cantril ladder, with 0 representing the worst possible life and 10 presenting the best possible life [27]. In addition, psychological distress was surveyed by the Kessler-6 psychological distress scale (Cronbach α = 0.88). This scale is a 5-point Likert scale, ranging from 0 (never) to 4 (very often), with a total score range of 0–24 and a higher score meaning more psychological distress [28].
Sample sizeDue to the small effect sizes of SNA interventions on alcohol consumption in alcoholic beverages per week (our primary outcome) in previous research [29, 30], a small effect size of 0.15 was assumed. Taking into account a significance level of 0.05 (two-sided test), and a power of at least 80%, a minimum of 699 subjects in the intervention group and 699 subjects in the control group were required to participate in the study, based on a t-test for comparing two independent means, calculated with G*Power 3.1.9.4 software.
Analytic strategyDescriptive statistics were used to analyse baseline and endline characteristics. They were expressed as proportions for categorical variables and as medians [interquartile range, IQR] for continuous variables, due to the non-normal distribution of the continuous variables. To analyse differences in characteristics between the intervention and control group, Pearson’s chi-squared tests were used for categorical variables and Mann–Whitney U tests for continuous variables. Furthermore, to examine the impact of the intervention on the primary and secondary outcome variables, a Difference-in-Difference (DiD) approach was used. DiD is a common model for quasi-experimental study designs, when randomised controlled trials are not feasible [31]. It compares the change in outcome in an intervention group before and after exposure to the intervention, while accounting for a concurrent change in the control group not receiving the intervention [31, 32]. In our study, the DiD model was integrated into a multiple linear regression model (following an intention-to-treat analysis, ITT), one for analysing the effect of the intervention on alcohol consumption (primary outcome) and one for the perception of alcohol consumption of peers (secondary outcome). In addition, variables that significantly differed between the intervention and control group at baseline or endline were analysed for the univariable association with the primary and secondary outcome, respectively. These univariable analyses were performed using Mann–Whitney U tests for variables with two categories and Kruskal–Wallis tests for variables with more than two categories. Statistically significant variables from the univariable analyses were included in the multiple linear regression models. The models were built using backward elimination. Subsequently, these multiple linear regression models were bootstrapped, because the assumptions of normality and homoscedasticity of residuals were not met. In addition, an exploratory subgroup analysis for sex was performed, due to the hypothesis that SNA interventions can have a different impact on females compared to males [33]. Also, a subgroup analysis on students from the intervention group who were exposed to the campaign (a per-protocol analysis, PP), was performed, to test for a difference in intervention effect between exposed and non-exposed students. The models of the subgroup analyses were built in the same way as the models of the main analyses.
The significance level for all statistical tests was set at α = 0.05. Statistical analyses were performed using IBM SPSS Statistics for Windows, Version 29.0.
留言 (0)