
記住我
The dominant etiological theory for Alzheimer's disease (AD) is the amyloid-β (Aβ) protein cascade hypothesis, formulated in 1984 (Hardy and Higgins, 1992). It has remained at the center of the conceptualization of the disease ever since, including in diagnostic guidelines (McKhann et al., 2011), research frameworks (Jack et al., 2013), and now clinical care. It has regained new impetus as three Aβ antibody therapies are gaining regulatory approval worldwide based on their demonstrating removal of Aβ oligomers with an accompanying delay in the cognitive decline of approximately six months (Sims et al., 2023; van Dyck et al., 2023). However, all three “now referred to in the field as disease-modifying therapies” present with amyloid-related imaging abnormalities related to a breakdown in the cerebrovasculature in a high number (35%) of individuals, as well as a large heterogeneity response, with women and non-White populations, in particular, showing less to no benefit (Farrer et al., 1997). Thus, identifying individuals who can safely receive and benefit from these treatments is now a glaring priority.
Further, while these disease-modifying therapies constitute an undeniable advance, their limited efficacy does not eliminate the need to understand the dementia process surrounding Aβ accumulation, and attempt to explain discrepant evidence such as its poor relation to cognitive deficits (Mormino et al., 2009; Villain et al., 2012; Haller et al., 2019), its presence at theoretically pathological levels in a large proportion of otherwise cognitively healthy seniors (Katzman et al., 1988; Bennett et al., 2006), and its poor spatial match to the accumulation of tau, neurodegeneration, or brain energy hypometabolism (Jack et al., 2013).
A larger, more integrated perspective is therefore required to understand the relationship between the various abnormalities that are present in AD, such as the aberrant production and accumulation of amyloid and tau proteins, reduced energy metabolism and neurovascular coupling, inflammation surge, synaptic dysfunction and neuronal death, and inevitably, cognitive and behavioral impairment; all the while taking into account genotype differences (e.g., sex and APOE gene) and lifestyle risk factors.
Experimentally, assessing such a global theory is logistically impossible to achieve as the number of variables is substantial. This leads to ethical, logistical, and financial difficulties when studying human patients, namely the lack of causal studies, the long duration of neurodegeneration, and the always incomplete selection of biomarkers in clinical studies due to resource and time constraints. Traditional research further relies on statistical models, a reductionist approach geared toward proving the null hypothesis, and that frequently are used only to test associations between data without providing an understanding of the processes at play.
Alternatively, computational models integrate diverse sources of data into a theoretical framework, able to test the plausibility of working hypotheses and elicit novel ones. Mechanistic computational models are therefore able to capture interactions between abstracted entities at various levels, sidestepping the limitations inherent in human studies, and thus provide a deeper understanding of the interactions between those involved in aging and neurodegeneration. They could be used to uncover potential mechanisms, provide an in silico testable environment for treatment response, and hence suggest either novel or more appropriately personalized therapeutic regimens.
Few large-scale theoretical integrative efforts of this kind have been attempted, e.g. Hao and Friedman (2016), Bertsch et al. (2017), Petrella et al. (2019), and Ji et al. (2021). In our recent review of integrative mathematical models of AD, we found near-universal limitations in terms of internal and external validity, reduced scope, or unrealistic disease conceptualizations (Moravveji et al., 2022).
In this work, we propose a multi-entity, multi-scale (protein, cells, and organ-level) mathematical model describing the aging process, to capture the onset and progression of AD, based on and improving upon the one proposed by Hao and Friedman (2016). Our model is described in the following section and covers processes such as extracellular Aβ aggregation and clearance, the formation of neurofibrillary tangles (NFTs) from tau proteins, and the activation of microglia. The contributions of our work compared to previous reports include (a) an improved justification, via biological principles, of the qualitative and quantitative relationships between the model's entities; (b) the inclusion of novel entities, especially glycogen synthase kinase 3 (GSK-3) and insulin, to enable the link between brain health and diabetes, a well-identified risk factor for AD (Zhang et al., 2018); (c) a more complex description of the amyloid accumulation process by including different stages for amyloid-β extracellular aggregation (monomers, oligomers, and plaques), enabling the testing of hypotheses related to disease-modifying treatments; (d) the concept of a “reservoir” of non-activated cells, such as non-activated microglia, as well as terms describing the conversion of macrophages and microglia from anti-inflammatory to proinflammatory states; and (e) the inclusion of sex and APOE gene effects on some parameters. We also solved the model over a longer evolution timeframe, describing the effects of aging over 50 years; these results are provided without and with manipulation of some external entities, e.g. insulin concentrations. Finally, we completed a thorough validation of parameter values using published literature; these are listed in Supplementary material A. In fine, our model can generate predictions that can be more easily validated with human experimental data, as presented in the Section 4 of our report.
It is important to realize that this represents but a step toward an ever more complex disease model, as with each new evidence the nature of the equations and parameter values are set to change.
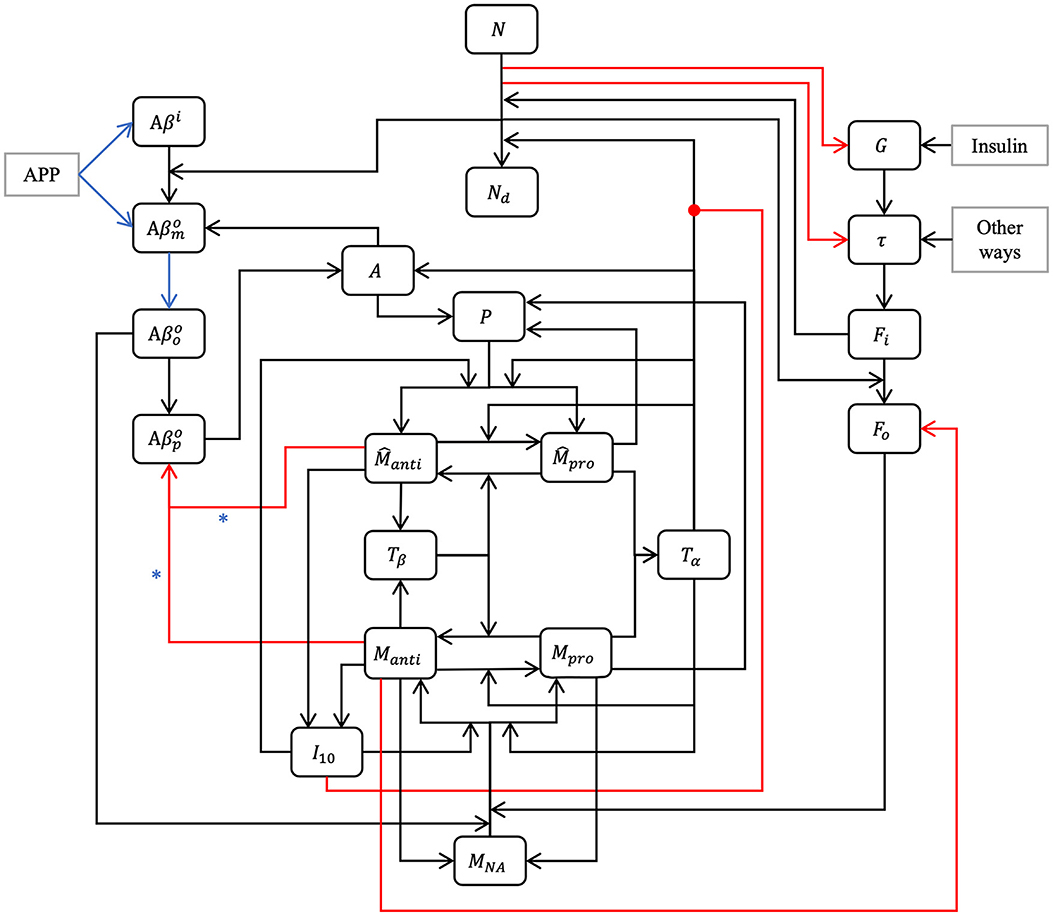
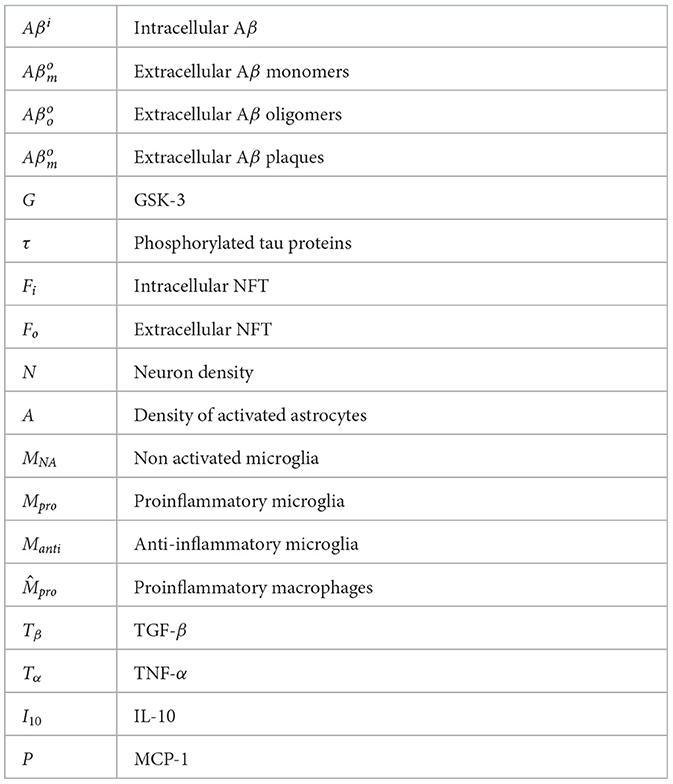
2 MethodOur model is composed of 23 ordinary differential or other equations and describes the evolution of brain health entities over 50 years. A schematic illustrating how each entity interact is given in Figure 1. Each entity has been abstracted as a dynamical variable, expressed in either concentration or density (g/ml or g/cm3). Table 1 lists all variables of the model.
Figure 1. Model schematic. Our hypothesis can be summarized in the model schematic. We propose that the relationships between entities, evolving dynamically through time, is sufficient to explain the decline in neurons, rise of inflammation, and increases in both amyloid plaques and tau tangles that is seen in aging, up to and including Alzheimer's disease, without requiring an external “catalytic” event such as reactive oxygen species production. This is a multi-factorial, multi-parametric viewpoint, quite different from other hypotheses in the literature. Blue arrows and asterisk identify an APOE4-dependent relation. Red arrows identify degradation relations, and red lines ending with a dot is for inhibition.
Table 1. Model variables.
2.1 Impact of sexAround 60% of Americans suffering from AD are women (Rajan et al., 2021). This has been proposed to be related to the action of hormones, estrogens in particular. Some authors claim a link between menopause and dementia (Mielke, 2018). Generally speaking, women experience a more rapid cognitive decline than men. It is possible that this is due to the fact that women receive an AD diagnosis later in life than men (Ferretti et al., 2018). According to many studies, there are no differences with respect to the Aβ charge between men and women (Ferretti et al., 2018). This is however controversial as other studies demonstrate sex-related differences, such as Carroll et al. (2010) and Yang J.-T. et al. (2018). Regarding neurofibrillary tangles and hyperphosphorylated tau proteins, the majority of post-mortem studies of AD patients did not reveal an impact of sex (Ferretti et al., 2018). However, some studies suggested that there is a greater accumulation of tau proteins and NFT in women than in men (Barnes et al., 2005; Yang J.-T. et al., 2018). Studies using large-scale datasets such as Alzheimer's Disease Neuroimaging Initiative (ADNI) and Minimal Interval Resonance Imaging in Alzheimer's Disease (MIRIAD) determined that atrophy rates are 1%–1.5% faster in women suffering from mild cognitive decline or AD than in men with similar conditions (Ferretti et al., 2018), which would be an indicator of a greater neural loss and more important tau pathology. We elected to take sex into account in our model by including its effect in various equations via the variable S (S = 0 for women and S = 1 for men); capturing sex-related differences in the densities of neurons, astrocytes, and microglia (Pakkenberg and Gundersen, 1997; Pelvig et al., 2008); as well as using different functions and values for cerebral insulin based on the findings of Bryhni et al. (2010). The normal GSK-3 concentration is also sex-dependent according to Knight et al. (2021).
2.2 Impact of APOE4One of the most important genetic risks for AD is the presence of one or two copies of the ε4 allele of the APOE gene (APOE4). About 15%–25% of individuals bear a copy of APOE4 and 2%–3% have two copies of the gene: the ε3 allele is the most common and is not associated with an increased risk of AD. The ε2 allele is relatively rare and could offer protection against AD (Hsiung and Dessa Sadovnick, 2007; Bryant, 2021). People with APOE4 have a greater accumulation of Aβ (Roher et al., 2009; Kanekiyo et al., 2014). In our model, we supposed that APOE4 leads to greater intracellular Aβ production. We also assumed that APOE4 leads to a greater rate of extracellular Aβ production (Roher et al., 2009). It has been observed by Hashimoto et al. (2012) that the level of Aβ oligomers in persons suffering from AD and having APOE4 is 2.7 times greater than in people with APOE3. In our model, we considered that the aggregation rate of Aβ into oligomers is higher in people with APOE4. We discriminated between APOE4 status by defining a variable, AP, for the presence of APOE4 (AP = 1 when the allele ε4 is expressed and AP = 0 otherwise). We considered that APOE4 has no impact on the aggregation rate of Aβ oligomers into plaques (Garai et al., 2014; Jäkel et al., 2020). In our model, we rather chose as a mechanism of action that clearance of Aβ plaques was less efficient in persons with APOE4 (Kanekiyo et al., 2014; Hansen et al., 2018).
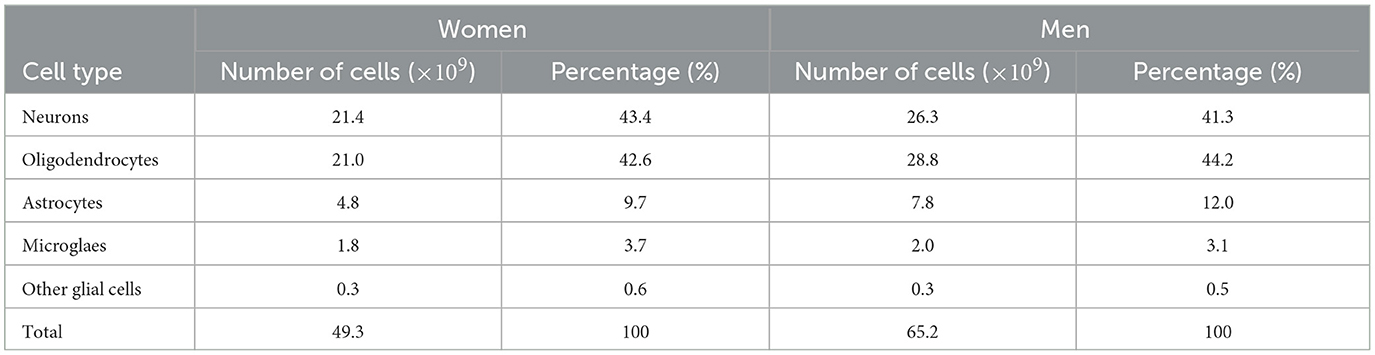
2.3 Neuronal populationsFrom Pelvig et al. (2008), we extracted the values for the number and proportion of cells of each type (see Table 2).
Table 2. Populations (in billions) and proportions (in %) of brain cells, based on Pelvig et al. (2008).
Knowing that the brain density, ρbr, is 1.03 g/cm3 (National Institute of Standards and Technology, 2017), we can compute the density of neurons and astrocytes in the female (F) and male (M) brain (see Equations 1–4).
N0F =ηNF×ρbr=43.4100×1.03= 0.45 g/cm3, (1) N0M =ηNM×ρbr=41.3100×1.03= 0.42 g/cm3, (2) A0F =ηAF×ρbr=9.7100×1.03= 0.10 g/cm3, (3) A0M =ηAM×ρbr=12.0100×1.03= 0.12 g/cm3, (4)where ηX is the percentage of brain cells corresponding to the population X, with X equal to N for neurons or A for astrocytes.
2.4 Equations for amyloid betaAD is characterized by Aβ plaque deposits. These plaques are produced by the amyloid precursor protein after it has been sequentially cleaved by β- and γ-secretase enzymes. This process leads to the creation of two types of Aβ: Aβ40 and Aβ42. While Aβ42 only accounts for 10% of the total quantity of Aβ, it is the most toxic form due to its hydrophobicity, aggregation, and a larger potential for fibrillation (Hohsfield and Humpel, 2015). The agglomeration process of Aβ is still little understood. Some studies suggest that oligomers are only a transitory form in fibril formation while other studies propose that these different species emerge from independent pathways (Cohen et al., 2013). It is not clear if oligomer aggregation occurs through successive monomer addition or the concatenation of smaller oligomers. For tetramers, it appears that the one-at-a-time aggregation of monomer is more frequent than the concatenation of two dimers (Man et al., 2019). However, the opposite result has also been proposed (Barz et al., 2018). Either way, small oligomers aggregate to form protofibrils, which can become fibrils, which can in turn form plaques. According to this evidence, we will only consider Aβ42 and divide aggregation into four phases: intracellular monomers, and extracellular monomers, oligomers, and plaques. We assume that monomers cleaved by γ-secretase aggregate into oligomers.
2.4.1 Equation for intracellular amyloid beta monomersThe equation for monomeric Aβ is:
dAβidt=λAβi(1+AP·δAPi)NN0-dAβiAβi-AβiN|dNdt|. (5)The first term in Equation (5) represents the creation of intracellular Aβ from an amyloid precursor protein, where λAβi is the reaction rate influenced by the presence of APOE4.
The second term, -dAβiAβi, describes the degradation of intracellular Aβ, with dAβi representing the rate of degradation.
The last term in Equation (5) accounts for the externalization of intracellular monomers when neurons undergo cell death. This term captures the transition of intracellular Aβ to extracellular Aβ and is proportional to the rate of neuronal loss, denoted by dNdt.
2.4.2 Equation for extracellular amyloid beta monomersFor extracellular Aβ, we considered two separate aggregation processes: the transition from monomers to oligomers and subsequently the transition from oligomers to plaques.
The equation describing the evolution of extracellular Aβ monomers is given by
dAβmodt=AβiN|dNdt|+λAβmo(1+AP·δAPm)NN0+λAAβmoAA0 −κAβmoAβoo(1+AP·δAPmo)(Aβmo)2−dAβmoAβmo. (6)The first term of Equation 6 represents the transition from intracellular to extracellular amyloid, while the second term represents the creation of extracellular Aβ monomers from the amyloid precursor protein. The rate of production is assumed to be proportional to neuron density. The third term accounts for the production of extracellular Aβ monomers by activated astrocytes, which produce less Aβ compared to neurons. The rate of production is denoted by λAAβmo, it is influenced by the presence of APOE4 and is proportional to astrocyte activity.
The aggregation of monomers into oligomers is described by the fourth term, which is influenced by the presence of APOE4. The rate of aggregation is represented by κAβmoAβoo, and it reflects the propensity of Aβ monomers to form oligomers. Garai and Frieden (2013) identified the formation of dimers as a critical step in the transition from monomers to oligomers. Although our equation focuses on dimer formation (hence the squared term), for simplicity and due to data limitations, we consider the rate as a representative step denoted by κAβmoAβoo. Lastly, the equation accounts for the degradation of extracellular Aβ monomers through various processes, including degradation by microglia and self-degradation. The rate of degradation, represented by dAβmo, reflects the overall degradation rate of extracellular Aβ monomers.
2.4.3 Equation for extracellular amyloid beta oligomers dAβoodt=κAβmoAβoo(1+AP·δAPmo)(Aβmo)2−κAβooAβpo(Aβoo)2 −dAβooAβoo. (7)The Equation 7 consists of three terms. The first one accounts for the aggregation of monomers into oligomers; the second describes the aggregation of oligomers into Aβ plaques, with κAβooAβpo representing the aggregation rate. Finally, the last term captures the degradation of oligomers through various processes, including microglia-mediated degradation and self-degradation.
2.4.4 Equation for extracellular amyloid beta plaques dAβpodt= κAβooAβpo(Aβoo)2 −(dMantiAβpoManti+dM^antiAβpoM^anti) (1+AP·δAPdp)AβpoAβpo+KAβpo. (8)The first term of Equation 8 represents an oligomer-to-plaque conversion while the second one describes plaque degradation by anti-inflammatory microglia and macrophages.
Activated macrophages and microglia can eliminate Aβ plaques (Lee and Landreth, 2010). Macrophages are more efficient at this task than microglia (Lai and McLaurin, 2012; Thériault et al., 2015). Also anti-inflammatory microglia and macrophages cleave Aβ more efficiently than their proinflammatory counterparts (Tang and Le, 2016; Wang et al., 2021). For this reason, we will neglect plaque degradation by proinflammatory cells.
The constants dMantiAβpo and dM^antiAβpo denote the maximum degradation rates of Aβ plaques by microglia and macrophages, respectively. Lastly, the constant KAβpo represents the half-saturation constant for plaque degradation by microglia and macrophages.
2.5 Equation for glycogen synthase kinase 3There are two isoenzymes of GSK-3, GSK-3α and GSK-3β, both able to hyperphosphorylate tau proteins and are putatively involved in AD. However, GSK-3β is more dysregulated in AD (Hooper et al., 2008). For this reason, our model will only consider that isoenzyme. In turn, the action of GSK-3 is modulated by insulin concentration. When the insulin concentration is normal, GSK-3 is inhibited, but when it is smaller, the activity of GSK-3 is increased (Cross et al., 1995; Ghasemi et al., 2013; Yang L. et al., 2018).
dGdt=λInsGIns0Ins(t)NN0-dGG-GN|dNdt|. (9)In this context, in Equation 9, λInsG represents the insulin-influenced rate of GSK-3 creation, Ins(t) denotes the insulin concentration as a function of age, while Ins0 represents the normal concentration of brain insulin. The second term describes GSK-3 degradation; the constant dG refers to the rate of this decrease/degradation.
2.6 Equation for phosphorylated/hyperphosphorylated tau proteinsAnother important factor in AD onset and progression is the presence of hyperphosphorylated tau proteins (τ) in the central nervous system, mainly in neurons. Tau proteins are phosphorylated and hyperphosphorylated by many processes including glycogen synthase kinase 3 (GSK-3) (Domínguez et al., 2012). Tau proteins in AD patients are three to four times more phosphorylated than in age-matched individuals without cognitive difficulties (Gong and Iqbal, 2008). The equation for τ is as follows:
dτdt=λτNN0+λGτGG0-κτFi(τ)2NN0-τN|dNdt|-dττ. (10)The first term accounts for non-GSK-3-mediated hyperphosphorylation of tau proteins. The constant λτ represents the initial rate of this hyperphosphorylation. The second term corresponds to GSK-3-mediated hyperphosphorylation. Deviations in GSK-3 concentration from the normal level G0 result in either increased or decreased tau protein hyperphosphorylation compared to the normal rate (λGτ). The third term corresponds to the transformation of tau proteins into neurofibrillary tangles. The exponent 2 translates the fact that at least two tau proteins are necessary to form a neurofibrillary tangle. When neurons die, tau proteins are released from the intracellular space into the extracellular environment and are subsequently eliminated. This process is captured by the term -τN|dNdt| in Equation (10). The last term accounts for the degradation and dephosphorylation of phosphorylated/hyperphosphorylated tau proteins at a rate of dτ.
2.7 Equations for NFTsHyperphosphorylated tau proteins aggregate to form neurofibrillary tangles (NFTs), causing the destruction of microtubules, which in turn blocks the neuron transport system and affects synaptic transmission (Hao and Friedman, 2016; National Institute on Aging, 2017). The presence of intracellular NFTs leads to neural death. The equation for intracellular NFTs is as follows:
dFidt=κτFi(τ)2NN0-dFiFi-FiN|dNdt|. (11)The first term captures the aggregation process of hyperphosphorylated tau proteins, resulting in the formation of intracellular NFTs. The second term accounts for the degradation and elimination of these intracellular NFTs at a rate of dFi. Finally, the last term represents the release of intracellular NFTs into the extracellular space upon neuronal death.
The evolution of extracellular NFTs is described by the following equation
dFodt=FiN|dNdt|-κMFoMantiManti+KMantiFo-dFoFo. (12)The first term in this equation, which is the same as the last term in Equation (11), represents the release of extracellular neurofibrillary tangles upon neuronal death. When neurons die, intracellular NFTs transform into “ghost tangles” that undergo minimal degradation, unless microglia or astrocytes act (Kril et al., 2002; Zilka et al., 2012; Moloney et al., 2021). The degradation of extracellular NFTs by microglia, specifically anti-inflammatory microglia, is described by the second term in Equation (12). The last term accounts for the degradation of extracellular NFTs resulting from other factors such as astrocytes and self-degradation.
2.8 Equation for the density of neuronsThe evolution of neuronal density is described by the following equation:
dNdt=−dFiN11+exp(−n·Fi−KFi
留言 (0)