
記住我


The overall eye size of compound eyes is determined by ommatidia number and size (here reflected by facet area). While D. mauritiana generally have larger eyes than the closely related species D. simulans [16, 21, 28], it remains unclear if this difference is always caused by one or both parameters. We analysed total eye area, central facet area, and total ommatidia number from scanning electron microscopy images in multiple strains of both species (Additional File 1: Table S1) and found a negative correlation between central ommatidia facet size and number in D. simulans (females R = − 0.38 p = 0.00021; males R = − 0.3 p = 0.0036) suggesting a potential trade-off between these characteristics (Fig. 1, Additional File 2: Fig. S1). In contrast, D. mauritiana had generally wider and more numerous ommatidia and consequently overall larger eyes than D. simulans and the trade-off seen in D. simulans was absent in females. Interestingly, D. mauritiana males showed a positive correlation between ommatidia number and facet size (R = 0.34, p = 0.0087; Fig. 2, Additional File 2: Fig. S1).
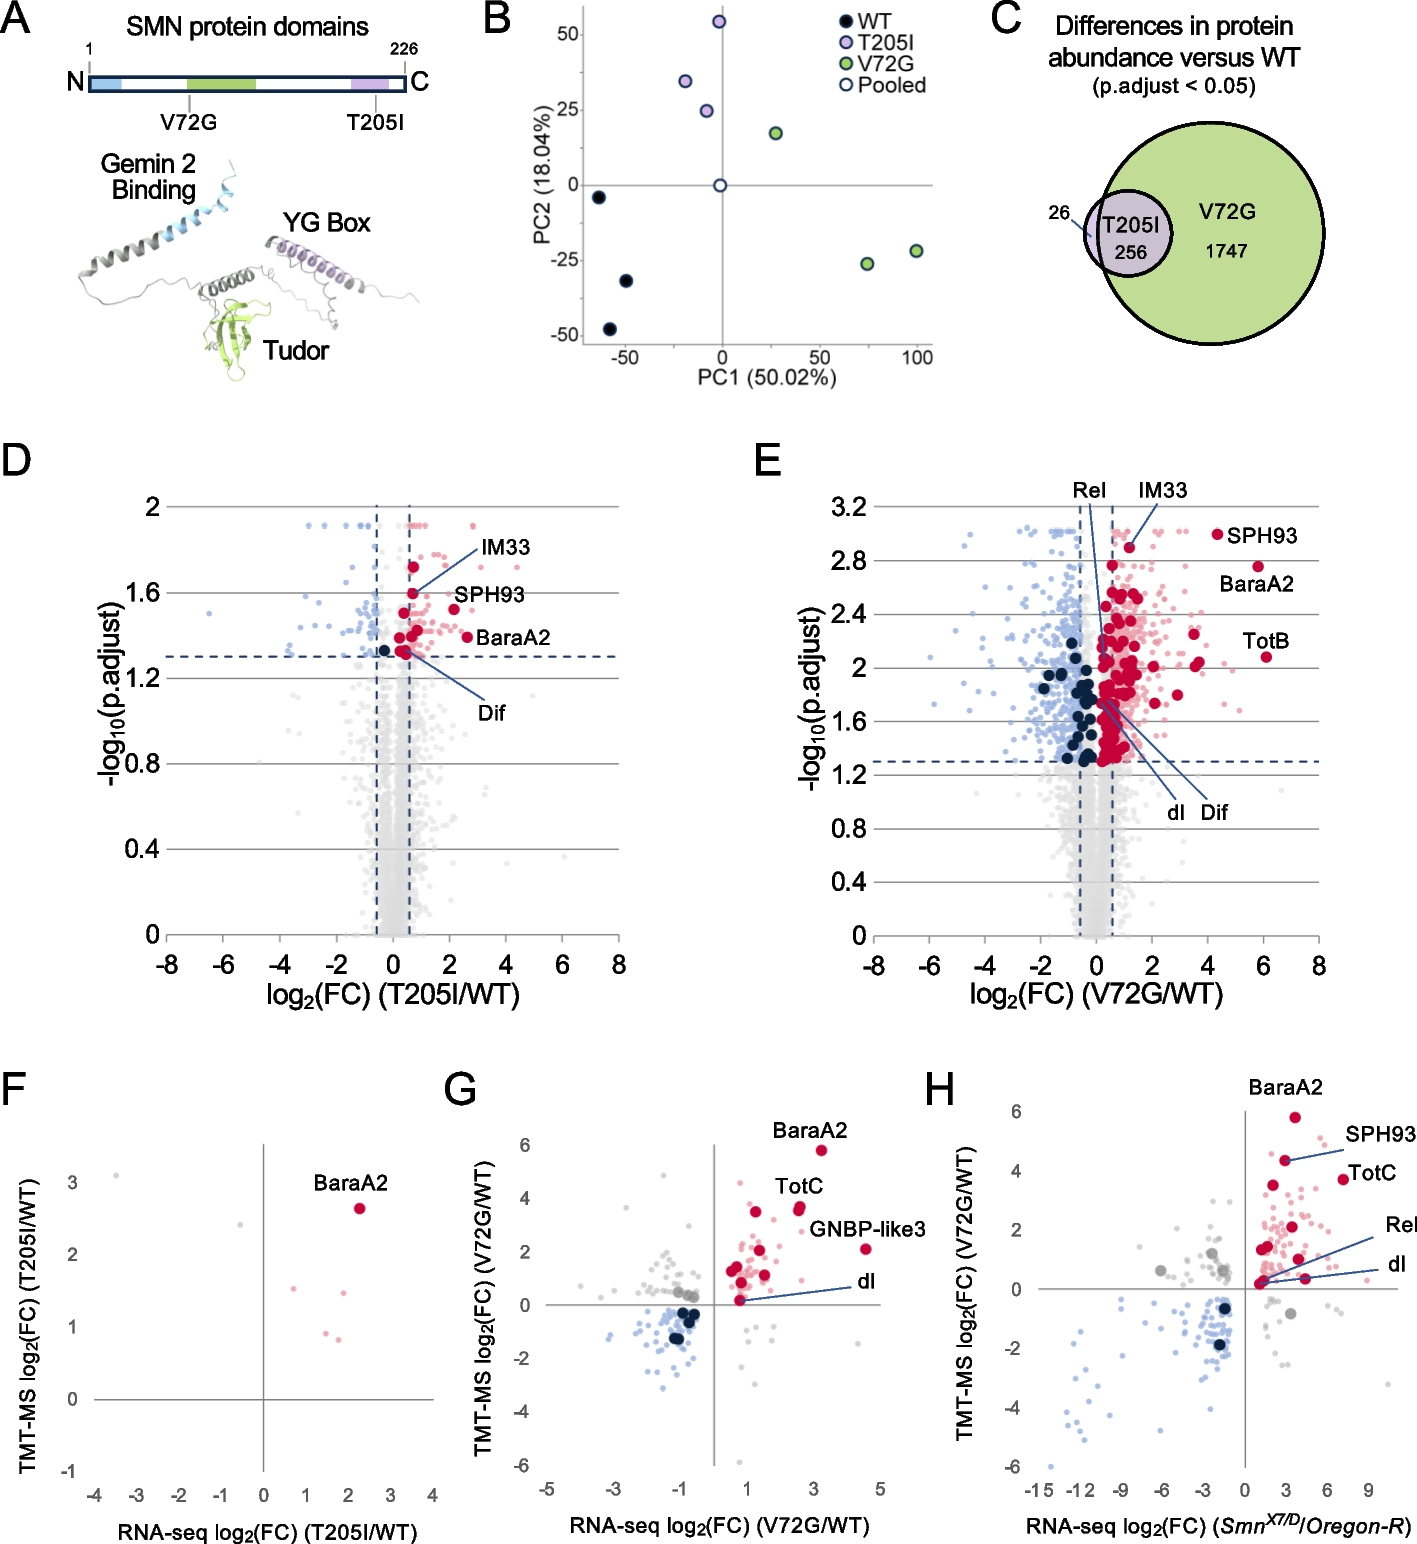
Fig. 1
Variation in eye size, ommatidia number, and ommatidia size across closely related D. mauritiana and D. simulans. Average eye size (mm2, circle area) of D. simulans (blue) and D. mauritiana (red) strains (circle labels) plotted against total ommatidia number and ommatidia facet area (in μm.2) for females (a) and males (b). D. mauritiana generally have larger eyes with more and larger ommatidia compared to D. simulans. Eye size was measured from side view scanning electron micrographs of single eyes. n = 11 for MS17 females and n = 15 for males and females of all other strains. Measurements provided in Fig. 1 morphological measurements.xlsx on figshare [29]
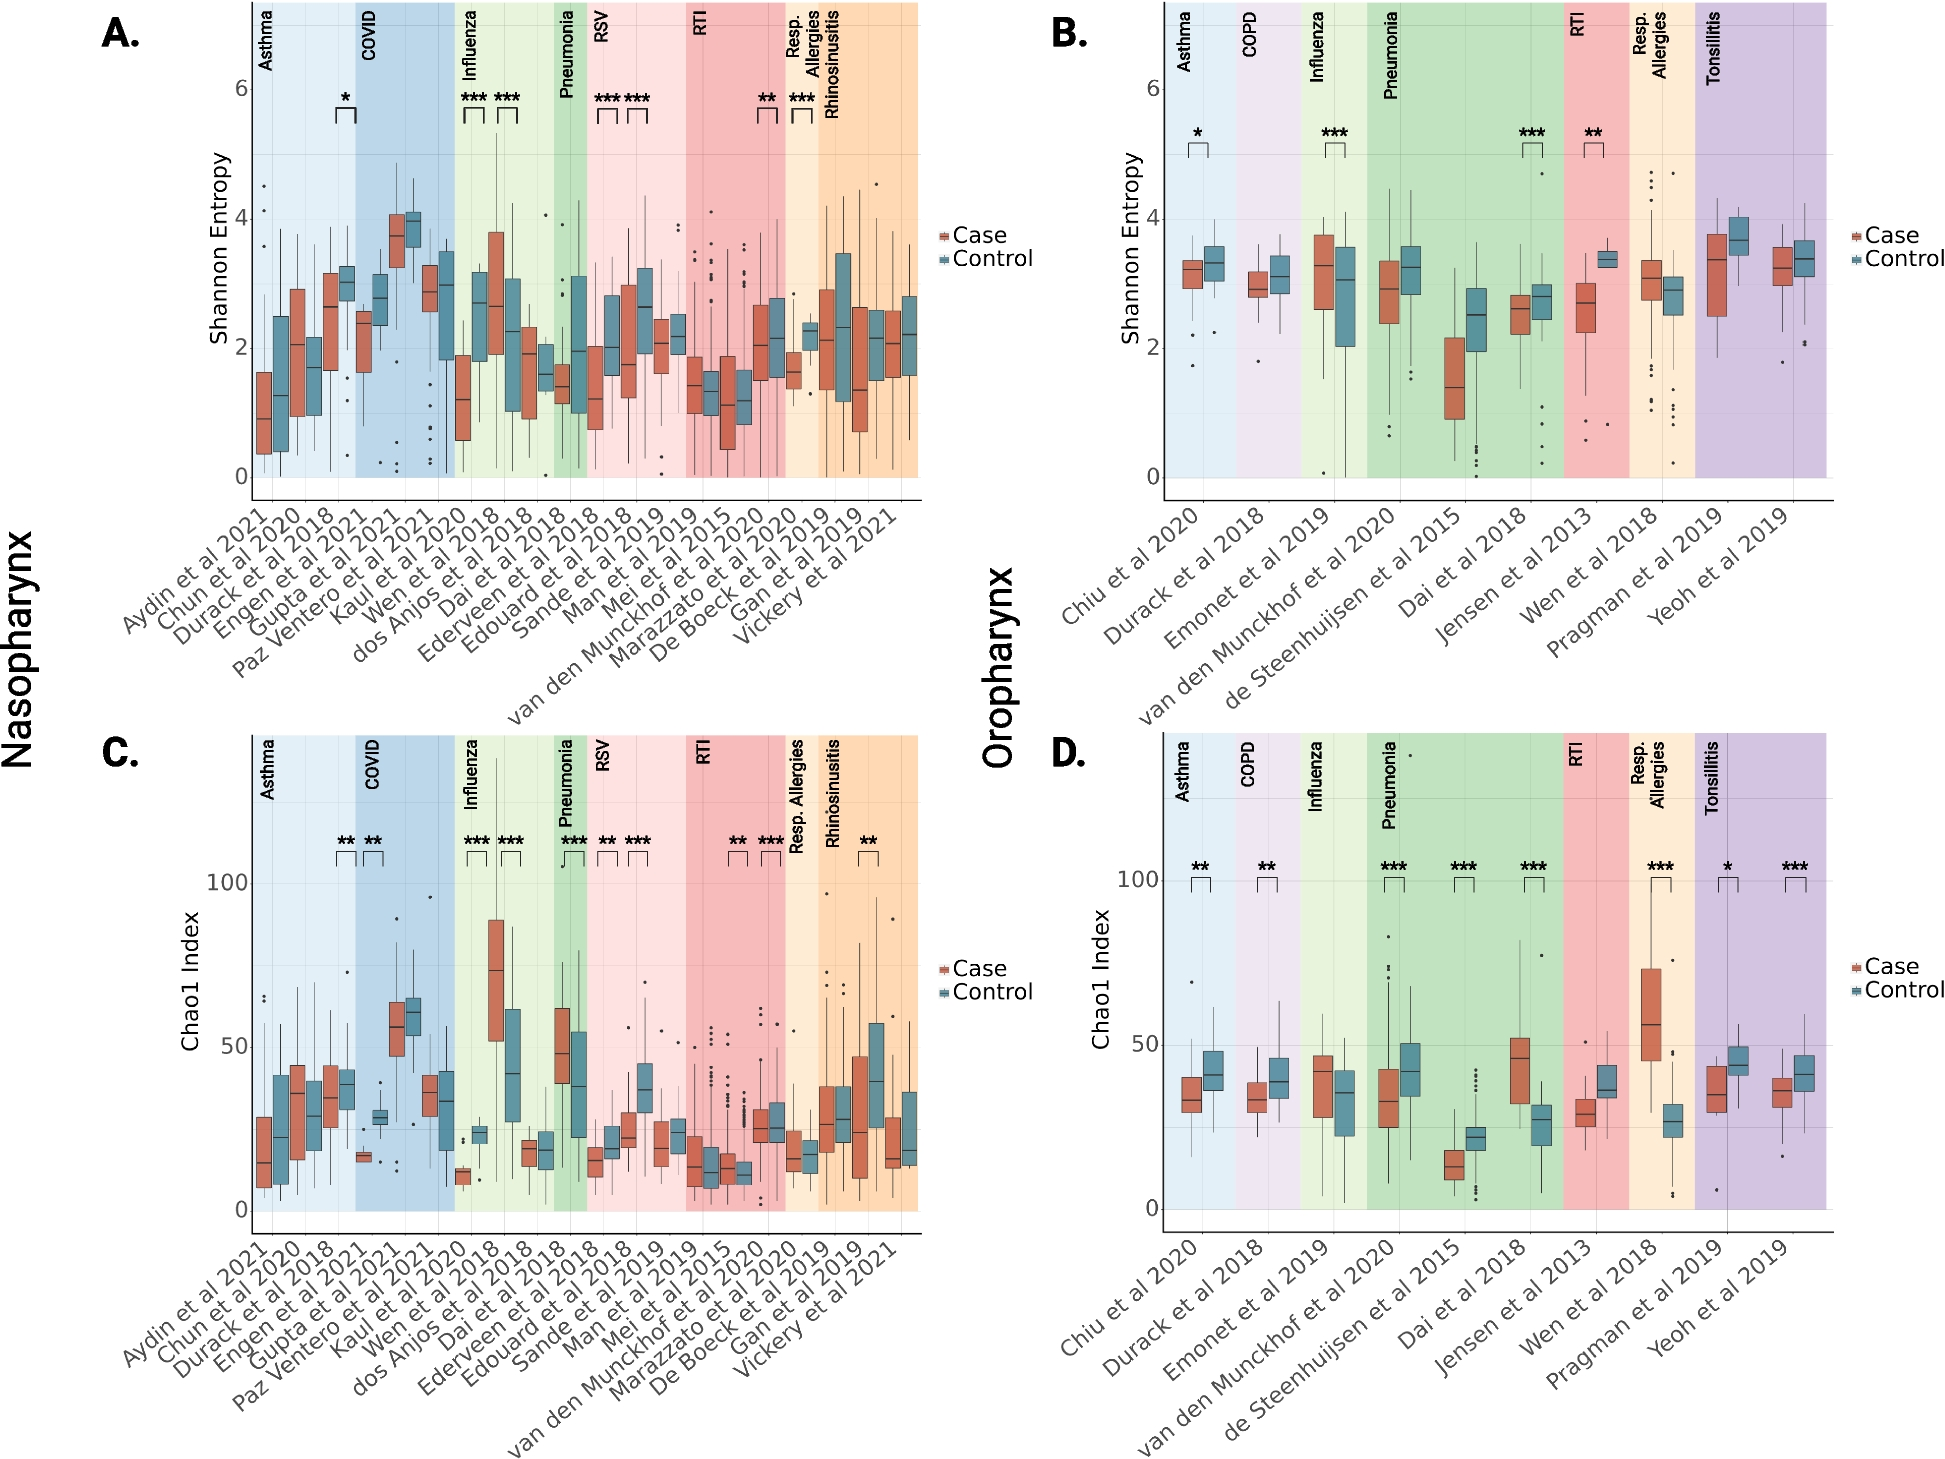
Fig. 2
3D analysis of ommatidia size and shape in male and female D. simulans M3 and D. mauritiana RED3. a Synchrotron radiation microtomography analyses of males and females show a gradient from smaller to larger ommatidia from dorsal to anterior-ventral. D. simulans M3 females and especially males show an overall shift to smaller ommatidia compared to D. mauritiana RED3. b Analysis of ommatidia numbers show similar ommatidia numbers in females of both species and fewer ommatidia in males in line with overall smaller eye size. c 3D reconstruction of the optic lobe (lamina, medulla, lobula, and lobula plate) of a male D. mauritiana RED3. d Volume analysis of optic lobe neuropil sizes show a similar pattern to ommatidia number differences (b) between sexes and strains: males of D. simulans M3 and D. mauritiana RED3 have generally smaller neuropils, most evident in lamina and medulla (n (a–d) = 3). e, f Shape analysis of frontal (yellow) and central (green) ommatidia reveals separate clustering of frontal and central ommatidia for both species. n = 30. Data points are provided in Fig. 2 synchrotron analysis.xlsx and Fig. 2 morphometric analysis.xlsx on figshare [29]
To test whether larger eyes of D. mauritiana were an effect of overall larger body size, we also measured second-leg tibia length, which have been previously used as a proxy for body size [16, 30, 31] and the length of the L3 wing vein as an estimate of overall wing size [32]. The tibia of D. mauritiana were not generally larger than the tibia of D. simulans (Additional File 3: Fig. S2), suggesting the increase in eye size has evolved independently of body size [16, 17, 28]. Consistent with this, tibia size was only positively correlated with eye size in a subset of strains in both species (Additional File 4: Fig. S3). Interestingly, wing size is generally smaller in D. mauritiana strains, and we found strain-specific positive, negative, or no correlation with eye size (Additional File 5: Fig. S4).
While some D. simulans and D. mauritiana strains overlap in either ommatidia area or number, none of the strains overlapped in both parameters, leading to the clear separation of the species in eye composition (Fig. 1). Previously, a large-effect quantitative trait locus has been identified that explains about 30% of the eye size difference between D. simulans and D. mauritiana [17, 26] due to differences in ommatidia area. However, the functional consequences for vision in these flies remain unknown. To test this, we selected strains D. simulans M3 and D. mauritiana RED3 which have very similar ommatidia numbers but significantly different mean ommatidia (facet) areas (Fig. 1). We first performed detailed 2D and 3D morphological analysis of optical parameters of these focal strains to model their vision, and subsequently tested our predictions with behavioural experiments.
Facet size and shape change in a dorsal to ventral-anterior gradient across species and sexesDrosophila compound eyes are 3D structures that are roughly shaped like a hemisphere. To analyse optical parameters across the entire eye, we used synchrotron radiation microtomography to collect high-resolution 3D image data of entire eyes and associated brain structures in D. simulans M3 and D. mauritiana RED3 (Fig. 2). Automated segmentation and measurement of individual facets for three individuals of each species and sex revealed a size gradient from smaller dorsal-posterior to larger anterior-ventral facets in both focal strains and both sexes (Fig. 2a). Facet size was overall smaller in D. simulans M3 and the size difference between females and males was more pronounced in D. simulans M3 compared to D. mauritiana RED3 (Fig. 2a). Comparison of ommatidia number differences and neuropil volumes indicates similar patterns between sexes and strains. Lamina and medulla in males are generally smaller in line with lower ommatidia numbers (Fig. 2b–d).
Additionally, we used geometric morphometric analysis of facet shapes to compare central ommatidia to frontal ommatidia in both sexes of D. simulans M3 and D. mauritiana RED3 (Fig. 2e, f): the six corners of each facet were landmarked and analysed via principal component and hierarchical clustering analysis. We recovered three clusters, which can be interpreted as three distinct facet shapes. Clusters 1 and 2 contained only frontal lenses, and cluster 3 contained only central lenses indicating that the position of the facet within the eye influences lens shape. Frontal lenses (clusters 1 + 2) were defined by longer dorsal and ventral edges (PC1 = 87.3% variation) than central lenses (cluster 3). Within the frontal lenses, PC2 (4.5% variation) and PC9 (< 1% variation) separated clusters 1 and 2, with cluster 1 being slightly elongated along the antero-posterior axis. There were no differences in sex (chi-square = 0.07, df = 2, p = 0.967) or strain (chi-square = 2.74, df = 2, p = 0.254) between clusters, implying that these factors do not influence facet shape.
D. mauritiana RED3 has greater optical sensitivity than D. simulans M3, especially in the frontal and ventral visual fieldTo compare the optical capacity of both fly strains and their variation across the visual field, we implemented the open-source Python-based automated pipeline ODA [33], which estimates the location and approximate orientation of each lens with high resolution across the eye. This generated eye maps of the volume (Additional File 6: Fig S5a), diameter (Additional File 6: Fig S5b), cross-sectional area (Additional File 6: Fig S5c), and length (Additional File 7: Fig S6a) of the corneal lenses of the ommatidia and the mean IO angle of each lens with its nearest neighbours (Additional File 7: Fig S6b). Three male and three female eyes were scanned from both D. simulans M3 and D. mauritiana RED3. The coordinates were rotated manually to align the eye equators horizontally, visible as a horizontal band of smaller ommatidia in Fig. 3a (and Additional File 7: Fig. S6a, b, and c). This area projects roughly onto the visual horizon during flight [34] and marks the region of the eye where rows of ommatidia initiated and grew during eye development, establishing a line of mirror symmetry about which rhabdomere arrangements flip vertically [35]. To compare the change in these parameters from the posterior to the anterior eye, we used ordinary least squares to fit an affine function of azimuth and compared the resulting slope parameters for each subject.
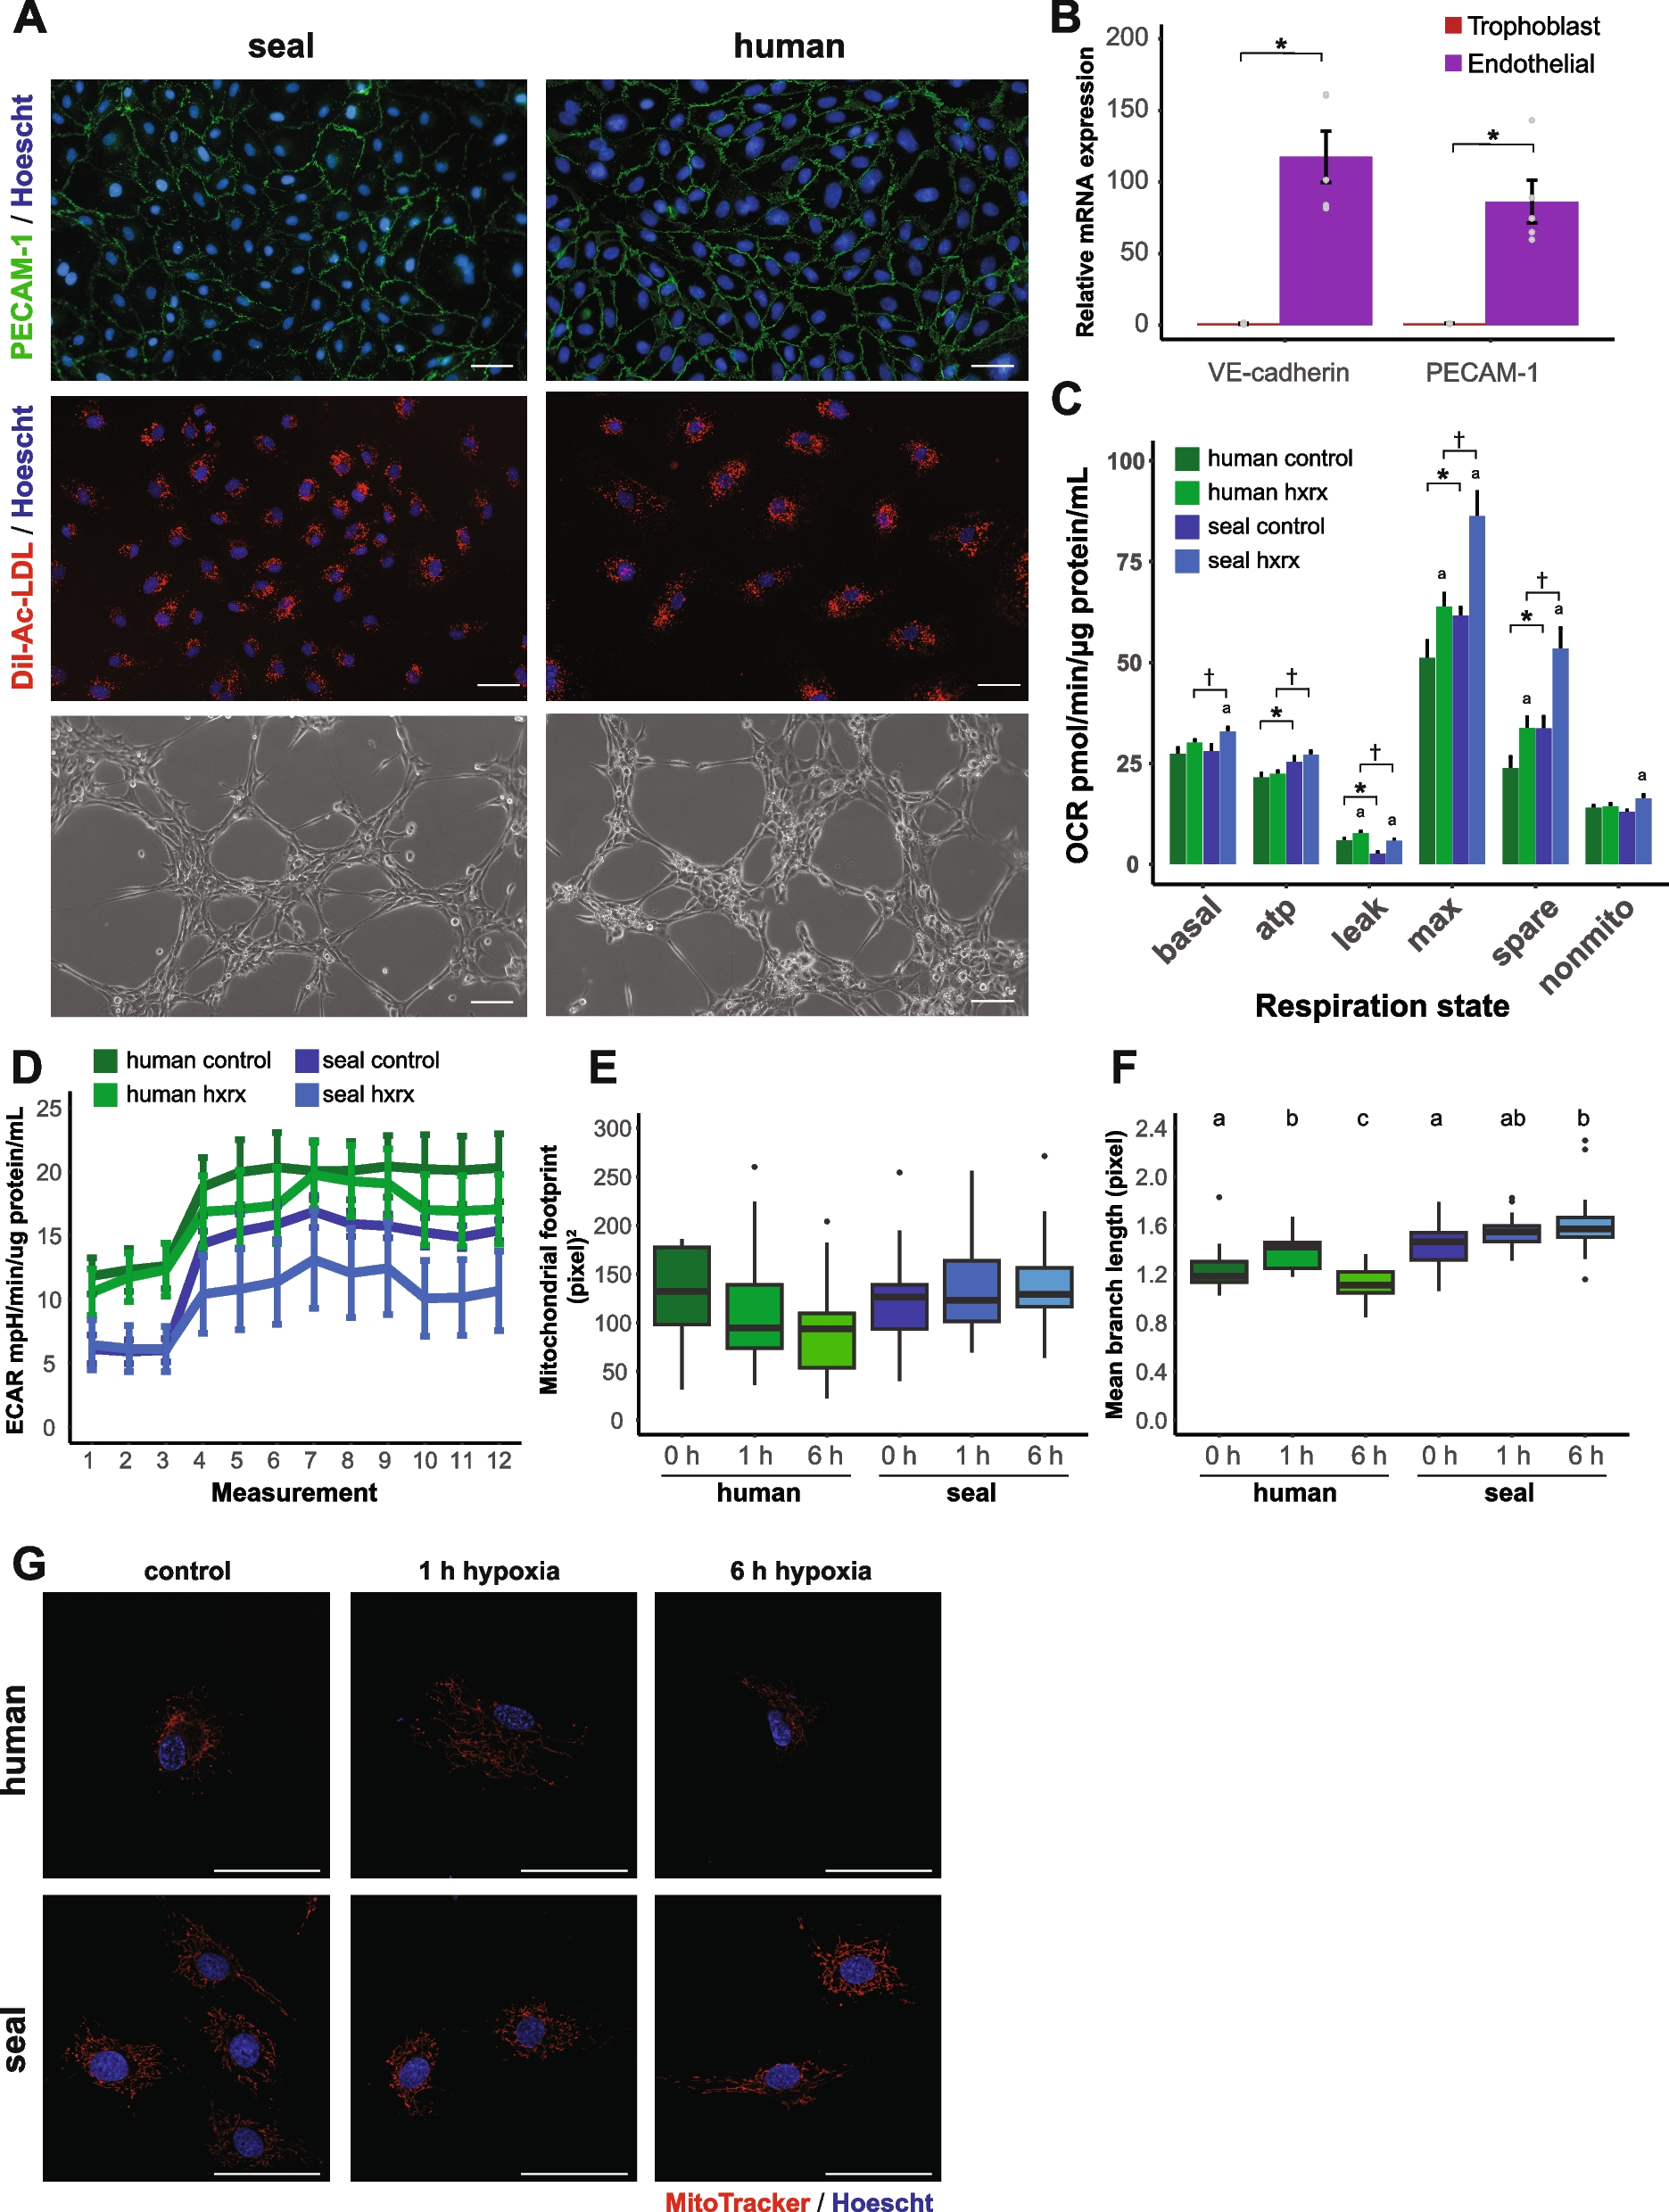
Fig. 3
3D analysis of optic parameters in D. simulans and D. mauritiana eyes. a–d Ommatidial lens volumes from 3 males and 3 females from each of the two species. Eye maps show the smallest and largest eye of each of the two species, which also happen to be one male and female of each. Each dot of the scatter plot represents the location of an individual ommatidium in polar coordinates coloured by its 3D volume according to the colour scale indicated in the x- and y-axes of b and c. Line colours in b and c and dot colours in d indicate the fly’s rank in order of eye size per species, such that the darkest one is the largest eye of that species. The volume data is divided into 20 evenly spaced bins of elevation (b) and azimuth (c) with error bars indicating 3 times the standard error of the mean. d Ordinary least squares were used to regress lens volume on azimuthal position to estimate and compare the azimuthal slope of lens volume between the two species. The resulting slope coefficients from those models are plotted. e–h IO angle from three males and females from each of the two species, plotted as in a–d except for the elevation plot in f. The IO angle value used for each lens represents the average IO angle between that lens and all immediate neighbours. f The same IO angle data from e but sampling ommatidia from a narrow vertical band between 0 ± 15° azimuth. Note that this is different from b, c, and g because plotting the binned averages obfuscates the horizontal band of high acuity along the equator, likely due to the large range of IO angles along azimuth. h Ordinary least squares was used to regress IO angle on azimuthal position as in d. All the eyes demonstrated negative azimuthal slopes, with no significant difference between species. i–m Scatterplots of total lens count (i), mean lens diameter (j), median IO angle (k), median equatorial IO angle (l), and IO angle interquartile range (m) plotted along the y-axes and their allometric relationship to the surface area of their eye along the x-axis. Lines in the 2D scatter plots represent the predicted mean and the bands represent the 95% CI of the mean based on ordinary least squares regression of each y variable on surface area. Note that simple group differences based on ANOVA are indicated in the left margins and group differences after accounting for surface area using linear regression are indicated at the top of each scatterplot with the following key: * = p < .05, ** = p < .01, and *** = p < .001. Data provided in Fig. 3_share.zip on figshare [29]
Both D. simulans M3 and D. mauritiana RED3 eyes have the largest lenses in the frontal visual field just below the eye equator (Fig. 3a). For both species, lens volume increases with elevation, peaks just below the eye equator, and then decreases steadily (Fig. 3b). In D. mauritiana RED3 this increase is greater, starting at similar volumes at the dorsal and ventral extremes but increasing to larger maxima near the equator than D. simulans M3. Lens volume for both species decreases along elevation until a minimum around − 45° and then increases, peaking at the anterior extreme (Fig. 3c). Moreover, in 5 of the 6 size-ordered pairs, D. mauritiana RED3 have significantly greater lens volumes than D. simulans M3 for every azimuthal bin (Additional File 6: Fig S5a). Lens volume for all eyes has a positive azimuthal slope, but the slope for D. mauritiana RED3 was significantly greater than D. simulans M3 (t(10) = 2.3, d = 1.5, p = 0.043). This is consistent with measurements of lens diameter (Additional File 6: Fig S5b), cross-sectional area (Additional File 6: Fig S5c), and length (Additional File 7: Fig S6a), except that the azimuthal slope only differed for lens diameter (t(10) = 2.3, d = 1.4, p = 0.047) but not for either cross-sectional area (t(10) = 1.4, d = 0.9, p = 0.18) or length (t(10) = 1.9, d = 1.2, p = 0.08). Overall, this means that D. mauritiana RED3 have larger, broader, longer, and wider-spread ommatidial lenses than D. simulans M3, which could improve sensitivity in general, and especially in the frontal visual field below the eye equator. This increase in ventral optical sensitivity is also greater in D. mauritiana RED3 than D. simulans M3 and is predicted to improve the detection of low-contrast objects below the visual horizon, such as rotting fruit or other oviposition sites.
D. mauritiana RED3 and D. simulans M3 have higher spatial acuity along the eye equatorIO angles are largest at the posterior and peripheral extremes, reaching a minimum around 45° azimuth along the eye equator (Fig. 3e, f). For both species, IO angle stays relatively constant—remaining between 4° and 6° from about − 45° to 45° elevation—except for dramatic increases at the ventral and dorsal extremes and a region of smaller IO angles around the eye equator (Fig. 3f). D. mauritiana RED3 ranges less in IO angle than D. simulans M3 reaching smaller maxima in the top and bottom of the eye (≤ 15° versus ≤ 25°). For both species, IO angle decreases along azimuth from a maximum in the posterior extreme (≤ 15°) to a minimum around 45° azimuth (≥ 4°; Fig. 3g). We found no significant difference between species in the azimuthal profile or slope (Fig. 3g, h). Because spatial resolution is limited inversely by IO angle, maximum spatial resolution in both species is highest around 45° azimuth and 0° elevation, along the eye equator. This increase in equatorial spatial resolution might be an adaptation to terrain statistics of different habitats [33, 36], and due to the horizontal band of smaller ommatidial diameters at the eye equator formed during eye development [37, 38]. Regardless, this would improve the resolution of small objects near visual horizon, a feature that would help in avoiding predators and locating oviposition sites.
Eye allometry in D. mauritiana RED3 prioritises contrast sensitivity more than D. simulans M3In holometabolous insects, body size and the size of organs derived from imaginal discs depend on, and are proportional to, environmental factors like temperature and food availability during larval development [39, 40]. In flies, larval feeding has been shown to affect eye size, ommatidia size, and ommatidia count [41]. As a result, variation in eye size and composition may reflect rearing differences. To address this, we modelled the scaling relationships between eye surface area and the following measurements: total lens count, mean lens diameter, median IO angle, median equatorial (elevation = 0 ± 15°) IO angle, and IO angle interquartile range (Fig. 3i–m).
Eye surface area (SA) is an ideal reference for allometric scaling because it is proportional to the rate of light absorption of the entire eye. Also, because the ommatidial lenses almost completely cover the surface of the eye, the mean lens area (A) is approximately SA divided by the number of lenses (N), A ≈ SA / N, implying that SA ≈ N × A. This equation is approximate because we estimated A by assuming circular facets even though facet shapes vary. Because the number of discernible brightness levels is proportional to lens area, SA is also proportional to the total number of images the eye can resolve, its spatial information capacity [42]. Using ordinary least squares, we regressed each measurement on the sum of eye area and a dummy-coded species variable (Additional File 8: Table S2). We performed post hoc pairwise t-tests to compare means between species, defining the interspecific difference as D. mauritiana RED3–D. simulans M3, such that significant positive values mean that D. mauritania RED3 was greater than D. simulans M3 and vice versa for negative values. All models were a good fit, explaining a substantial proportion of the variance in SA plus the species variable (R2 = 0.65–0.97, F = 8–159, P ≤ 0.01).
Lens count and size had significant positive slope coefficients, such that larger flies have more and larger ommatidia in both species. However, lens count and lens diameter had significant interspecific differences after accounting for SA, but lens count was greater for D. simulans M3 and lens diameter was greater for D. mauritiana RED3. Therefore, D. mauritiana RED3 have lower ommatidial density than D. simulans M3. Conversely, the interquartile range (IQR) of lens diameters has a significant negative slope and a significant positive interspecies difference, implying that D. mauritiana RED3 lens diameters are more variable than D. simulans M3 after accounting for eye size. This is consistent with the lens volume eye maps discussed above, which found a greater range of lens sizes in D. mauritiana RED3 than D. simulans M3 along elevation, generally larger ommatidia for every azimuthal bin, and a greater azimuthal slope.
For both general and equatorial IO angles and comparison across both species, the slope coefficient was significant and negative, meaning that median angles scale inversely with eye size. However, the interspecific difference was only significant for median equatorial IO angles, such that D. mauritiana RED3 has significantly greater equatorial IO angles than D. simulans M3 after accounting for SA. Because spatial resolution is inversely proportional to IO angle, D. simulans M3 has greater spatial resolution at the eye equator but similar resolution elsewhere. The IQR of IO angles had an insignificant slope coefficient and a significant but negative interspecific difference, meaning that D. simulans M3 have a greater range of IO angles. This is consistent with the IO angle eye maps above, which found a greater range in the elevation profiles of IO angle in D. simulans M3 (Fig. 3f). The increase in IO angles near the boundaries of the eye should effectively increase the field of view (FOV) of the eye. Overall, these allometric relations suggest that D. mauritiana RED3 prioritise optical sensitivity more than D. simulans M3, which instead prioritise spatial resolution along the visual horizon and FOV at the peripheral extremes.
D. mauritiana RED3 and D. simulans M3 optomotor responses trade off contrast sensitivity and spatiotemporal resolutionOur morphological analysis suggested that D. simulans M3 have higher spatial acuity due to smaller IO angles for equatorial ommatidia and D. mauritiana RED3 have higher optical sensitivity due to larger facet apertures, particularly in the central visual field just below the horizon. However, neural summation can recover sensitivity loss due to suboptimal optics by effectively sacrificing temporal or spatial resolution [41]. To measure the ethological implications of these optical differences, we used the flies’ optomotor response in a virtual reality flight simulator that allowed the presentation of different sinusoidal gratings moving to the left or right (Additional File 9: Fig. S7). Using a wingbeat analyser, we measured the flies’ steering effort in response to gratings of various contrasts, spatial frequencies, and temporal frequencies sorted randomly. Contrast sensitivity is defined here as the reciprocal of the lowest discernible contrast, and both spatial and temporal acuity are defined by the maximum discernible frequency. Assuming that the IO angle limits the maximal spatial sampling or resolution of the eye according to the Nyquist limit, such that the highest possible discernible frequency, fs, for a hexagonal lattice is given by the following equation: fs = 1/√3 * Δɸ−1. So, for every fs, there is a corresponding ideal IO angle, Δɸ = 1/√3 * fs−1.
In the flight arena, D. simulans M3 and D. mauritiana RED3 traded off between higher contrast sensitivity and spatiotemporal tuning (Fig. 4). In accord with their larger ommatidia, D. mauritiana RED3 demonstrated higher contrast sensitivity (0.14−1 = 7.4) than M3 (0.27−1 = 3.7). Conversely, the spatial tuning curves demonstrate that D. simulans M3 has a higher spatial acuity (0.1 cpd) than D. mauritiana RED3 (0.08 cpd), implying smaller IO angles (~ 5.8° versus ~ 7.2°) consistent with smaller measured IO angles in the eye equator of D. simulans M3. D. simulans M3 also responded with greater strength around 0.04 cpd, likely supported by their wider peripheral IO angles and greater IQR. Lastly, D. simulans M3 demonstrated higher temporal acuity, 50 Hz, than D. mauritiana RED3, 20 Hz. Overall, this demonstrates sharper (higher spatial acuity) and faster vision (higher temporal acuity) in D. simulans M3 but a greater ability to compare brightness values (higher contrast sensitivity) in D. mauritiana RED3.
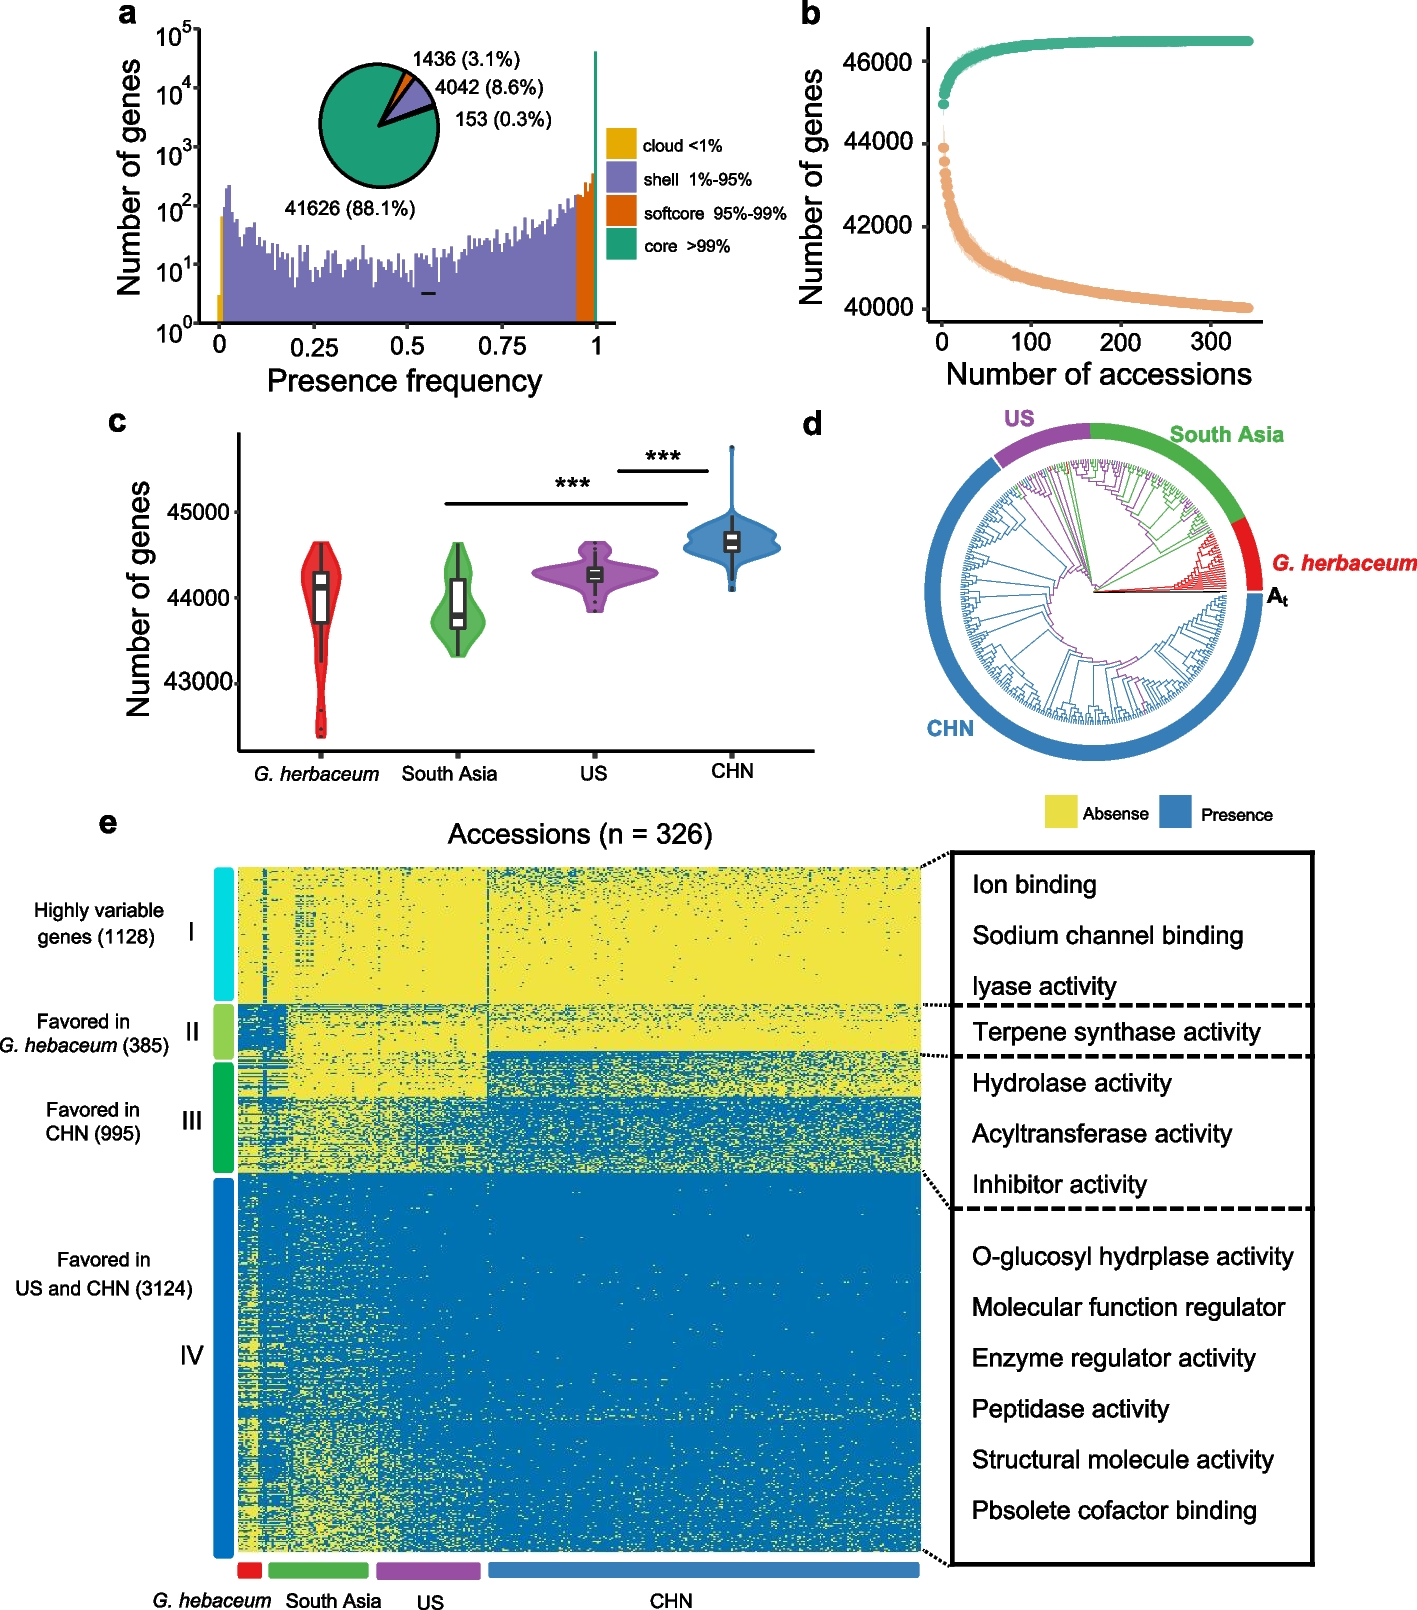
Fig. 4
Behavioural measurement of D. simulans and D. mauritiana contrast sensitivity, spatial resolution, and temporal resolution. Gratings of various contrasts (a–c), spatial frequencies (d–f), and temporal frequencies (g–i) were presented to 3 males and 3 females from each of the two species in a rigid tether flight simulator equipped with a wingbeat analyser. The gratings were filtered through a Gaussian window and remained still for .2 s before moving to the left or right, indicated by the dotted line. For each subject, responses to leftward moving gratings were averaged with responses to the same grating moving rightward so that positive values represent mean steering in the direction of the grating (red or blue) and negative represents counter steering (grey). Mean normalised responses taken between .5 and 1.25 s were baseline corrected, subtracting the mean response during the .1 s before the onset of motion. Two of these ranges are indicated by annotations in a and b. connected by dashed arrows to their mean in c. Sample sizes are indicated in the bottom left corner of the colourmaps. The images of gratings in the bottom of c, f, and i are meant to give a sense of the change in the stimulus along the x-axis. Green arrows indicate the change in speed of the grating, ft/fs, which remains constant in the contrast experiment, decreases in the spatial frequency experiment, and increases in the temporal frequency one. a–c As contrast increases, RED3 begins responding significantly at .14 (red arrow in c) and M3 at .27 (blue arrow in c). d–f As spatial frequency increases and therefore rotational velocity decreases, mean responses decrease gradually until the Nyquist limit determined theoretically by the IO angle, reducing the contrast for higher frequencies as a result of aliasing. This limit differed between the two species, with RED3 responding significantly to spatial frequencies as high as .08 CPD (red arrow in f) and M3 as high as .1 CPD (blue arrow in f). g–i As temporal frequency and therefore rotational velocity increases, mean responses increase until they reach the Nyquist limit determined by the temporal resolution of the optomotor response, reducing the contrast for higher frequencies. M3 demonstrated higher temporal acuity, responding significantly to frequencies as high as 50 Hz (blue arrow) while RED3 stopped at 20 Hz (blue arrow). Data provided in Fig. 4_share.zip on figshare [29]
留言 (0)