Unless otherwise stated, all chemicals were purchased from Sigma‐Aldrich/Merck Chemical Company.
Experimental design
To study the intrafollicular P4 effects on oocyte developmental competence, follicular cells gene expression and sEVs miRNA profile during the same estrous cycle stage (late diestrus – 11 to 16 days), slaughterhouse ovaries were collected in pairs (from the same cow) based on CL morphology (the CL exhibits a tan or orange color, without any discernible rupture point), as previously described [23] (Supplementary Figure S1). To obtain groups with different intrafollicular P4 concentrations based on CL presence, follicles measuring 3-6mm from ovaries either ipsilateral (Ipsi) or contralateral (Contra) to the CL were individually aspirated. This procedure was repeated in six biological replicates, each consisting of two to four pairs of ovaries, to obtain follicular fluid (iFF and cFF, respectively) and the P4 levels were evaluated in each group. A total of 254 COCs from Ipsi and 215 COCs from Contra follicles were morphologically evaluated and used for in vitro embryo production. Gene expression analysis (six biological replicates from each group) was evaluated in cumulus cells from five immature COCs per replicate and two pools of granulosa cell sheets (five sheets/pool) per replicate. Additionally, FF sEVs from each group were isolated and characterized by nanotracking analysis (NTA). Additional samples of sEVs were used to western blot, and transmission electron microscopy. A panel of 382 bovine miRNAs was analyzed in FF sEVs from six biological replicates (the same samples used for NTA analysis).
Collection of ovarian follicular fluid
Pairs of ovaries were collected from a slaughterhouse near to Pirassununga region in the state of São Paulo and transported to the laboratory in saline solution within 3 h. Only pairs of ovaries that presented CL with morphological characteristics related to the late diestrus stage were used. Briefly, we used pairs of ovaries with the CL color ranging from orange to yellow in the external parenchyma with absence of large follicles (>8 mm). In this stage, cows present high and stable systemic progesterone concentration [23]. The follicular fluid from both groups (iFF and cFF) were aspirated with an 18G needle and 10 mL syringe and processed by differential centrifugation before freezing in freezer at -80°C until further use.
Hormonal analysis, and groups formation
To characterize the different P4 intrafollicular environments and similar follicular health, P4 and E2 concentration from iFF and cFF were measured using the chemiluminescence assay (ADVIA Centaur-Siemens, Henkestr, Erlangen, Germany). Intraassay coefficients variations of P4 and E2 in follicular fluid were, 9.77 ng/mL and 11.06 ng/mL, respectively.
Oocyte, cumulus and granulosa cells collection
The follicular aspirate from Ipsi and Contra follicles was deposited in a 100 mm petri dish, and pools of granulosa cell sheets and COCs were recovered with the aid of a stereoscope. COCs were initially washed and selected in TCM199 medium (GIBCO), buffered with HEPES (20 mM) supplemented with BSA (1%), sodium pyruvate (0.2 mM), and gentamycin (50 µg/mL). Finally, COCs were morphologically classified as previously described [24]. Briefly, the COCs were classified into grade 1 (G1), grade 2 (G2), grade 3 (G3), and non-viable oocytes (G4, and denuded). For the cumulus cells collection, ~20% of the cumulus cells layers of five immature G1 COCs per replicate were individually dissected with a 30G needle. The cumulus and granulosa cells were stored freezer at 80°C until further use.
In vitro embryo production
Groups of COCs (n~25) were distributed into 100 µL of IVM medium drops composed of TCM199 buffered with 22 ug/mL of sodium bicarbonate supplemented with 0.4% of BSA, 0.5 μg/mL of follicle stimulating hormone, 5 UI/mL of human chorionic gonadotropin, 0.2 mM of sodium pyruvate and 50 μg/mL of gentamicin sulfate, under mineral oil. COCs were incubated at 38.5ºC, 5% CO2 in atmospheric air, and controlled humidity for 22-24 hours. After maturation, in vitro fertilization (IVF) was performed in IVF medium (TALP-IVF supplemented with 6mg/mL of BSA, 22 ug/mL of sodium pyruvate, 50 μg/mL of gentamicin, 5.5 UI/mL of heparin, 2mM of penicillamine, 1mM of hypotaurine and 245uM of epinephrine). COCs were distributed (n~25) in 100 µL of IVF drops, under mineral oil. Frozen semen was thawed at 36ºC and centrifuged in discontinuous Percoll (45-90%) at 3600 x g for 7 min. The supernatant was discarded, the pellet resuspended in IVF medium and, centrifuged at 520 x g for 5 min. Finally, the semen pellet was adjusted to a concentration of 5x10³ sperm per oocyte and was distributed among drops of IVF medium within COCs. The COCs were co-incubated for fertilization at 38.5ºC, 5% CO2 in atmospheric air, and controlled humidity for 18 h. The same semen batches were used in all experiments.
After fertilization, the presumptive zygotes were partially denuded by vigorous pipetting into the IVF drops and distributed (n~20) in drops (100 µL) of in vitro culture (IVC) medium (SOFaaci supplemented with 8mg/mL of BSA, 22 ug/mL of sodium pyruvate, and 50 μg/mL of gentamicin), under mineral oil and incubated at 38.5ºC, 5% CO2, 5% O2 and 90% N2 and controlled humidity. Next, 168 hours after IVF, the blastocyst rate was evaluated.
Isolation of small extracellular vesicles from follicular fluid
The sEVs were isolated as previously described [25]. Briefly, 200 µL of iFF or cFF were centrifuged at 300 x g for 10 min, 2,000 x g for 10 min, and at 16,500 x g for 30 min, to remove live cells, cellular debris, and large vesicles, respectively. The remaining supernatant was placed in freezer at −80°C for further analysis. Upon use, supernatant was filtered through a 0.2 µm filter (PES membrane; Corning) and ultracentrifuged (Optima XE-90 Ultracentrifuge; rotor 70 Ti; Beckman Coulter) at 119.700 x g for 70 min twice to obtain an enriched pellet of sEVs. All centrifugation steps were performed at 4°C. The pellet was resuspended in 50 µL of phosphate-buffered saline (1× PBS Ca2+/Mg2+-free; 137 mM NaCl, 2.7 mM KCl, 10 mM Na2HPO4, 2 mM KH2PO4) and used for further analysis.
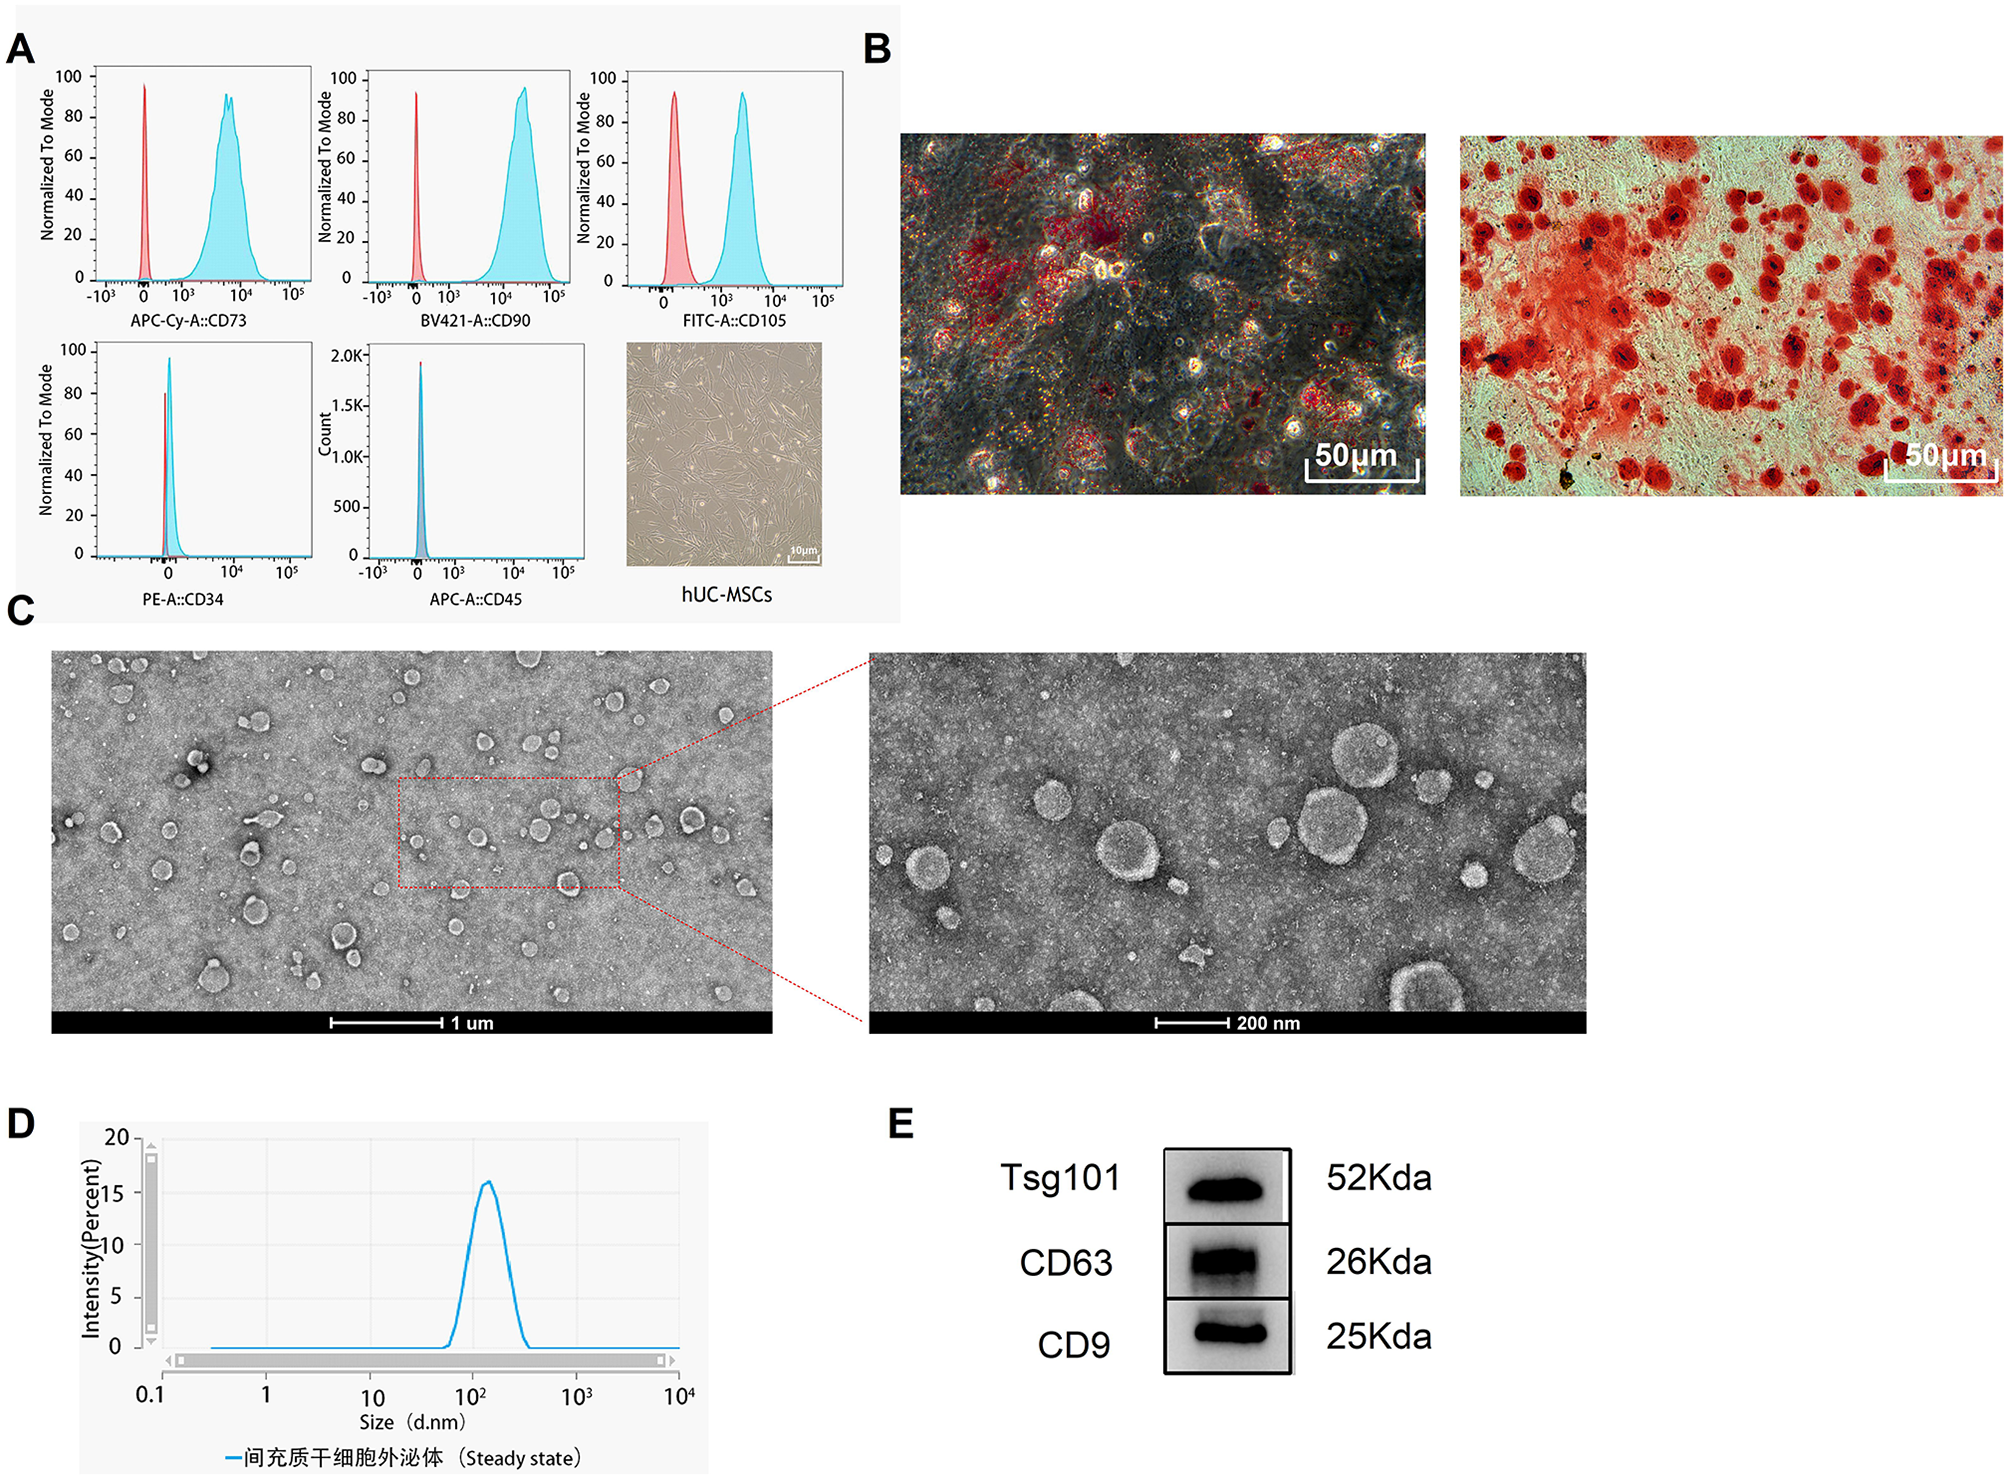
Characterization of small extracellular vesicles
The characterization of sEVs isolation is a fundamental step to demonstrate the efficiency of the isolation protocol and to determine the presence of a sEVs enriched solution. The FF sEVs were characterized by particle size and concentration using nanoparticle tracking analysis (NTA), evaluation of specific and absent proteins was performed by western blotting analysis, and morphology by transmission electron microscopy (TEM).
Nanoparticle tracking analysis
Small extracellular vesicles pellet of iFF or cFF follicles of each replicate was resuspended in 50 µL of 1× PBS Ca2+/Mg2+-free. The concentration was adjusted for each sample and was measured using Nanosight (NS300; NTA 3.1 Build 3.1.45, Malvern, UK). The FF sEVs analysis by Nanosight was based on five videos of 30 seconds each. After recording these images, the equipment's software calculates size and concentration. Analyses were performed at 38.5°C, at the camera level 12, and threshold of 5 for all samples.
Western blot analysis
To conduct western blot analysis 500 µL of FF were used to obtain an enriched pellet of sEVs. The total protein (50 µg) from FF sEVs and follicular cells were isolated using RIPA (radioimmunoprecipitation assay) buffer and proteinase inhibitor cocktail and mixed with 4× Laemmli and beta-mercaptoethanol (Bio-rad, Hercules, CA). For protein denaturation, samples were incubated at 95°C for 5 min and loaded onto an SDS-PAGE 10% polyacrylamide gel. The gel run was performed at 100 V for 2 hours, and the protein samples were transferred onto a PVDF (Polyvinylidene Difluoride) membrane (1704156; Bio-RAD) at 80 V for 2 hours in a wet transfer apparatus. The protein membrane was washed three times in 1× Tris-buffered saline with Tween-20 (TBST) and incubated in a blocking buffer (5% of Non-Fat Dry Milk in TBST) at room temperature for 1 hour. The membrane was incubated overnight with a primary antibody at 4 °C. The proteins Alix (ALG-2 interacting protein X) and Tomm20 (translocase of outer mitochondrial membrane 20) were evaluated using a rabbit antibody against a peptide corresponding to an internal region of human Alix/ PDCD6IP (1:3000; SAB4200476; Sigma–Aldrich Chemical Company, St. Louis, MO) and a mouse monoclonal antibody raised against amino acids 1-145 of Tomm20 of human origin (1:6000; SC- 17764; Santa Cruz, CA), respectively. After incubation, the membrane was washed three times using 1× TBST for 5 min each and then incubated with secondary antirabbit (1:4000; A0545; Sigma–Aldrich Chemical Company, St. Louis, MO), and antimouse (1:4000; #7076S; Cell Signaling Technology, Danvers, Massachusetts, USA) antibody conjugates in horseradish peroxidase for 1 h at room temperature. Finally, the membrane was washed three times using 1× TBST and exposed to a detection solution (170–5060; Clarity Western ECL). The images were obtained using the ChemiDoc MP Image System (Bio-Rad, Hercules, CA).
Transmission electron microscopy (TEM)
An enriched pellet of sEVs was obtained from 100 µL of FF and used for the TEM analysis. The pellet (40 µL) was diluted in 400 µL of fixative solution (0.1 M cacodylate; 2.5% glutaraldehyde and 4% paraformaldehyde at pH 7.2–7.4) and incubated for 2 h at room temperature. To obtain sEVs fixed pellet, the solution was diluted in 2 mL of 1× PBS Ca2+/Mg2+-free and ultracentrifuged at 119.700 x g for 70 min, at 4°C. Next, sEVs pellets were diluted in 30 μL of milli-Q water and placed in a pioloform‐coated copper grid for approximately 60 min at room temperature. After completely dried, 2% of uranyl acetate was added to the grid for 90 s, the excess was removed with filter paper and then analyzed by TEM (FEI Tecnai 20; LAB6 emission; 200 kV).
Total RNA extraction
Total RNA extraction of cumulus and granulosa cells as well as FF sEVs were performed using TRIzol® (Invitrogen) reagent according to the manufacturer’s instruction. The aqueous phase was recovered and added 1.33 µL GlycoBlue® (15 μg/ml; Thermo Fisher Scientific) an RNA co-precipitant to increase the RNA yield. The total RNA was treated with DNase I (Invitrogen, Carlsbad, CA), according to the manufacturer’s instructions to avoid genomic DNA contamination. RNA quality and concentration were analyzed using spectrometry (NanoDrop OneC; Thermo Fisher Scientific, Frederick, Maryland, USA). RNA quality was considered good when 260/280 was >1.7 in the nanodrop analysis.
Reverse transcription, and real-time PCR
For mRNA RT-PCR, the reverse transcription reaction was performed using High-Capacity cDNA Reverse Transcription Kit (Thermo Fisher Scientific), according to the manufacturer’s protocol. For cDNA conversion, we used ~ 10 ng of the total RNA for each gene target of interest. For relative gene expression analysis, we selected genes involved in ovarian steroidogenesis, oocyte maturation, and miRNA biosynthesis pathways (Supplementary Table S1). In this analysis GoTaq qPCR Master Mix (Promega) was used according to the manufacturer’s instructions, with the following PCR cycle conditions: 95°C for 10min, 45 cycles of 95°C for 15 s, and 60°C for 60 s, followed by the melting curve.
Regarding, miRNA RT-PCR of FF sEVs, cDNA synthesis was performed using 200 ng of total RNA and with MystiCq® MicroRNA® Quantitation System (Sigma). For the relative miRNA expression analysis specific forward primers (Supplementary Table S2) were used as previously [7], the conditions were according to manufacturer’s instructions, with the following PCR cycle conditions: 95°C for 5 min, 45 cycles of 95°C for 10 s, 60°C for 30 s, and 70° for 30 s, followed by the melting curve. The levels of 383 miRNAs were evaluated in the six biological replicates per group. MiRNAs were considered exclusive when present at least in four biological samples of one group and at most in one sample of another group, or when it was present at least in three biological samples of one group and in none sample of another group.
For mRNA analysis, the amplification of single cDNA products was confirmed by the presence of a single melting peak, and for miRNA analysis, the amplification of cDNA products was confirmed by the presence of one or two melting peaks. Ct values smaller than 37 were used for both analyses. For mRNA RT-PCR, amplifications were normalized using the geometric mean of the Ct values of two endogenous genes (PPIA and YWHAZ for cumulus cells and PPIA and for granulosa cells), and for miRNA RT-PCR amplifications were normalized using the geometric mean of the Ct values of three miRNAs (miR-99b, RNU43 snoRNA and Hm/Ms/Rt U1 snRNA). All analyses were performed using 384 well plates in the QuantStudio 6 Flex (Applied Biosystems), the relative expression values were calculated using the ΔCt method, and the normalized data were transformed by 2−ΔCt for a graphical representation of the relative transcript levels. MicroRNA bioinformatic analyses were performed using Mirwalk software version 3.0. For predicted biological pathways identification we used exclusive and upregulated miRNAs of each group.
Statistical and bioinformatics analysis
The data were tested for outliers’ presence using the ROUT method and the normality for the Shapiro-Wilk test. COCs recovered and blastocyst rates were compared by Fisher test. Data of FF P4 and E2 concentration, relative expression of mRNAs in cumulus and granulosa cells, particle size, the concentration of FF sEVs, and relative expression of miRNAs were performed using Student t-test in the JMP 14 (SAS Institute Inc.) software, with a significance level of 5%.


留言 (0)