
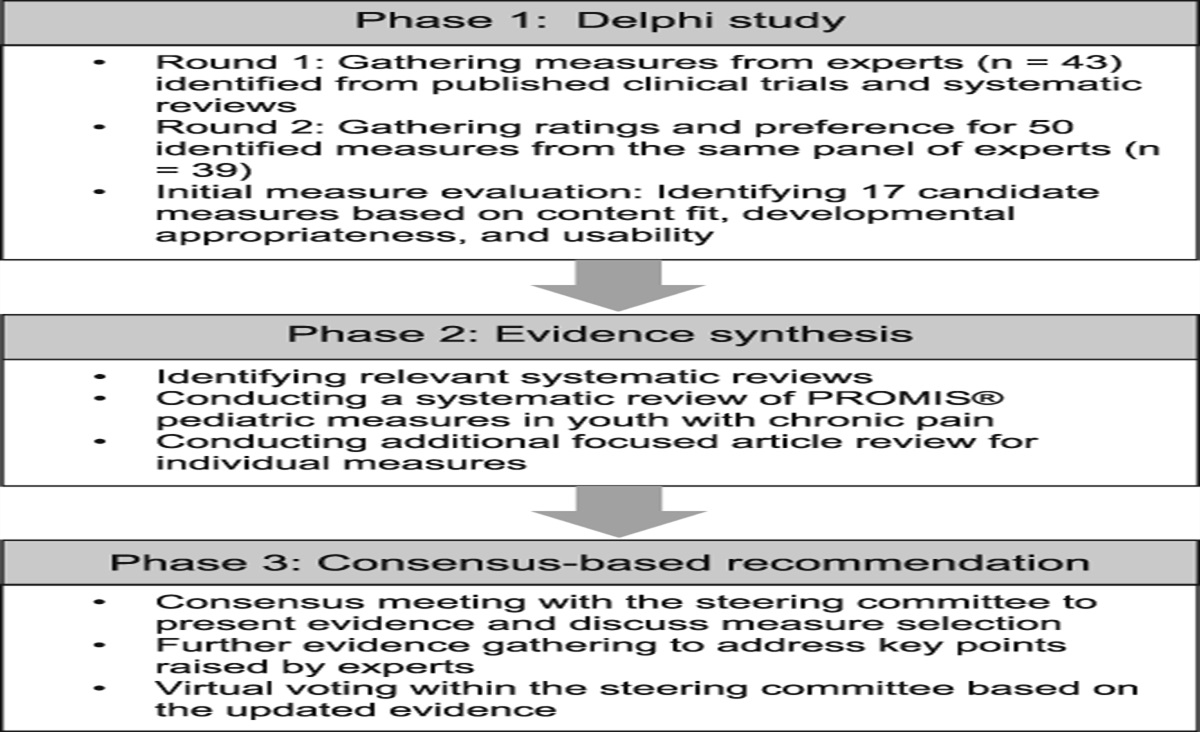
記住我


Primary nociceptors and low-threshold mechanoreceptors are usually electrically silent, but in neuropathic pain conditions, action potentials (APs) may be generated “spontaneously” to drive ongoing pain in rodents and humans.17,49,67,70,71 Electrophysiological studies have shown a link between suprathreshold spontaneous activity (SA) in dorsal root ganglion (DRG) neurons and spontaneous fluctuations of resting membrane potential (RMP). Recordings using sharp electrodes from the large cell bodies (somata) of A fibers within excised DRGs revealed high-frequency, sinusoidal oscillations that could generate regular tonic or bursting discharge.3,73 However, sharp-electrode recordings from the somata of C fibers reveal much smaller spontaneous subthreshold membrane potential fluctuations which fail to reach AP threshold because shunting around the impaling electrode dramatically reduces input resistance in smaller cells—an effect that has probably led to an underestimate of how common somally initiated SA is in nociceptors. Whole-cell patch recording (with gigaohm membrane seals) from somata of dissociated C-fiber neurons reveals much larger spontaneous fluctuations of RMP that may reach AP threshold in painful conditions.52,62 These fluctuations differ from the sinusoidal oscillations in A-fiber somata in their lower frequency and irregular properties. Amplitudes both of the sinusoidal oscillations in large DRG neurons3,73 and the irregular depolarizing spontaneous fluctuations (DSFs) in small DRG neurons9,43,52 increase in neuropathic pain models. Importantly, in human patients with neuropathy associated with cancer, irregular DSFs and the incidence of dissociated neurons exhibiting SA were selectively increased in cells taken from excised DRGs corresponding to painful dermatomes.50,51
Sinusoidal oscillations in large DRG neurons can be eliminated by substituting extracellular NaCl with choline-Cl and by concentrations of tetrodotoxin (TTX) that selectively block TTX-sensitive voltage-gated sodium channels (VGSCs).3,73 Blockers of voltage-gated calcium channels (VGCCs) and voltage-gated potassium channels had no effect on the oscillations.2,3 This suggested a mechanism in which subthreshold sinusoidal oscillations are generated by reciprocating actions of depolarizing currents through TTX-sensitive VGSCs and steady repolarizing current through potassium leak channels.40,41 By contrast, mechanisms underlying irregular DSF generation have not been reported for any neuron type.67
Because of the prominence of DSFs in nociceptors and their close association with multiple forms of neuropathic pain in rodents and humans,6,9,43,51,52 we have investigated the contributions of passive membrane properties and of different ions and ion channels to the generation of DSFs in nociceptors dissociated from normal, uninjured mice. While much is known about the contributions of numerous ion channels to RMP in rodent nociceptors,19 the ion channels important for DSF generation have not been identified. Our findings reveal distinctive electrophysiological properties that enable silent nociceptors to readily transition to continuing, irregular electrical activity. Spontaneous background activity of diverse ion channels permeable to Na+ or Ca2+ combined with high somal input resistance produces irregular DSFs that are poised to drive ongoing discharge under painful conditions that increase nociceptor excitability by sustained depolarization, increased activity of any of these channels, or additional increases in input resistance.
2. Methods 2.1. AnimalsAll procedures followed the guidelines of the International Association for the Study of Pain and were approved by the McGovern Medical School at UTHealth Animal Care and Use Committee. Totals of 90 male and 30 female wild-type C57BL/6 mice were included in this study. Although male and female mice were included in all experiments, this study was not designed to investigate sex differences. Thus, only large sex differences would be detected with the sample sizes used, and data from both sexes were always pooled. Weak suggestions of sex differences occurred in some of the results, and these are noted in the text. Adult mice (16-30 g, 1-5 per cage) were allowed to acclimate inside the McGovern Medical School animal research facility for at least 4 days before beginning experiments. Mice were provided with food and water ad libitum. Male and female Nav1.9+/− mice were purchased from Jackson Laboratory (B6.129P2-Scn11atm1Dgen/J Strain #: 005837). Tissue samples of offspring mice were subjected to a standard polymerase chain reaction (PCR) genotyping assay (Jackson Laboratory genotyping protocol 23186). Four male and 4 female Nav1.9−/− mice were used in this study.
2.2. Dissociation and culture of primary sensory neuronsAn in vitro preparation was used to investigate DSFs and other electrophysiological properties of dissociated mouse DRG neurons, using methods previously described.9,43 Mice were euthanized with isoflurane and intracardially perfused with ice-cold phosphate-buffered saline (PBS). Dorsal root ganglia were quickly and carefully removed and trimmed in ice-cold Dulbecco's modified eagle medium (DMEM) and digested with trypsin (0.3 mg/mL, Worthington Biochemical Corporation, Lakewood, NJ, #LS003702) and collagenase D (1.5 mg/mL, Sigma, #11088858001) for 30 minutes at 34°C. Debris was removed by 2 successive centrifugations (6 minutes at 600 rpm), and cells were plated onto coverslips coated with 0.01% poly-L-ornithine (Sigma, P4957) and incubated overnight at 37°C with 5% CO2 in serum-free DMEM.
2.3. Recording from dissociated dorsal root ganglion neuronsRecordings were made from isolated small neurons with soma diameters ≤30 µm. We did not sample larger neurons in this study because our major goal was to define mechanisms important for SA in probable nociceptors that have been linked to ongoing neuropathic pain. We were guided by in vivo recordings after spinal cord injury (SCI) in rats showing that chronic, low-frequency SA was only generated in the somata of C-fiber and Aδ-fiber DRG neurons.7 Corresponding DRG neurons in mice have soma diameters within this range. Whole-cell patch clamp recordings were performed at room temperature 18 to 30 hours after dissociation using an EPC10 USB (HEKA Elektronik, Lambrecht/Pfalz, Germany) amplifier. Patch pipettes were made of borosilicate glass capillaries (Sutter Instrument Co, Novato, CA) using a Narishige PC-10 puller and fire-polished with an MF-830 microforge (Narishige, Tokyo, Japan) to a final pipette resistance of 3 to 8 MΩ when filled with an intracellular solution composed of (in mM) 134 KCl, 1.6 MgCl2, 13.2 NaCl, 3 ethylene glycol tetraacetic acid (EGTA), 9 4-(2-hydroxyethyl)-1-piperazineethanesulphonic acid (HEPES), 4 Mg-ATP, and 0.3 Na-GTP, which was adjusted to pH 7.2 with KOH. Osmolarity was 300 mOsm. Neurons were observed at 40x magnification on an IX-71 (Olympus, Tokyo, Japan) inverted microscope and recorded in an extracellular solution (ECS) containing (in mM) 140 NaCl, 3 KCl, 1.8 CaCl2, 2 MgCl2, 10 HEPES, and 10 glucose, which was adjusted to pH 7.4 with NaOH. Osmolarity was 320 mOsm. In ion substitution experiments, the driving force for Na+ and Ca2+ currents at a holding potential of −45 mV was greatly reduced by lowering extracellular Na+ concentration to 2.2 mM (low-Na+ ECS) and combining 0 mM (nominally) extracellular Ca2+ with 1 mM EGTA (low-Ca2+ ECS). To maintain osmolarity and minimize charge screening effects, choline-Cl replaced most of the NaCl in low-Na+ ECS, and 1.8 mM MgCl2 replaced Ca2+ in low-Ca2+ ECS. Low-Na+ ECS contained (in mM) 2.2 NaCl, 137.8 choline-Cl, 3 KCl, 1.8 CaCl2, 2 MgCl2, 10 HEPES, and 10 glucose. Low-Ca2+ ECS contained 140 NaCl, 3 KCl, 3.8 MgCl2, 1 EGTA, 10 HEPES, and 10 glucose. Combined low-Na+, low-Ca2+ ECS contained 2.2 NaCl, 137.8 choline-Cl, 3 KCl, 3.8 MgCl2, 1 EGTA, 10 HEPES, and 10 glucose.
Whole-cell patch clamp recording commenced after obtaining a tight seal (>3 GΩ) and rupturing the plasma membrane under voltage clamp at −60 mV. Recordings were acquired with PatchMaster v2x73 (HEKA Elektronik). The liquid junction potential was calculated to be ∼4.3 mV and not corrected, meaning the actual potentials may have been up to ∼4.3 mV more negative than indicated in the recordings and measurements presented herein.
2.4. Quantifying depolarizing spontaneous fluctuations of membrane potentialDepolarizing spontaneous fluctuations were analyzed as previously described.52 In brief, we used a custom program (SFA_pub.py) to quantify irregular DSFs in patch recordings, imported as time and voltage coordinate data for 30 to 40 seconds periods from recordings obtained with PatchMaster sampled at 10 to 20 kHz and filtered with a 2.9 kHz-Bessel filter. The program used a sliding median function to calculate RMP at each point and return coordinates, amplitudes, and durations of identified APs, DSFs (minimum amplitude 1.5 mV, minimum duration 5 ms), and hyperpolarizing spontaneous fluctuations of membrane potential (HSFs), as well as a continuous color-coded plot of membrane potential generated using the matplotlib library (Python v3.6, Python Software Foundation, Beaverton, OR).52 Manual inspection of each plot confirmed that each AP was generated by a suprathreshold DSF. Conservative estimates of the amplitudes of suprathreshold DSFs were measured as the most depolarized potential reached by the largest subthreshold DSF recorded at the indicated holding potential.52 During DSF analysis, APs were substituted by the largest subthreshold DSF measured within the same 30 to 40 seconds of recording period. Recordings with higher frequency firing rates (>0.5 Hz over the entire period) were excluded because of interactions of DSFs with AP afterhyperpolarizations and because fewer large subthreshold DSFs are available for measurement when most of the larger DSFs are suprathreshold.
2.5. Low-frequency voltage clampThis method was used to prevent slow changes in membrane potential without attenuating DSFs. Low-frequency voltage clamp (PatchMaster v2x73, HEKA Elektronik) acts as a current clamp for faster signals and a voltage clamp for slower signals, using a low-pass filtered recording of membrane potential as a constant averaged command voltage to control feedback injection of current to maintain the set holding potential. We chose an effective feedback speed of ∼3 seconds, which adequately clamped the holding potential without producing detectable effects on DSFs or APs. In these studies, we clamped the holding potential to ∼-50 mV or ∼-45 mV.
2.6. Pharmacological agentsIon channel blockers, including ProTX II, ononetin, CBA, and ZD-7288, were purchased from Tocris Bioscience; gadolinium chloride, L-703606, and capsaicin from Sigma-Aldrich; TTA-P2 and ω-conotoxin GVIA from Alomone Labs; A-967079 and Pico-145 from MedChemExpress; A-803467 from Apexbio Technology LLC; AMG-9810 from Cayman Chemical Company; nimodipine from Ascent Scientific Ltd.; choline-Cl from MP Biomedicals; EGTA from Fisher Scientific. Stock solutions (3 µM-100 mM) were made in aqueous solvents or were prepared in dimethyl sulfoxide (DMSO) at a concentration at least 1000 times higher than the final solution that was diluted in ECS. Drugs were applied through a gravity-driven multioutlet device with the selected outlet placed ∼50 μm away from the cell being recorded. Solutions were applied at approximately 0.25 mL/minute in a recording chamber volume of 3.5 mL. All recordings were made at room temperature (22-23°C).
2.7. Data analysisStatistical analyses of raw electrophysiological data and SFA_pub.py output were performed using Prism V9.5.1 (GraphPad Software, La Jolla, CA). Averages are presented as mean or median values. All data sets were tested for normality with the D'Agostino Pearson omnibus normality test. Normally distributed data were tested with parametric tests: either paired or unpaired t tests or 1-way analysis of variance for repeated measures followed by Tukey multiple comparisons test. In some cases, Bonferroni corrections were made for multiple comparisons. Single comparisons of data that were not normally distributed were tested with a Mann-Whitney U test. Statistical significance was set at P < 0.05, and all reported values are 2-tailed. Specific statistical tests corresponding to each figure are listed in the figure and table legends.
3. Results 3.1. Dissociated mouse dorsal root ganglion neurons exhibit high input resistance across a wide range of membrane potentialsBy Ohm's Law, the amplitudes of fluctuations in membrane potential occurring spontaneously in dissociated nociceptor somata under whole-cell current clamp are determined by changes in the product of the net current flowing across the plasma membrane and the neuron's input resistance. Higher input resistance will increase changes in membrane potential caused by spontaneous opening and closing of ion channels in the soma membrane. We measured input resistance in nonaccommodating (NA) DRG neurons52 (the vast majority of neurons sampled) under whole-cell current clamp at holding potentials of approximately −70, −60, and −50 mV, spanning much of the range of RMP in dissociated mouse nociceptors.9,43 Conventional measurement of input resistance using a series of increasingly negative 500-millisecond constant-current pulses (−5 pA increments) evoked hyperpolarizations that were similar for the same currents injected from each holding potential (Fig. 1A) and showed little voltage dependence (Fig. 1B). The hyperpolarizing voltage changes corresponded in most cases to an input resistance of 3 to 4 GΩ, which is quite high compared with values reported for most neurons during whole-cell patch recording (see Discussion). As expected, input resistance showed a negative correlation with input capacitance (Fig. 1C), which is a measure of total membrane area and is correlated with soma diameter.
 Figure 1.:
 Dissociated mouse DRG neuron somata exhibit high input resistance across a wide range of holding potentials. (A) Representative examples of voltage responses to constant current pulses of negative and positive current (5-pA increments) delivered under whole-cell current clamp from holding potentials of approximately −70, −60, and −50 mV. Increasingly negative steps were delivered first, followed by increasingly positive steps, and each sequence began with a 0-pA sweep. Input resistance (Rin) was calculated from the minimum hyperpolarizing potential (excluding sag) or the plateau value in each depolarizing potential. The response to the positive 5-pA step in each set of traces is colored red. The 5-pA response on the left shows an apparent DSF superimposed on the depolarizing plateau. Estimates of the plateau values used to calculate Rin excluded any obvious DSFs. (B) The left panel shows the mean voltage responses for all neurons tested (n = 37 for each holding potential), revealing a relatively linear voltage-current (V-I) relationship for hyperpolarizing pulses and smaller, nonlinear voltage responses for depolarizing pulses. The right panel plots the mean Rin calculated for each current pulse and holding potential. (C) Inverse correlation between Rin and input capacitance (Cin) for the neurons in parts A and B (n = 59). Pearson correlation, r = −0.6355, P < 0.001. (D) Example of voltage responses to positive constant current pulses used to calculate Rin and determine rheobase. The calculated Rin and corresponding depolarization for each neuron tested are shown for the 5-pA pulse (n = 148) (E) and 10-pA pulse (n = 200) (F). The median value for all neurons in each case is indicated by the red line and interquartile range by the blue lines. DRG, dorsal root ganglion; DSF, depolarizing spontaneous fluctuations; Rin, input resistance; Vh, holding potential.
Depolarizing spontaneous fluctuations are significant for pain because they can bridge the gap between RMP and AP threshold to drive ongoing discharge in nociceptors. Thus, the effective input resistance between RMP and AP threshold, ie, as measured with depolarizing pulses, is most important for DSF function. As shown in Figures 1A and B, positive current pulses produced depolarizations that exhibited a nonlinear voltage dependence, as would be predicted by the expression in DRG neurons of numerous voltage-gated ion channels that open in response to depolarization, thereby decreasing input resistance but potentially triggering active responses that lead to AP generation. Interestingly, the smallest applied depolarizing pulse, 5 pA, rarely evoked APs (Fig. 1A) while producing a steady-state depolarization of ∼10 mV from each of the tested holding potentials (Fig. 1B), representing an input resistance of ∼2 GΩ in this voltage range. A 10-mV depolarization would correspond to a very large DSF amplitude in mouse DRG neurons.9,43 To expand the number of neurons sampled for input resistance analysis in the depolarized subthreshold voltage range, we made use of the test pulses serving to measure rheobase and to distinguish NA neurons from rapidly accommodating (RA) neurons,52 which included 2-second depolarizing steps of 5 and 10 pA (Fig. 1D). These pulses produced median steady-state depolarizations of 8.0 and 12.6 mV, respectively, corresponding to median input resistances of 1.6 and 1.3 GΩ (Figs. 1E and F), confirming the DRG neurons' high input resistance in the voltage range where large DSFs can sometimes reach AP threshold. No significant differences were found in the input resistances of neurons taken from male mice (median 2.7 GΩ, n = 39) and female mice (3.5 GΩ, n = 20) using hyperpolarizing pulses (Fig. 1C), or with depolarizing pulses (eg, for the 10-pA pulse, males, 1.3 GΩ, n = 114; females, 1.2 GΩ, n = 86, Fig. 1F), Mann-Whitney U test in each case. Dorsal root ganglion neurons, including those with soma diameters <30 µm, include subpopulations with heterogeneous functions and various molecular signatures.23 We do not know whether high input resistance at membrane potentials approaching AP threshold is only found in specific types of DRG neuron, and we did not test for capsaicin sensitivity in the experiments summarized in Figure 1. However, in closely related experiments (Section 3.5), we found >70% of neurons sampled were excited by capsaicin (see also Ref. 7), suggesting that peptidergic nociceptors (representing the vast majority of TRPV1-expressing DRG neurons in mice14,64) have high input resistance in this voltage range, although other types might also have this property.
3.2. Depolarizing spontaneous fluctuations in dissociated mouse dorsal root ganglion neurons exhibit irregular waveform propertiesAs previously shown in mice, dissociated small and medium-sized DRG neurons exhibit irregular, spontaneous, subthreshold fluctuations of membrane potential across a wide range of RMPs (−40 to −80 mV), which increase in amplitude under neuropathic conditions (SCI and chemotherapy models).9,43 However, the waveforms, frequencies, durations, and patterns of occurrence of DSFs were not described. Representative waveforms observed in raw recordings from neurons with smaller and larger spontaneous fluctuations of membrane potential, respectively, are illustrated in Figures 2A and B. Peak-to-peak amplitude variation was 2.0 mV and 8.2 mV in these 2 samples. Also evident are the large ranges of (1) positive and negative peak values, (2) intervals between peaks, and (3) waveform durations, as well as apparent summation of waveforms. We then recorded from a nonexcitable cell type, cultured primary human umbilical vein endothelial cells (HUVECs), exhibiting high input resistance (∼2 GΩ)65 similar to what we found in mouse DRG neurons. The high input resistance and depolarized RMP in HUVECs reflect the very low resting current through available K+ channels and paucity of other open channels.65 We found slow peak-to-peak fluctuations of ∼1.5 mV in HUVECs (Fig. 2C), which are smaller than most of the peak-to-peak fluctuations recorded from mouse NA neurons under identical conditions (eg, Figs. 2A and B and see below). The fluctuations observed in HUVECs and DRG neurons are almost devoid of typical signs of electrical noise, including very high frequency spikes or 60 Hz hum, indicating that much of the fluctuating signal is biological. Furthermore, when extracellular Na+ and Ca2+ were reduced (see section 3.4), peak-to-peak fluctuations often were <1 mV, indicating that an analytic cut-off ≥1 mV peak-to-peak would safely avoid electrical noise components to reveal biological fluctuations.
 Figure 2.:
 Irregular properties of spontaneous fluctuations of RMP in dissociated mouse DRG neuron somata. (A) Example of a neuron with smaller fluctuations. Note the irregular waveforms, amplitudes, and interpeak intervals. (B) Example of a neuron with larger fluctuations that also are highly irregular. (C) Example of spontaneous fluctuations in a nonexcitable HUVEC cell having an input resistance similar to that of smaller mouse DRG neurons. DRG, dorsal root ganglion; DSF, depolarizing spontaneous fluctuation; HUVEC, human umbilical vein endothelial cell; MP, membrane potential; RMP, resting membrane potential.
To quantify DSF properties, we used an automated algorithm to selectively measure the depolarizing fluctuations relative to a sliding median computed for RMP,52 as shown in Figure 3A. As performed previously for mouse, rat, and human DSFs, we set a minimum cut-off of 1.5 mV deviation from the sliding median (corresponding to ∼3 mV peak-to-peak), which is well above the electrical noise level and above nearly all the peak-to-peak fluctuations observed in HUVECs (Fig. 2C). Depolarizing spontaneous fluctuations accepted for analysis are colored red. Larger DSFs were defined as those >3 mV (green dashed line). Also indicated are hyperpolarizing spontaneous fluctuations (HSFs, colored blue), which were not analyzed in this study. The ranges and median values of the amplitudes, frequencies, and durations of DSFs recorded at RMP under current clamp are shown in Figures 3B, C, and D. A small sex difference was suggested by significantly lower median DSF amplitudes in samples from females (1.9 mV, n = 29) vs males (2.1 mV, n = 2.1 mV, P = 0.01), but this difference may be explained by a larger median input capacitance in the female than male samples (19.8 vs 15.7 pF, P = 0.02) (Mann-Whitney U test in each case). In the neurons taken from previously uninjured mice, DSF amplitude was not significantly correlated with RMP (Fig. 3E, see also Refs. 9,52), while DSF frequency was positively correlated (Fig. 3F) and DSF duration was negatively correlated with RMP (Fig. 3G).
 Figure 3.:
 Basic properties of DSFs recorded in DRG neurons dissociated from previously uninjured mice. (A) Automated measurement of DSFs. The original recording is shown above the output of the program used to compute the sliding median of the fluctuating RMP (black line) and to measure DSFs and hyperpolarizing fluctuations (HSFs) having minimum absolute amplitudes of 1.5 mV (red and blue segments, respectively). The green line shows the running 3 mV value used to define larger DSFs. Measured fluctuation properties revealed considerable variation across the neurons tested (n = 79) in DSF amplitude (B), DSF frequency (C), and DSF duration (D). Red lines indicate medians, blue lines interquartile range. Each data point (not shown) used to construct the violin plot represented the mean value for all DSFs recorded from 1 neuron across 30 to 40 seconds. Relationships to the RMP of each recorded neuron are shown for DSF amplitude (E), DSF frequency (F), and DSF duration (G). Red dashed lines show linear regression. P values were derived from Pearson correlation, r = 0.4439 (F) and r = −0.2426 (G). DRG, dorsal root ganglion; DSF, depolarizing spontaneous fluctuation; MP, membrane potential; RMP, resting membrane potential.
3.3. Input resistance and depolarizing spontaneous fluctuation amplitude are increased in dorsal root ganglion neurons exhibiting spontaneous activityIn previous studies of SCI, we found the incidence of dissociated rodent DRG neurons exhibiting SA to be greatly increased by SCI (usually exceeding 50%), but a lower incidence of SA (usually <20%) sometimes occurs in neurons from previously uninjured, naïve animals.5,7,9,52 Interestingly, the electrophysiological properties of SA neurons examined previously from naïve and SCI rats did not differ, suggesting that while SCI potently induces a hyperactive state that can drive SA at RMP in nociceptors, the same state is occasionally induced in neurons from uninjured animals,7 perhaps in response to injury signals produced during DRG excision and neuronal dissociation.77 Thus, we asked how electrophysiological properties of DRG neurons from previously uninjured mice might differ in neurons with and without SA. Classification of the neurons into the SA or No SA (silent) groups was based on whether any spontaneous APs occurred at the neuron's RMP during the early 60-second monitoring period before subsequent tests. Indeed, we found some mouse DRG neurons had SA resembling the SA previously examined after SCI9 (Fig. 4A). These SA neurons in previously uninjured mice had significantly depolarized RMP compared with neurons without SA (Fig. 4B), their input resistance was significantly greater (Fig. 4C), and their rheobase (the current needed to reach AP threshold during prolonged depolarization) was significantly lower (Fig. 4D), all of which are likely to contribute to the hyperactivity of these neurons. In the No SA group but not the SA group, neurons from female mice (n = 58) had significantly lower input resistance when tested with 10 pA pulses (P = 0.005, Mann-Whitney U test) than neurons from male mice (n = 70). This suggests a possible sex difference in nociceptor input resistance, although at least part of the difference in these samples might have resulted from larger input capacitance in the female than male groups (medians, 17.5 pF vs 16.0 pF).
 Figure 4.: DRG neurons from previously uninjured mice can exhibit SA similar to that reported in neuropathic pain conditions. (A) Example of an SA neuron and its measured DSFs. The color scheme is the same as in Figure 3A. (B) Significant depolarization of RMP of SA neurons (n = 58) compared with neurons lacking SA (“No SA” group, n = 178). (C) Significant enhancement of input resistance in SA neurons (n = 37) vs No SA (n = 91) neurons. (D) Significant reduction of rheobase in SA neurons (n = 56) vs No SA neurons (n = 176). Red lines indicate group medians, blues lines interquartile range. Each data point used to construct the violin plots represented the mean value for all DSFs recorded from 1 neuron across 30 to 40 seconds. Each group comparison was made using a Mann-Whitney U test. DRG, dorsal root ganglion; DSF, depolarizing spontaneous fluctuation; MP, membrane potential; Rin, input resistance; RMP, resting membrane potential; SA, spontaneous activity.
Because of the correlation between SA incidence and DSF amplitude found in rat and human DRG neurons,51,52 we predicted that DSFs in mouse DRG neurons would be enhanced in SA neurons held at membrane potentials where APs are rarely generated but where the largest DSFs can sometimes reach AP threshold. We found previously that the incidence of neurons exhibiting AP generation (ongoing activity, OA) during prolonged artificial depolarization under current clamp to approximately −45 mV (as might occur during inflammation in vivo69) provides a highly sensitive and physiologically relevant measure of hyperexcitability in mouse and rat DRG neurons.9,45 Thus, we measured DSFs in neurons held at potentials of either −45 or −50 mV for 40 seconds. Holding potentials of −50 mV were used when any discharge occurring at a holding potential of −45 mV was of sufficient frequency (≥2 Hz) to interfere with measurement of DSFs. A few neurons that had RMPs positive to −45 mV were excluded so that none of the tested neurons had to be artificially hyperpolarized from their RMP to the test holding potential. Because some neurons depolarized slowly during prolonged current clamp, and both SA incidence and large DSF frequency increase at depolarized RMPs,52 in these and the following experiments on DSFs we stabilized holding potentials for long periods (up to several minutes) by using low-frequency voltage clamp to prevent slow changes in membrane potential while minimally affecting DSFs and APs (Fig. 5A). We tested DSFs at holding potentials of −45 or −50 mV, but classification of the neurons into the SA or No SA group was based on whether any spontaneous APs occurred at the neuron's RMP before the other electrophysiological tests.
 Figure 5.:
 Hyperactive DRG neurons dissociated from previously uninjured mice have larger DSFs than electrically silent neurons from the same mice. (A) Example of a neuron exhibiting ongoing AP discharge (spontaneous activity, SA, a measure of hyperactivity) when held under low-frequency voltage clamp at ∼−50 mV. The red line in the top panel indicates the changes in membrane current (negative is inward) associated with the imposed slow clamp of holding potential. The asterisk in the lower panel shows the largest DSF measured in this 10-second example. Because APs are triggered by the largest DSFs and they obscure the peaks of suprathreshold DSFs, we conservatively estimated the amplitudes of all suprathreshold DSFs to be equal to the largest subthreshold DSF measured across the entire 30 to 40 seconds of the recording period. Note in both panels that APs and DSFs show little apparent difference from those recorded under current clamp (see preceding figures). (B) Significantly enhanced DSF amplitudes in SA neurons compared with No SA neurons, both for smaller (left panel, n = 49 vs 203, respectively) and larger DSFs (right panel, n = 47 vs 182, respectively). (C) Significant alterations in the frequency of smaller and larger DSFs in SA neurons vs No SA neurons (n = 48 vs 202, respectively, left and right panels). Red lines indicate group medians, blue lines interquartile range. Each point used to construct the violin plots represented the mean value for all DSFs recorded from 1 neuron across 30 to 40 seconds. Each group comparison was made using a Mann-Whitney U test. AP, action potential; DRG, dorsal root ganglion; DSF, depolarizing spontaneous fluctuation; MP, membrane potential; SA, spontaneous activity.
We found that DSF amplitudes were significantly greater in SA neurons than in No SA neurons during 40-second recordings at potentials clamped to −45 or −50 mV for both the smaller (1.5-3 mV) and larger (>3 mV) DSF amplitudes (Fig. 5B). In addition, the frequency of larger DSFs (>3 mV) was significantly higher in SA than No SA neurons (Fig. 5C). These results are likely to be consequences of an SA state in which (1) input resistance is increased (Fig. 4C), enhancing the amplitudes of all DSFs produced by spontaneous inward currents, and (2) spontaneous inward currents are increased, more so for larger DSFs (16% median DSF amplitude increase) than smaller DSFs (9% increase) (Fig. 5B). The simultaneous decrease in frequency of smaller DSFs and increase in frequency of larger DSFs is consistent with voltage-dependent mechanisms. Specifically, an increase in the number of DSFs that normally would be <1.5 mV but exceed that cut-off in the SA state (shifting to the 1.5-3 mV group) is evidently outweighed by the number of DSFs that normally would be 1.5 to 3 mV but shift to the >3 mV group. This suggests that the SA state increases spontaneous inward currents through voltage-gated channels that are more active during more depolarized fluctuations.
3.4. Depolarizing spontaneous fluctuation generation depends on extracellular Na+ and is influenced by extracellular Ca2+Our focus in this study is on the transient depolarizing phase of DSFs, which is important for driving membrane potential to AP threshold in at least some spontaneous pain conditions (see Discussion). In principle, depolarization can be produced by decreasing resting outward current or by increasing inward current. In this article, we examine the contributions to DSFs from classes of channels that normally conduct inward current in the voltage range between RMP and AP threshold.
We tested the likely importance of extracellular Na+ or Ca2+ for DSF generation by sequentially perfusing DRG neurons with normal ECS, followed by solutions deficient in extracellular Na+ or Ca2+, then by a solution largely lacking both cations, and finally by repeating perfusion with the first 2 solutions. Membrane potential was held at −50 mV or −45 mV by low-frequency voltage clamp. After perfusion with normal ECS (perfusion 1), the neurons were perfused with a low-Na+ ECS (perfusion 2) that contained only 2.2 mM Na+ (with the remainder substituted by choline+), bringing the Na+ reversal potential close to the holding potential, thus greatly decreasing the driving force on Na+. The calculated reversal potential was approximately −45 mV, assuming the intracellular concentration was equal to the pipette concentration of 13.8 mM Na+. Compared with ECS (perfusion 1), the mean amplitudes of smaller DSFs (1.5-3 mV) and larger DSFs (>3 mV) were not reduced significantly in low-Na+ ECS (perfusion 2) (Figs. 6A–C). Low-Na+ ECS significantly decreased the frequencies of smaller DSFs but not larger DSFs compared with ECS perfusion 1 (Figs. 6A, D, E), indicating that extracellular Na+ contributes less to the larger DSFs than to the smaller DSFs. When the neurons were then exposed to low-Na+-low-Ca2+ solution (perfusion 3, 2.2 mM Na+ and ∼0 mM Ca2+ plus 1 mM EGTA), all the larger DSFs were eliminated along with the vast majority of smaller DSFs (Figs. 6A, C, D, E). Subsequent perfusion with low-Na+ ECS (perfusion 4) and then with ECS (perfusion 5) reinstated both smaller and larger DSFs, and the larger DSFs showed a trend to rebound with larger amplitudes and higher frequencies (Figs. 6A–E). These results reveal a dependence of the smaller DSFs (1.5-3.0 mV, representing a majority of all DSFs analyzed) on Na+ influx. Unexpectedly, attenuated APs often appeared during the rebound in the low-Na+ ECS, and full APs often appeared during perfusion 5 with ECS (Fig. 6A). Comparing only the neurons that exhibited any APs during any of the 5 sequential perfusion conditions (8 of 11 neurons tested), 3 of 8 neurons exhibited APs in low-Na+ ECS before perfusion with low-Na+/low-Ca2+ ECS, whereas 7 of 8 neurons did afterwards. Furthermore, 1 of 8 neurons exhibited APs in ECS before perfusion with low-Na+/low-Ca2+ ECS, whereas 6 of 8 neurons did afterwards. The DSFs and small apparent APs present in our low-Na+ solutions might be generated by channels having significant permeability to Ca2+ or to choline+.
 Figure 6.:
 DSF generation depends on extracellular Na+ and Ca2+. (A) Example of a DRG neuron perfused sequentially with solutions containing (1) ECS, (2) low-Na+ ECS (choline-Cl substituting for all but 2.2 mM of NaCl), (3) low-Na+/low-Ca2+ ECS (choline-Cl with 0 mM Ca2+ plus 1 mM EGTA), (4) low-Na+ ECS, and (5) ECS. Representative spontaneous fluctuations during 10-second samples (red bars) within each 40-second analysis window (black bars) are shown below the original recording. Attenuated APs are evident during perfusion 4. (B and C) DSF amplitudes during each analysis window across perfusions. Each dot represents the mean for one neuron. The mean DSF amplitudes for some neurons were below the minimum cut-offs (1.5 mV for smaller DSFs, 3 mV for larger DSFs), so nonparametric tests were used: Friedman tests of overall effect followed by Dunn multiple comparison tests against the first ECS value (perfusion 1) (n = 12 across all perfusions). For smaller DSFs (B) and larger DSFs (C), only the low-Na+/low-Ca2+ group (perfusion 3) differed from perfusion 1; **, adjusted P = 0.0075. (D) Large decreases in mean frequencies of smaller DSFs during low-Na+ and low-Na+/low-Ca2+ perfusions. (E) Large decrease in mean frequencies of larger DSFs during low-Na+/low-Ca2+ but not low-Na perfusions. For panels (D and E) (n = 12 across all perfusions), significant differences compared with perfusion 1 were assessed with 1-way ANOVA for repeated measures followed by Dunnett post-tests. **P < 0.01; ***P < 0.001, ****P < 0.0001. ANOVA, analysis of variance; AP, action potential; DRG, dorsal root ganglion; DSF, depolarizing spontaneous fluctuation; ECS, extracellular solution; LoNa, low-Na+ ECS; LoNaLoCa, low-Na+/low-Ca2+ ECS.
We repeated these experiments but applied low-Ca2+ ECS instead of low-Na+ ECS in the perfusion sequence (Fig. 7A). After ECS (perfusion 1), low-Ca2+ ECS (perfusion 2) had no significant effect on the amplitudes or frequencies of smaller or larger DSFs (Figs. 7B and C). Once again, however, perfusion 3 with an ECS low in both Na+ and Ca2+ reversibly eliminated all the large DSFs along with most of the smaller DSFs (Figs. 7D and E). Reperfusion with low-Ca2+ ECS (perfusion 4) and then with ECS (perfusion 5) reinstated both smaller and larger DSFs (Figs. 7B–E), with significant rebound enhancement of larger DSFs during the second ECS exposure (perfusion 5, Fig. 7E). Again, there was a trend for the incidence of neurons with APs in ECS to increase after the low-Na+/low-Ca2+ ECS perfusion (sandwiched between 2 low-Ca2+ perfusions in these cases) (1 of 8 neurons exhibiting APs in perfusion 1 vs 6 of 8 in perfusion 5). These observations, along with those described above (Fig. 6A), indicate that near-elimination of extracellular Ca2+ for 1 to 5 minutes induces a subsequent Na+-dependent state of supranormal excitability lasting at least several minutes.
 Figure 7.:
 DSF generation depends on extracellular Na+ and Ca2+ as shown by the effects of substituting extracellular Ca2+ followed by substituting both Ca2+ and Na+. (A) Example of a DRG neuron perfused sequentially with solutions containing (1) ECS, (2) low-Ca2+ ECS (0 mM Ca2+ plus 1 mM EGTA), (3) low-Na+/low-Ca2+ ECS, (4) low-Ca2+ ECS, and (5) ECS. Representative spontaneous fluctuations during 10-second samples within each 40-second analysis window are shown below the original recording. (B and C) DSF amplitudes during each analysis window across perfusions. The mean DSF amplitudes for some neurons were below the minimum cut-offs, so nonparametric Friedman and Dunn multiple comparisons tests against the first ECS value (perfusion 1) were used (n = 11 across all perfusions). For smaller DSFs (B), none of the perfusion groups differed from perfusion 1. For larger DSFs (C), the low-Na+/low-Ca2+ group (perfusion 3) differed greatly from perfusion 1; **, adjusted P = 0.0023. (D) Large decrease in mean frequencies of smaller DSFs during low-Na+/low-Ca2+ but not low-Ca2+ perfusions. (E) Large decrease in mean frequencies of larger DSFs during low-Na+/low-Ca2+ but not low-Ca
留言 (0)