
記住我
Lung cancer is one of the most common and deadly malignancies in the world.[1] In 2020, approximately 2.2 million new cases were detected worldwide, with lung cancer accounting for 18.0% of all cancer-related deaths.[2] Chemotherapy and surgery are mostly ineffective for lung cancer patients diagnosed with late stages of the disease, and the 5-year survival rate of such patients is around 16%.[3] According to a review by Flenaugh,[4] the annual contribution of China to new lung cancer cases globally is 36%. The disease burden from this disease has a great impact on the national economy, workforce, and healthcare system while causing financial hardship for patients.[4]
Ground-glass nodule (GGN) is a common radiological sign of early lung adenocarcinoma (LUAD)[1] and can be identified in 30% of pulmonary computed tomography (CT) images of lung cancer patients.[5] The pathogenesis of GGN remains unclear. Depending on the degree of tumor invasion, GGN can be classified as atypical adenomatous hyperplasia (AAH), adenocarcinoma in situ (AIS), minimally invasive adenocarcinoma (MIA), or invasive adenocarcinoma (IAC).[1,6] The World Health Organization Classification of Tumors (5th edition) has classified AAH and AIS as precursor glandular lesions, and MIA and IAC as LUADs.[7] The progression of malignancy from AAH to AIS, and then further to MIA and IAC is a dynamic process.[8] The treatment options and prognosis of different GGN classifications are quite different.[6] AAH is a small localized lesion (≤0.5 cm diameter) with Clara cells and/or atypical proliferating type II alveolar pneumocytes and is generally considered benign.[9,10] Thus, patients with AAH may not need to undergo aggressive surgery.[9] AIS was previously known as bronchioloalveolar carcinoma and is a small (≤3 cm diameter), localized adenocarcinoma with no invasion.[10,11] MIA is defined as mixed and invasive lesions, with a maximum diameter size of 5 cm.[10,11] Prior research has shown the 5-year survival rate of AIS and MIA patients after surgical resection can be up to 100%.[6,10-12] IAC is an adenocarcinoma with ≥5 cm diameter and showing invasion to the pleura, blood vessels, and even lymphatics.[12] The 5-year survival rate of IAC patients after surgical resection has been reported as 74.6%, which is lower than that of AIS and MIA patients.[6] Thus, early detection, diagnosis , and treatment of GGN are associated with good prognosis and patient outcomes.[13]
Although GGNs have the morphological and histological features of LUAD, they are different from conventional LUAD and solid nodules[14] and may be related to a subtype of indolent tumors.[14] The optimal management of GGN is based on the probability of malignancy.[5] To evaluate this, clinicians use several validated pulmonary nodule risk prediction models, with reported values for area under the curve ranging from 0.75 to 0.94. These include the Mayo Clinic,[15] Herder et al.,[16] Veterans Affairs Cooperative Study,[17] Brock University,[18] and Cleveland Clinic[19] models. Different levels of probability are associated with different management options. No additional intervention measure is required for a malignancy probability of <1%. Chest CT monitoring should be performed according to the size of the nodules for a malignancy probability of 1–5%. Three months of chest CT monitoring and/or positron emission tomography (PET)/CT imaging and/or a non-surgical biopsy are required for a malignancy probability of 5–30%. PET/CT imaging and/or a non-surgical biopsy should be applied for a malignancy probability of 30–65%, while PET/CT imaging and/or a non-surgical biopsy and/or surgical resection are needed for a malignancy probability of 65– 90%.[5] Furthermore, the early symptoms of lung tumors are sometimes unclear. Thus, early diagnosis techniques and markers have become a major focus of current lung cancer research.[20]
Several techniques and markers for early diagnosis have been used in the clinical setting, including genomics, proteomics, transcriptomics, and metabolomics.[20] Metabolomics is a specific field of molecular biology that examines the body’s biochemical reactions under the regulation of proteins and genes.[20,21] More specifically, it evaluates small molecule compounds (molecular weight ≤1500 Da) produced during metabolic processes.[20,22,23] Metabolomics has been used to identify biomarkers for many different cancer types, including breast,[24] lung,[25] bladder,[26] colorectal,[27] and gastric,[28] as well as some other tumor types.[29] Various sample types can be used for metabolomics analysis, such as serum, saliva, sputum, plasma, urine, and even breath.[30,31] In the present study, we used liquid chromatography-tandem mass spectrometry (LC-MS/MS) technology and ultra-performance liquid chromatography-mass spectrometry (UPLC-MS) based on untargeted and targeted metabolomics techniques to screen for differential metabolites and key metabolic pathways between malignant nodules and normal lung (NL) tissues.
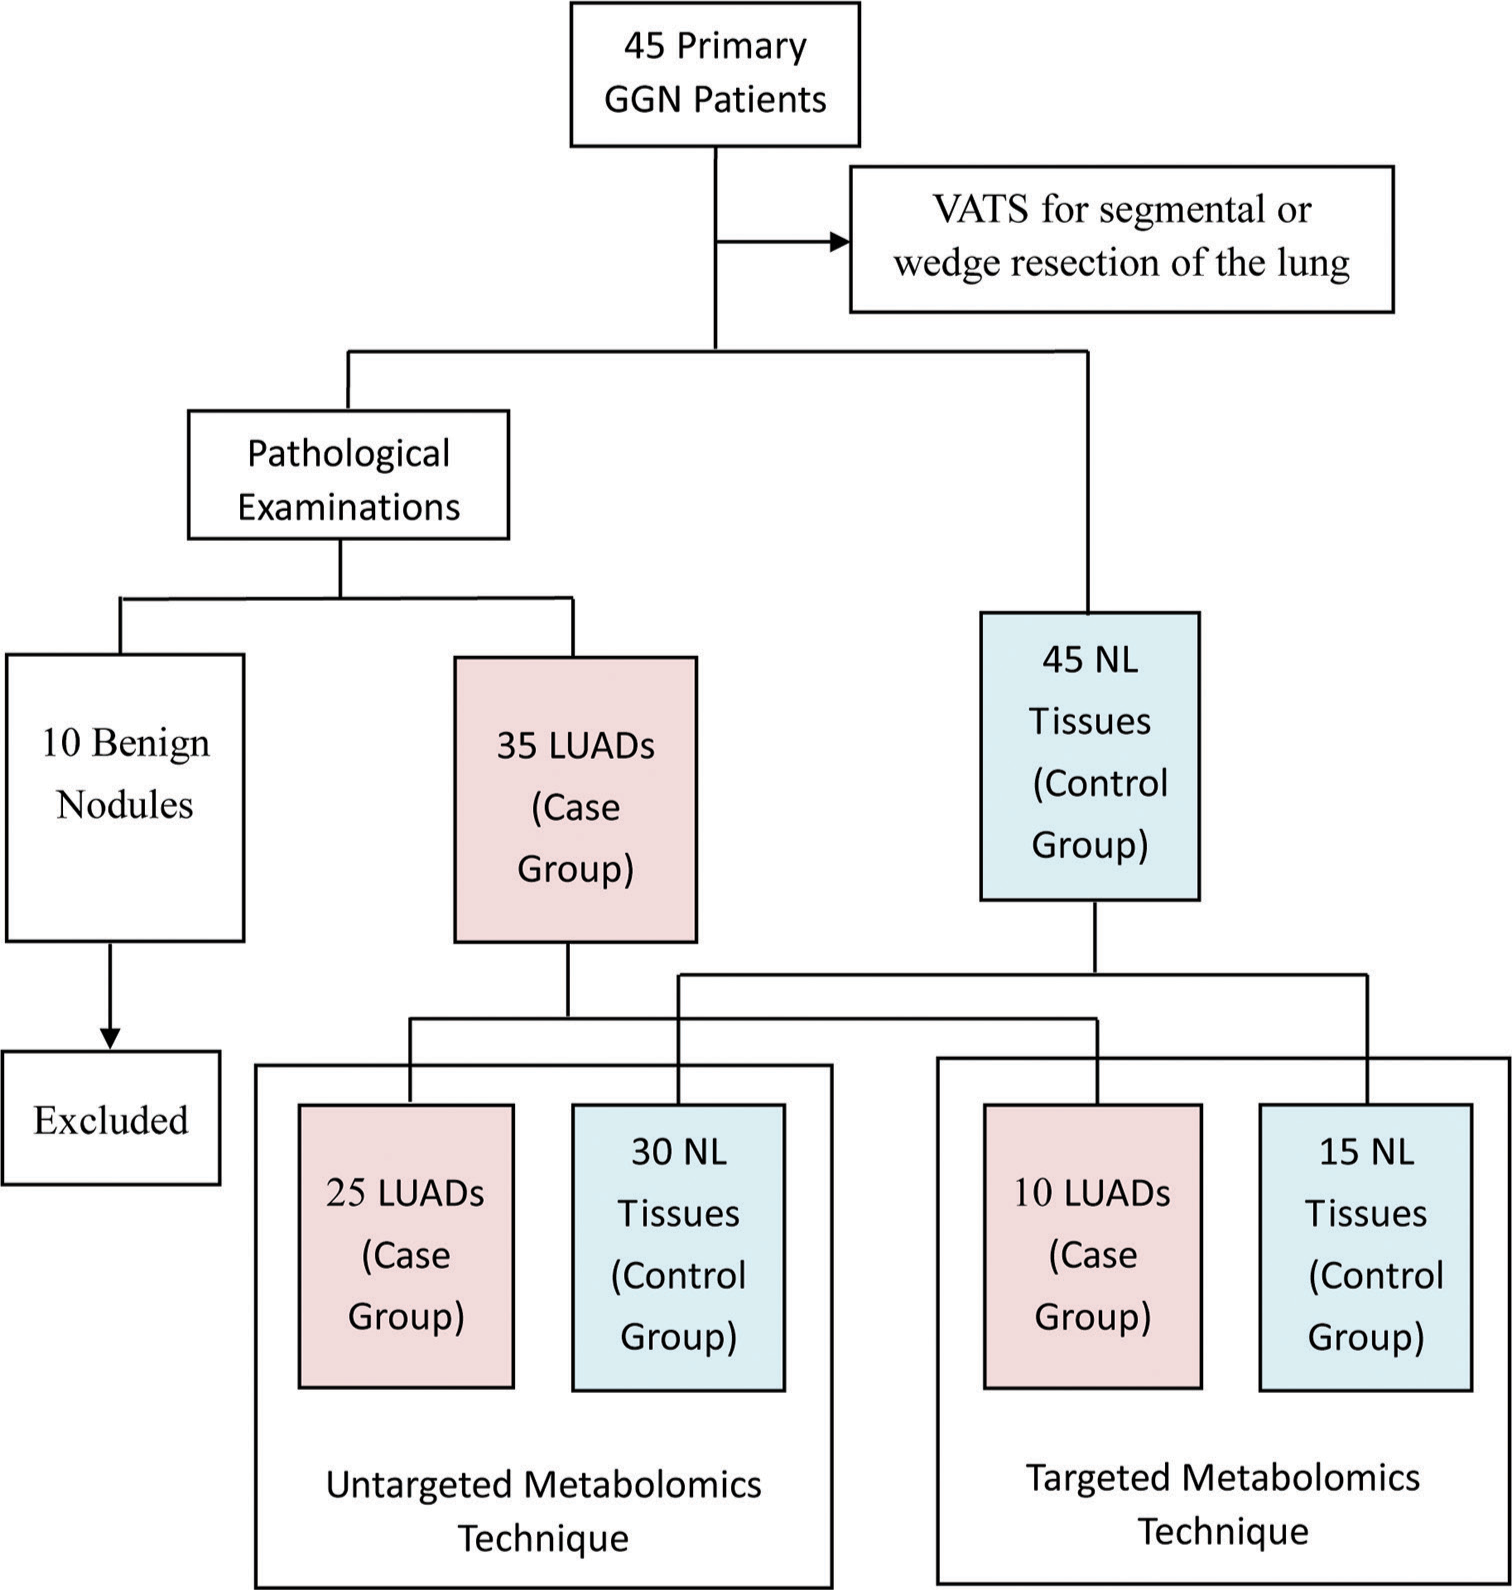
MATERIAL AND METHODS Study designFrom December 2021 to December 2022, 45 patients with primary GGN and who were willing to undergo surgery at the First Affiliated Hospital of Soochow University were recruited for the study. The inclusion criteria were as follows: (1) diagnosis of GGN based on the Chinese expert consensus for the diagnosis and treatment of pulmonary nodules (2018 Edition)[32] and (2) the patient was examined in our hospital and complete clinical data was available. The exclusion criteria were as follows: (1) detection of pulmonary inflammation, hematological disease, disease that can cause abnormal blood indicators, malignant tumors in other body parts, or immune system disease; (2) prior lung surgery or other recent surgery; (3) absence of diagnosis of any other lung disease; and (4) incomplete clinical data. All participants underwent video-assisted thoracoscopic surgery for segmental or wedge resection of the lung. For each participant, tissue samples were taken from the lesion site and 3 cm away from the lesion site. Only one cancer sample was taken from each patient. According to Zhang et al.,[33] GGNs are considered inert tumors due to their biological behavior. They can be stable, inactive, and not exhibit aggressive behavior. NL tissue located 3 cm away from the lesion was also taken. Thus, a total of 90 tissue samples from 45 patients were collected for pathological examination, with the results showing 35 LUAD samples (13 IAC, 14 MIA, and 8 AIS), 10 benign samples, and 45 NL tissues. For the untargeted metabolomics technique, 25 LUAD samples were assigned as the case group and 30 NL tissues as the control group. For the targeted metabolomics technique, ten LUAD samples were assigned as the case group and 15 NL tissues as the control group. The grouping details are shown in Figure 1.
Export to PPT
Major instruments and reagentsThe following instruments were used: UPLC from Waters 2D UPLC (Waters, USA); high-resolution mass spectrometer (Q Exactive) from Thermo Fisher Scientific, USA; low-speed cryogenic universal centrifuge (Centrifuge 5430) from Eppendorf, Germany; vortex mixer (QL-901) from Kylin-bell Lab Instruments Co., Ltd., China; ultrapure water systems (Milli-Q Integral) from Millipore Corporation, USA; vacuum concentrator (Maxi Vacbeta) from Gene Company; and tissue lyser (Jxfstprp) from Shanghai Jingxin Industrial Development Co., Ltd, China. The following reagents were used: Acetonitrile (A996-4) and MS-grade methanol (A454-4) from Thermo Fisher Scientific, USA; formic acid (50144-50 mL) from DIMKA, USA; and ammonium formate (17843-250G) from Honeywell Fluka, USA.
Sample extraction Untargeted metabolomicsA 25 mg sample from both 25 LUAD tissue samples and 30 NL tissue samples were taken as the specimen samples. Samples were thawed at 4°C and 800 µL of precooled extraction reagent (methanol: acetonitrile: water [2:2:1, v/v/v]) was added directly to 25 mg of tissue. For quality control (QC) of the sample preparation, internal standards mix 1 and internal standards mix 2 were used. Samples were homogenized for 5 min using TissueLyser (JXFSTPRP, China), followed by 10 min of sonication and 1 h of incubation at −20°C. Following centrifugation (15 min at 25,000 rpm, 4°C), the supernatant from the samples was collected for vacuum freeze drying. After centrifuging for 15 min at 25,000 rpm with the metabolites resuspended in 200 µL of 10% methanol, the supernatants were transferred to autosampler vials for LC-MS analysis. To test the consistency of the entire LC-MS analysis, a QC sample was created by pooling the same volume of each sample.
Targeted metabolomicsA 50% water/methanol solution (140 µL) was added to an appropriate amount of sample for extraction. After crushing, centrifuging was performed to obtain the supernatant and a derivatization reaction was then performed on the samples and QC sample. The samples and QC sample were diluted with HM400 diluent, centrifuged for 10 min, and the supernatant taken for UPLC-MS analysis.
LC-MS/MS analysis Chromatographic conditionsWaters, USA was used for sample extraction. A high-resolution mass spectrometer (Q Exactive; Thermo Fisher Scientific, Waltham, MA, USA) with a heated electrospray ionization source and operated by the Xcalibur 2.3 software program (Thermo Fisher Scientific, Waltham, MA, USA) was used. A Waters ACQUITY UPLC BEH C18 column (1.7 µm, 2.1 mm × 100 mm, Waters, USA) maintained at 45°C was used for chromatographic separation. In the positive mode, the mobile phase included 0.1% formic acid (A) and 100% acetonitrile (B). In the negative mode, the mobile phase included 10 mM each of ammonium formate (A) and acetonitrile (B). The gradient conditions were as follows: 0–1 min, 2% B; 1–9 min, 2–98% B; 9–12 min, 98% B; 12–12.1 min, 98% B–2% B; and 12.1–15 min, 2% B. The flow rate was 0.35 mL/min and the volume of injection was 5 µL.
MS conditionsThe mass spectrometric settings in positive/negative ionization modes were as follows: spray voltage (3.8/−3.2 kV); sheath gas flow rate (40 arbitrary units [arb]); aux gas flow rate (10 arb); aux gas heater temperature (350°C); and capillary temperature (320°C). The resolution was 70000 full width at half maximum (FWHM) and the full scan range was 70–1050 m/z. With a maximum ion injection time of 100 ms, the automatic gain control (AGC) objective for MS acquisitions was set to 3e6. The top three precursors with a maximum ion injection time of 50 ms and a resolution of 17,500 FWHM were chosen for future MS/MS fragmentation. The AGC was 1e5, and 20, 40, and 60 eV stepped normalized collision energies were chosen.
UPLC-MS analysis Chromatographic conditionsA Waters UPLC I-Class Plus (Waters, USA) was used for sample extraction. Waters, USA maintained at 40°C was used for chromatographic separation. The mobile phase included ultra-pure water (A) and 30% acetonitrile (B). The gradient conditions were: 0–1 min, 5% B; 1–5 min, 5–30% B; 5–9 min, 30–50% B; 9–11 min, 50–78% B; 11–13.5 min, 78–95% B; 13.5–16 min, 95–100% B; and 16.1–18 min, 5% B. The flow rate was 0.4 mL/min.
MS conditionsSource parameters for the QTRAP 6500 Plus equipped with an electrospray ion (ESI) Turbo Ion-Spray interface were set as follows: source temperature (500°C); ion spray voltage (IS) (4500 V in positive mode) or (−4500 V in negative mode); and ion source gas I (GS1) (40 psi), gas II (GS 2) (40 psi), and curtain gas (20 psi). MS mode methods were set at schedule mode with MS mode transitions, collision energy, declustering potential energy, and retention time for target metabolites.
Metabolomics data processingCompound discoverer 3.1 (Thermo Fisher Scientific, USA) software was used to process the LC-MS/MS data, primarily for peak extraction, peak alignment, and compound identification. A self-developed metabolomics R package (meta X) was used for data pre-processing, statistical analysis, metabolite classification, and functional annotations. Principal component analysis (PCA) was performed to assess groupings, trends, and outliers among the observed variables in the data set. Log2 logarithmic transformation and Pareto scaling were used to calculate the principal component. The differential metabolite screening was completed by partial least squares method discriminant analysis (PLS-DA). The risk of model overfitting was evaluated by the orthogonal PLSDA (OPLS-DA) model, and 200 times re-collection modeling was utilized for good reproducibility. The metabolites with variable importance in projection (VIP) values >1, fold-change (FC) ≥1.2 or ≤0.83, and P < 0.05 (two-tailed Student’s t-test) were defined as significantly different metabolites.
To confirm the key pathways connected to the metabolic phenotype, a metabolic pathway enrichment analysis was performed using the KEGG website (www.genome.jp/kegg/).
Statistical analysisExcel software was used for clinical data entry and organization. Data were analyzed using SPSS 17.0 software. Numerical data were represented using the mean ± standard deviation, and count data were represented using frequency counts.
RESULTS Clinical informationParticipant characteristics including gender, age, nodule size, nodular side, and nodule nature are presented in Table 1. A total of 45 GGN patients were included, comprising 35 LUAD (13 IAC, 14 MIA, and eight AIS) and ten benign nodule cases. The mean age of LUAD patients was 54.74 ± 13.80 years, with six males and 29 females. The location of nodules in LUAD patients was 23 on the right and 12 on the left, with a mean size of 1.39 ± 0.61 mm. Twelve patients had pure GGNs and 23 had part-solid GGNs. Concerning smoking status, 13 were current smokers, five were ex-smokers, and 17 were non-smokers. Of the total cases, 18 were epidermal growth factor receptor (EGFR) mutation-positive [Figure 2a], and 17 were EGFR mutation-negative [Figure 2b]. Two cases were positive for anaplastic lymphoma kinase (ALK) and 33 were negative.
Table 1: Characteristics of the GGN patient cohort (n=45).
Clinical variables LUAD patients (n=35) Benign nodule patients (n=10) Total IAC (n=13) MIA (n=14) AIS (n=8) Gender (n, %) Male 6 (17.14) 4 (66.67) 1 (16.67) 1 (16.67) 6 (60.00) Female 29 (82.86) 9 (31.03) 13 (44.83) 7 (24.14) 4 (40.00) Age (years) 54.74±13.80 59.31±13.00 56.36±14.00 44.50±10.31 58.00±15.71 Nodule size (mm) 1.39±0.61 1.79±0.67 1.20±0.43 1.07±0.48 3.62±4.01 Nodule side (n, %) Right 23 (65.71) 7 (30.43) 12 (52.17) 4 (17.39) 4 (40.00) Left 12 (34.29) 6 (50.00) 2 (16.67) 4 (33.33) 6 (60.00) Nodule nature (n, %) Pure GGN 12 (34.29) 2 (16.67) 3 (25.00) 7 (58.33) 0 Part-solid GGN 23 (65.71) 11 (47.83) 11 (47.83) 1 (4.35) 5 (50.00) Solid GGN 0 0 0 0 5 (50.00) Smoking status (n, %) Current smoker 13 (37.14) 4 (30.77) 5 (38.45) 4 (30.77) 2 (20.00) Ex-smoker 5 (14.29) 2 (40.00) 2 (40.00) 1 (20.00) 2 (20.00) Non-smoker 17 (48.57) 7 (41.18) 7 (41.18) 3 (17.65) 6 (60.00) EGFR mutation (n, %) Positive 18 (51.43) 11 (61.11) 6 (33.33) 1 (5.56) 3 (30.00) Negative 17 (48.57) 2 (11.76) 8 (47.06) 7 (41.18) 7 (70.00) ALK (n, %) Positive 2 (5.71) 1 (50.00) 1 (50.00) 0 0 Negative 33 (94.29) 12 (36.36) 13 (39.39) 8 (24.25) 10 (100.00)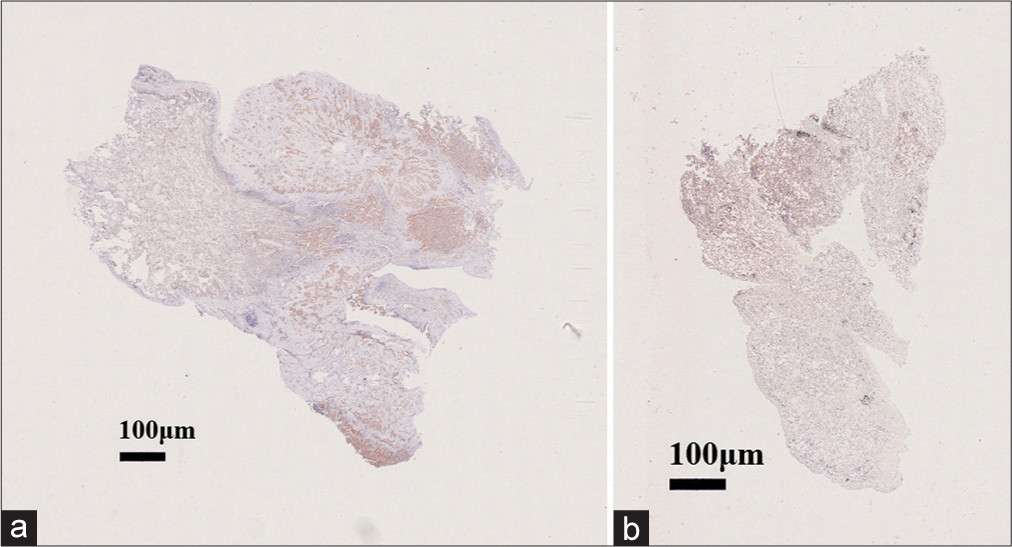
Export to PPT
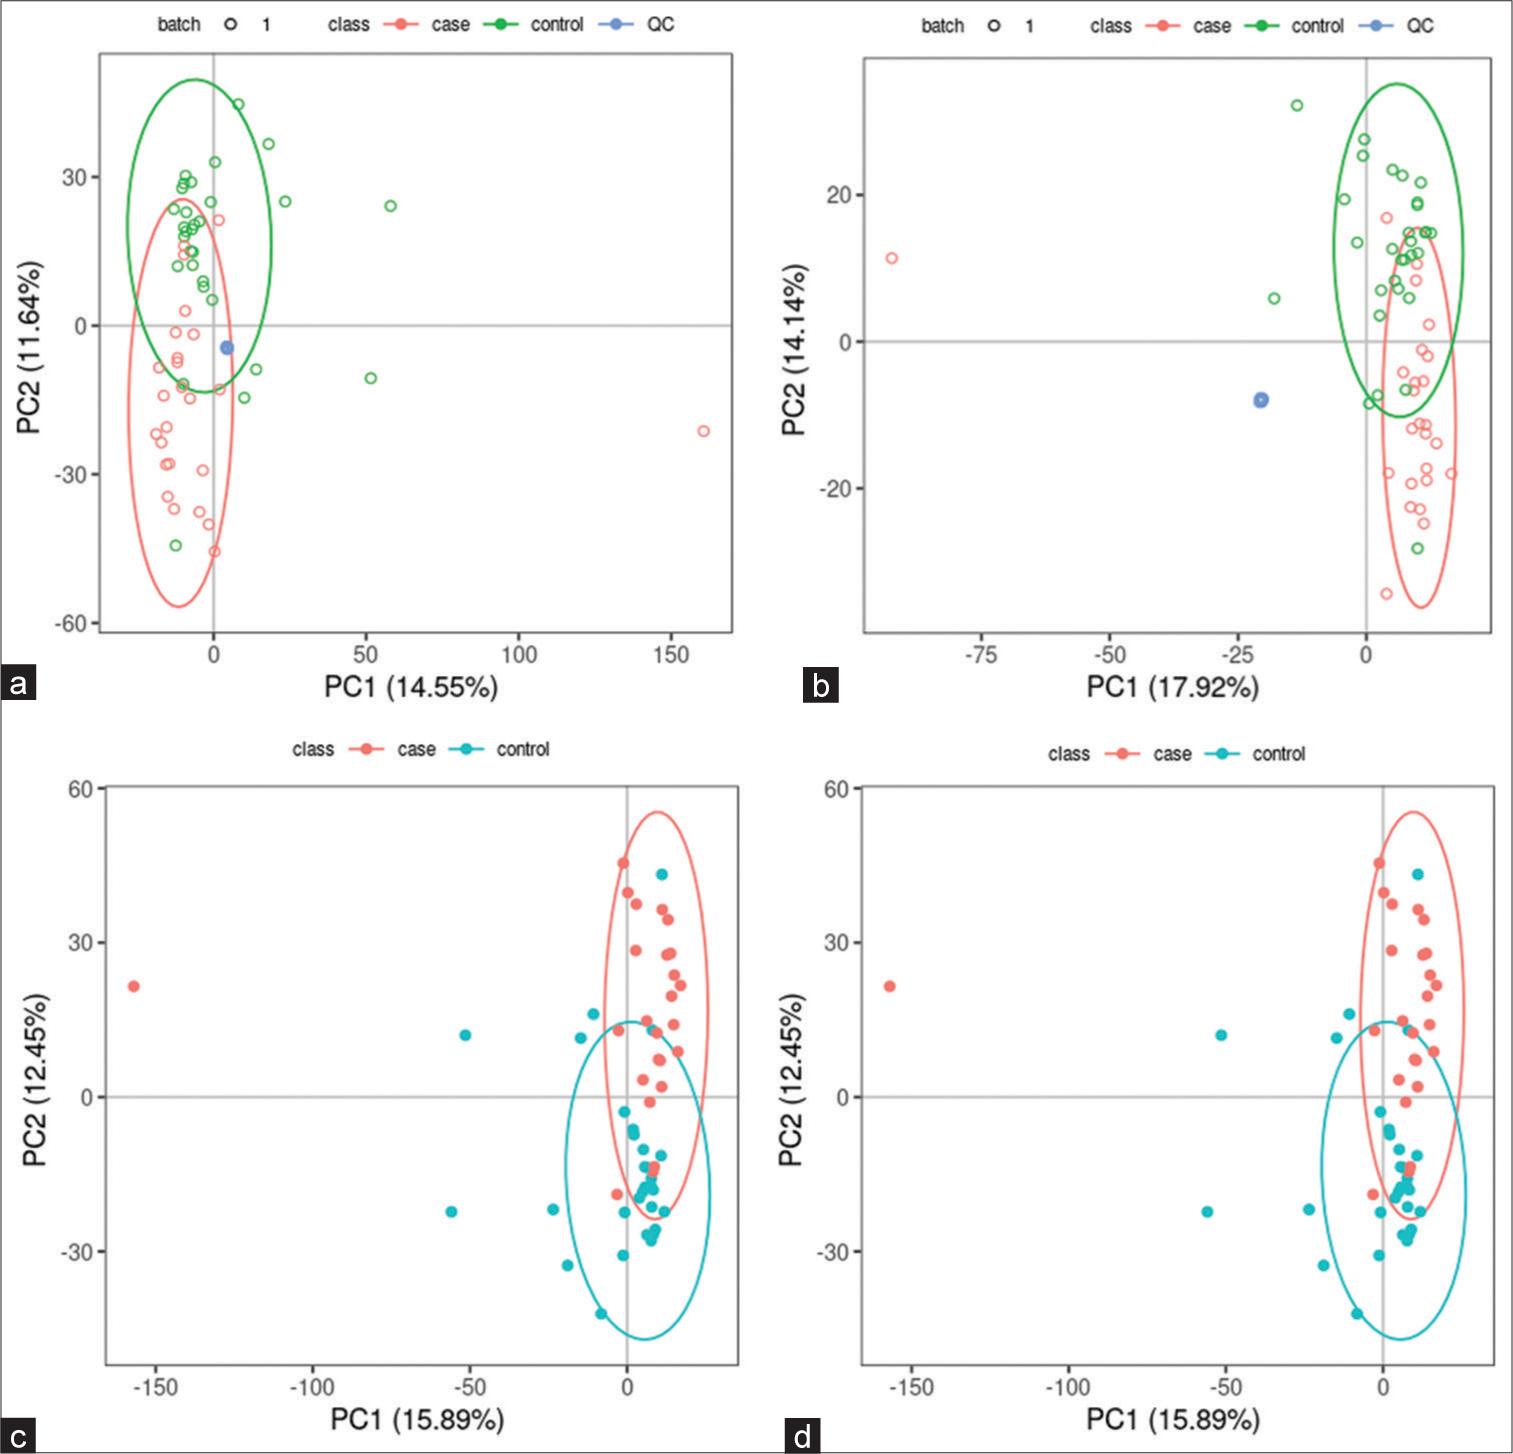
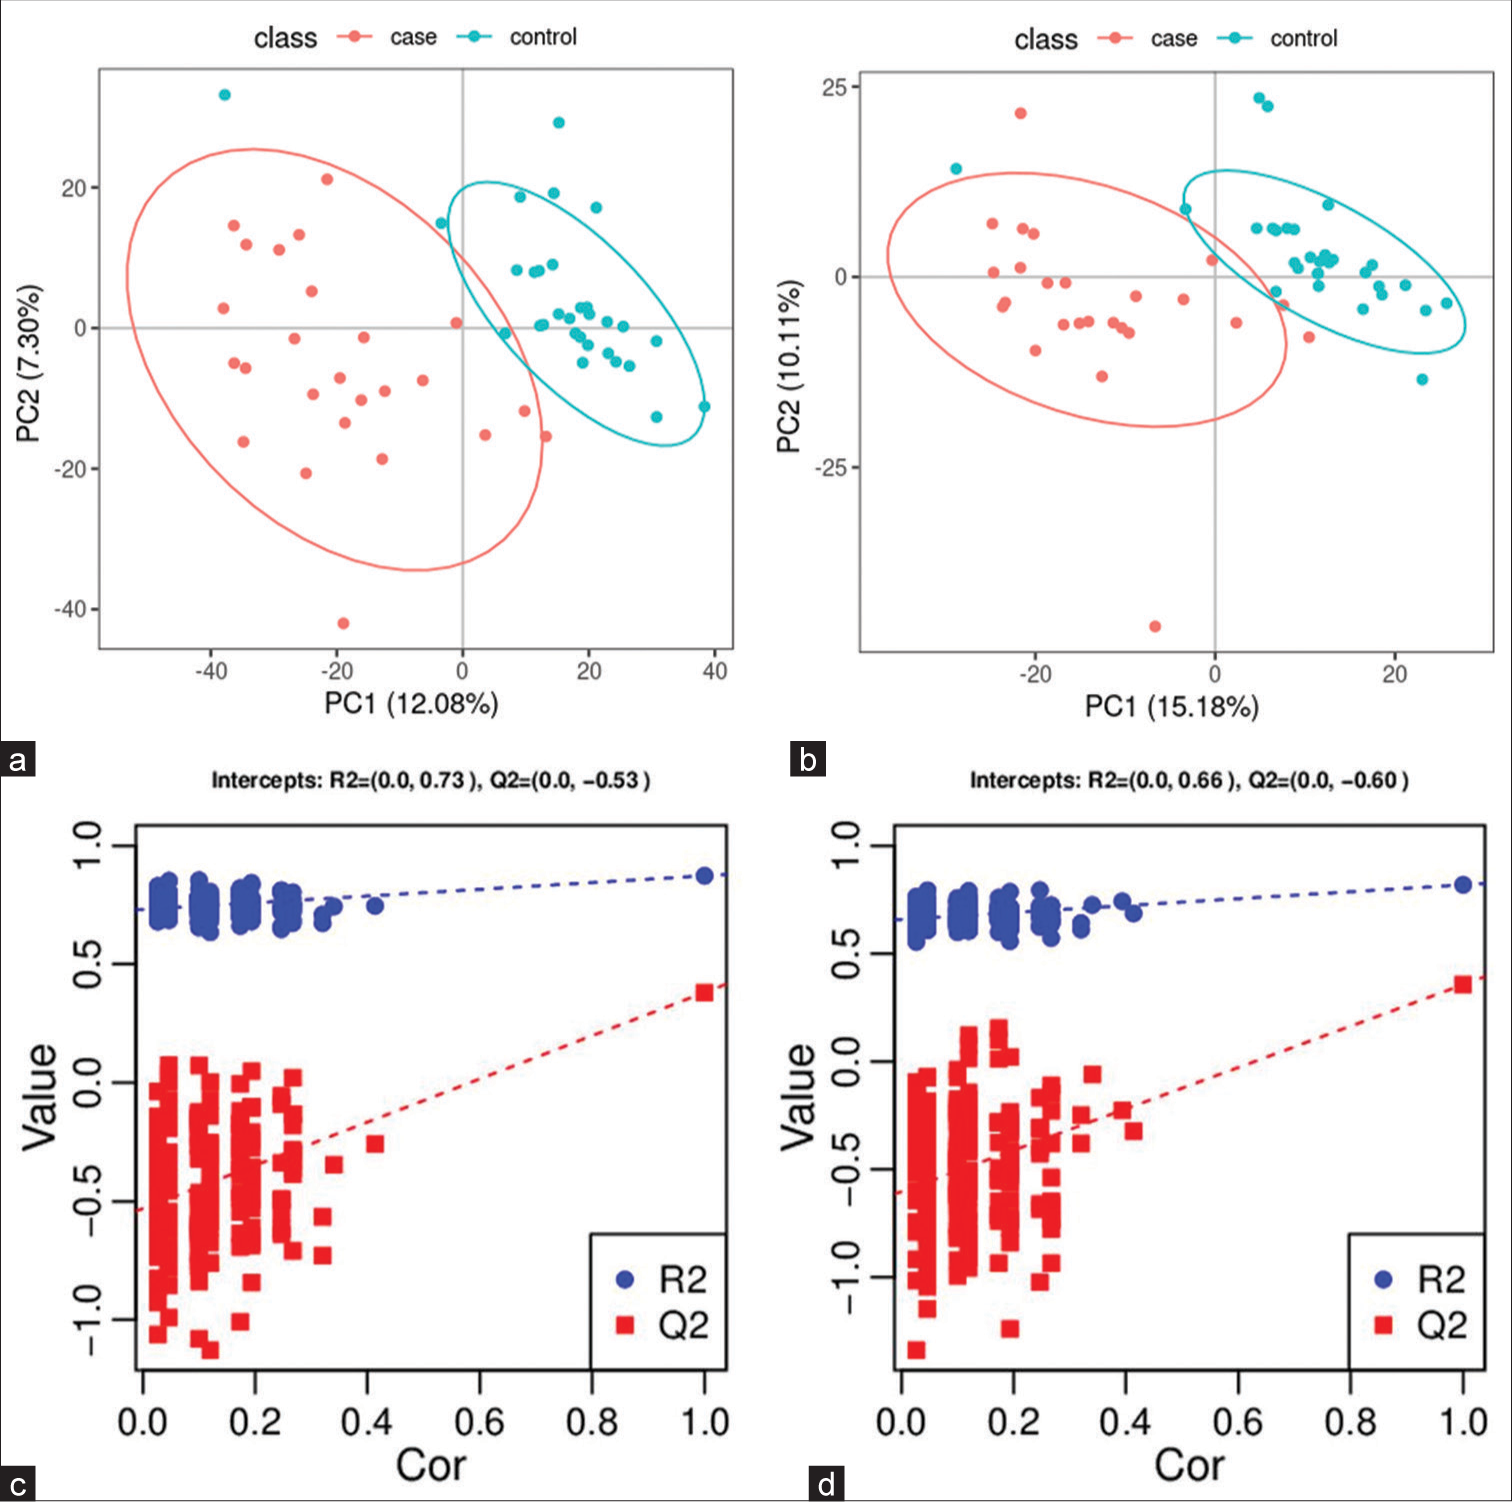
Untargeted metabolomics Significantly altered metabolites and their relative changes across groupsAll samples from the LUAD case group, NL tissue control group, and QC group were examined by PCA modeling to visualize their distribution [Figure 3a-d]. A PCA model was established between the comparative analysis groups (LUAD and NL tissue samples) to observe the distribution and separation trend for the two groups. The data were log2 converted before the PCA model was established, with data scaled using the Pareto scaling method. Some overlap was observed in scattered sample points, but a clear trend for separation was evident, indicating a significant difference between the groups in both positive and negative ion modes [Figure 3c and d]. PLS-DA was then performed to visualize the separation of samples. Unlike PCA, PLS-DA is a supervised statistical method, allowing differences between classification groups to be reflected to the greatest extent. The PLS-DA model between the comparative group (LUAD and NL tissue samples) was established after log2-log conversion of the data, with the Par method used for scaling. A 7-fold cross-validation was performed during modeling. To evaluate the model, the PLS-DA model were subjected to 200 response permutation tests (RPTs). Some overlap in scattered sample points was observed, but a clear trend of separation was again evident, indicating a significant difference between the groups in both positive and negative ion modes [Figure 4a and b]. In positive ion mode, R2Y was 0.87 and Q2 was 0.38. In negative ion mode, R2Y was 0.82 and Q2 was 0.36. The results showed a good match with acceptable predictive power, with no overfitting identified [Figure 4c and d, Table 2].
Export to PPT
Export to PPT
Table 2: Statistical results for the PLS-DA model of LUAD samples (case group) and NL tissues (control group).
Mode R2Y (cum) Q2 (cum) R2 Q2 Positive 0.87 0.38 (0.0, 0.73) (0.0,−0.53) Negative 0.82 0.36 (0.0, 0.66) (0.0, −0.60) Screening for differential metabolites between LUAD and NL tissue groupsData were subjected to Fold Change (FC) analysis to obtain the FC value. P-value was obtained by Student’s t-test, with correction for a false discovery rate to obtain the q-value. A total of 850 differential metabolites were identified between the two groups (589 in positive ion mode and 261 in negative mode). Among the 589 differential metabolites identified in positive ion mode were 40 organic acids and their derivatives, 15 organo heterocyclic compounds, 15 benzenoids, 12 organic nitrogen compounds, nine alkaloids and their derivatives, seven nucleosides/nucleotides and their analog, four organic oxygen compounds, two lipids and lipid-like molecules, two phenylpropanoids and polyketides, one homogeneous non-metal compound, one nucleic acid, one peptide, one sphingolipid, one terpenoid, and one vitamin/cofactor. The remaining 477 differential metabolites had no name. [Supplementary Table 1] lists the differential metabolites found in positive ion mode. Among the 261 differential metabolites identified in negative ion mode were 17 organic acids and their derivatives, eight benzenoids, six organic oxygen compounds, five lipids and lipid-like molecules, five nucleosides/nucleotides and their analogs, four phenylpropanoids and polyketides, three organo heterocyclic compounds, one alkaloid or derivative, one fatty acyl, one homogeneous non-metal compound, and one polyketide. The remaining 209 differential metabolites had no name. [Supplementary Table 2] lists the differential metabolites found in negative ion mode.
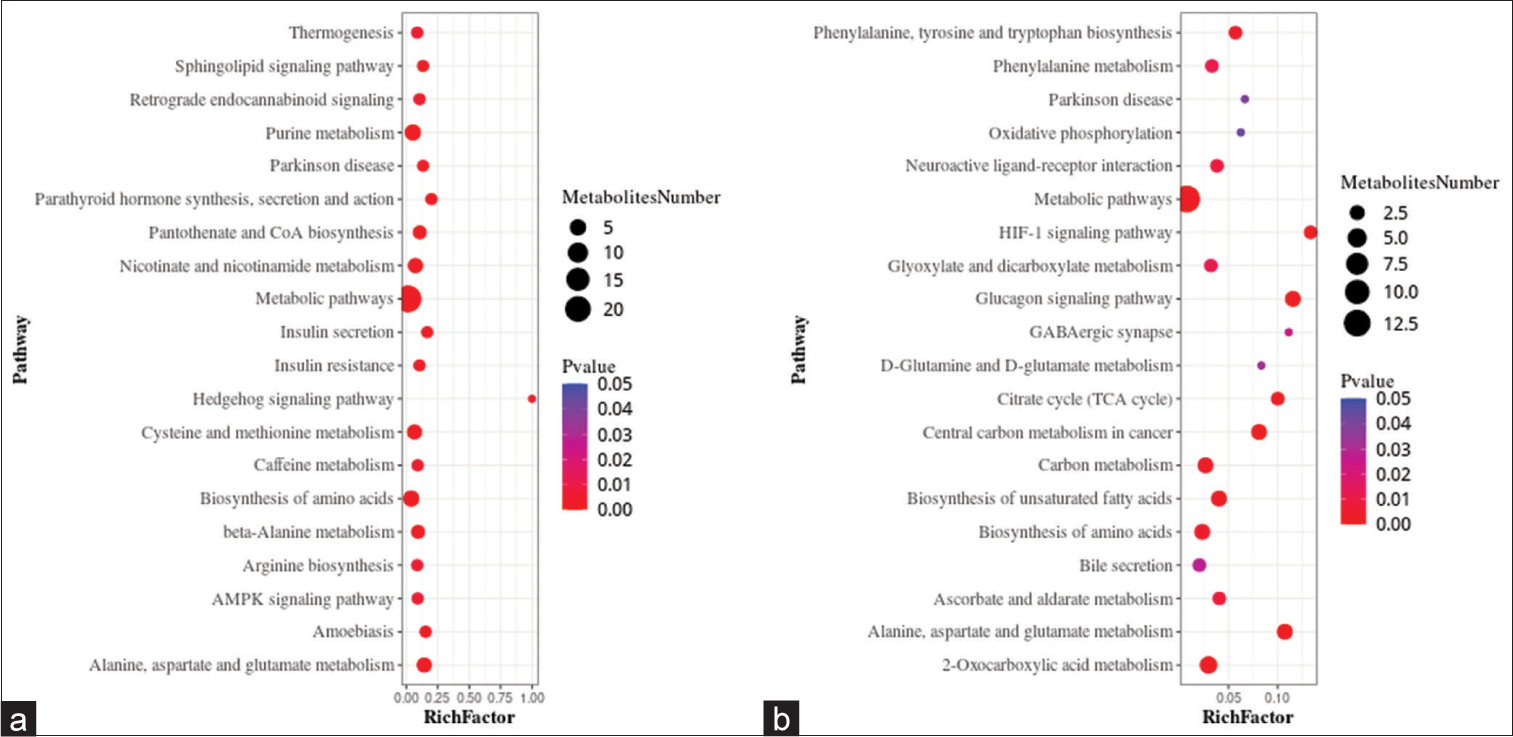
Metabolic pathwaysA metabolic pathway enrichment analysis of differential metabolites was performed based on the KEGG database. In the positive ion mode, 130 metabolic pathways with P < 0.05 were significantly enriched by the differential metabolites, while in the negative ion mode, 56 metabolic pathways were identified. The positive ion mode revealed a total of 66 differential metabolic pathways and 130 differential metabolites. The top three pathways with enriched scores in the positive ion mode included metabolic pathways (23 metabolites), purine metabolism (five metabolites), and biosynthesis of amino acids (five metabolites). The negative ion mode revealed a total of 21 differential metabolic pathways and 56 differential metabolites. The top three pathways with enriched scores in the negative ion mode included metabolic pathways (13 metabolites), 2-oxalic acid metabolism (four metabolites), and glucagon signaling pathway (three metabolites) [Figure 5a and b].
Export to PPT
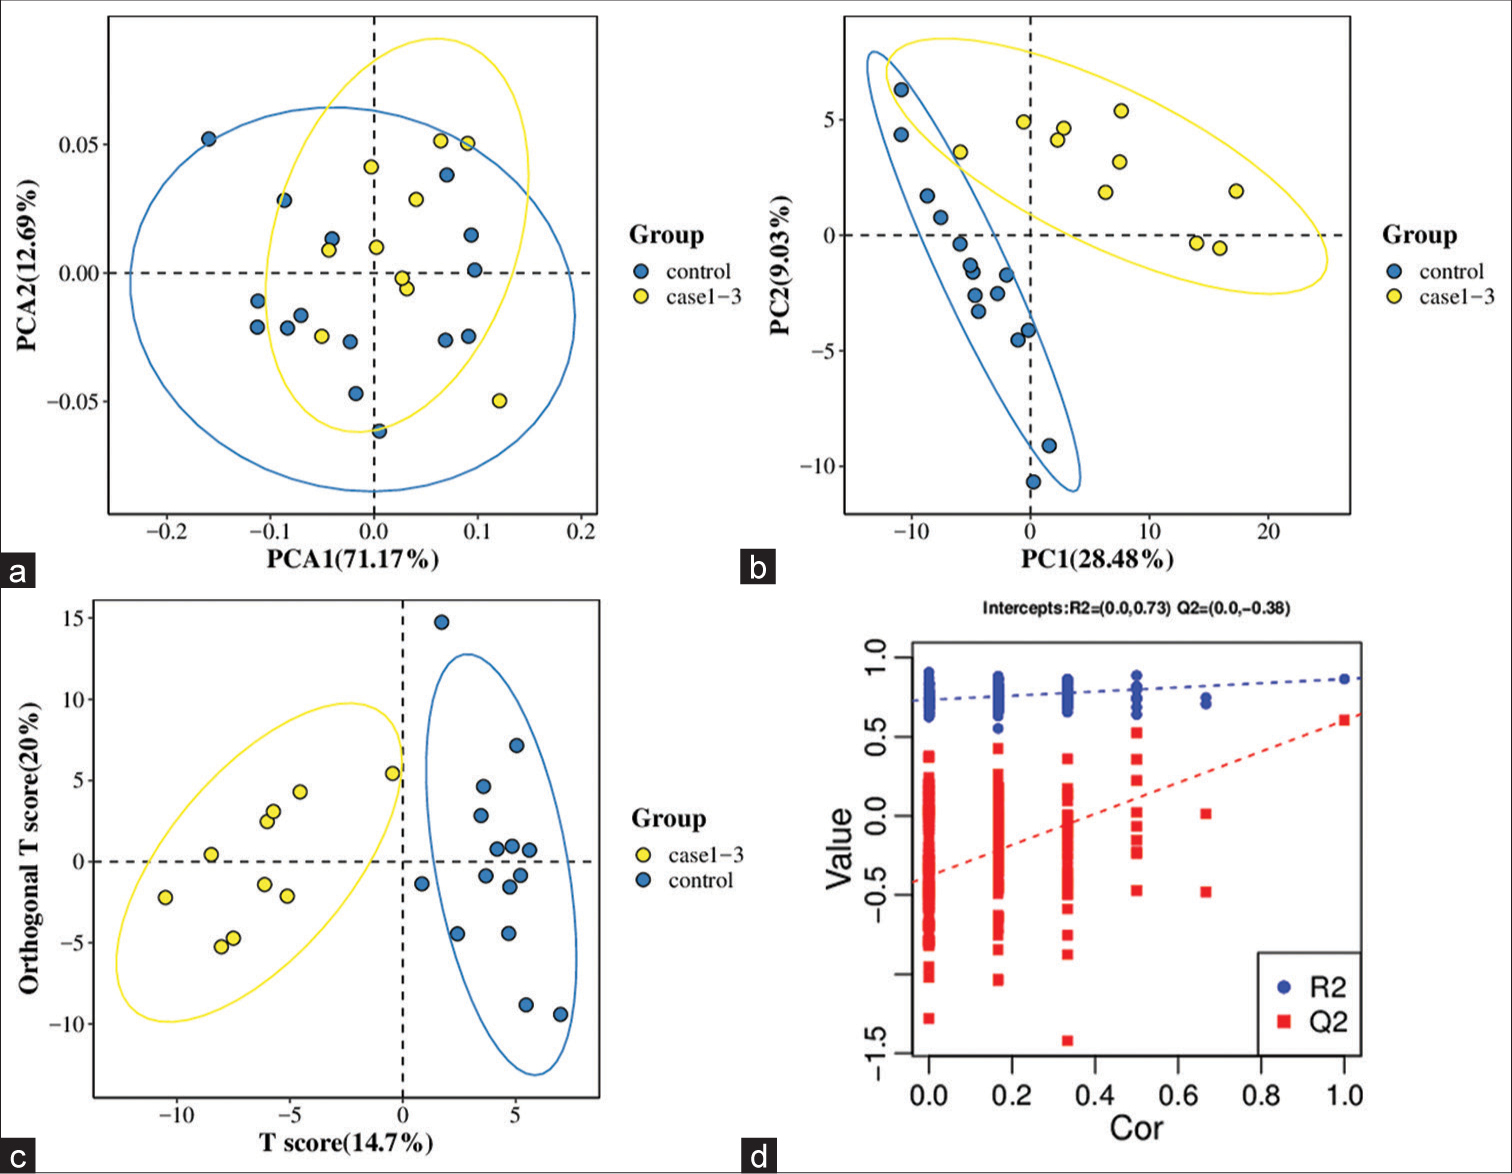
Targeted metabolomics Significantly altered metabolites and their relative changes across groupsA PCA model was established to examine the distribution and separation between LUAD and NL tissue groups. The results of PCA analysis showed overlap in scattered sample points [Figure 6a]. Next, a supervised PLS-DA model was performed, with the results also showing some overlap in scattered sample points but still a clear trend of separation [Figure 6b]. OPLS-DA was performed on the two groups of biological samples to establish the relationship model between metabolite level and sample categories, thus enabling the prediction of sample categories. The results of the OPLSDA analysis [Figure 6c] showed no overlap in the scattered sample points and a clear trend for separation. To judge the quality of the model without fitting risk, 200 RPTs were performed with the OPLS-DA model. The results showed an R2Y of 0.865 and Q2 of 0.604 [Figure 6d and Table 3].
Export to PPT
Table 3: Results from the OPLS-DA model of LUAD samples (case group) and NL tissues (control group).
Statistical Results R2Y (cum) Q2 (cum) R2 Q2 0.865 0.604 (0.0,0.73) (0.0,−0.38)Independent validation using a smaller subset strengthened the validity and applicability of the model’s findings. This provides a way of testing the generalizability and robustness of the model using unseen data, while remaining within the context of the original dataset.
Screening for differential metabolites between LUAD and NL tissue groupsFC and Student’s t-test analyses performed on the data identified 77 differential metabolites. These included 20 fatty acids, 19 amino acids, 13 organic acids, eight benzenoids, six carbohydrates, four bile acids, two carnitines, two phenylpropanoic acids, one indole, one peptide, and one pyridine [Supplementary Table 3].
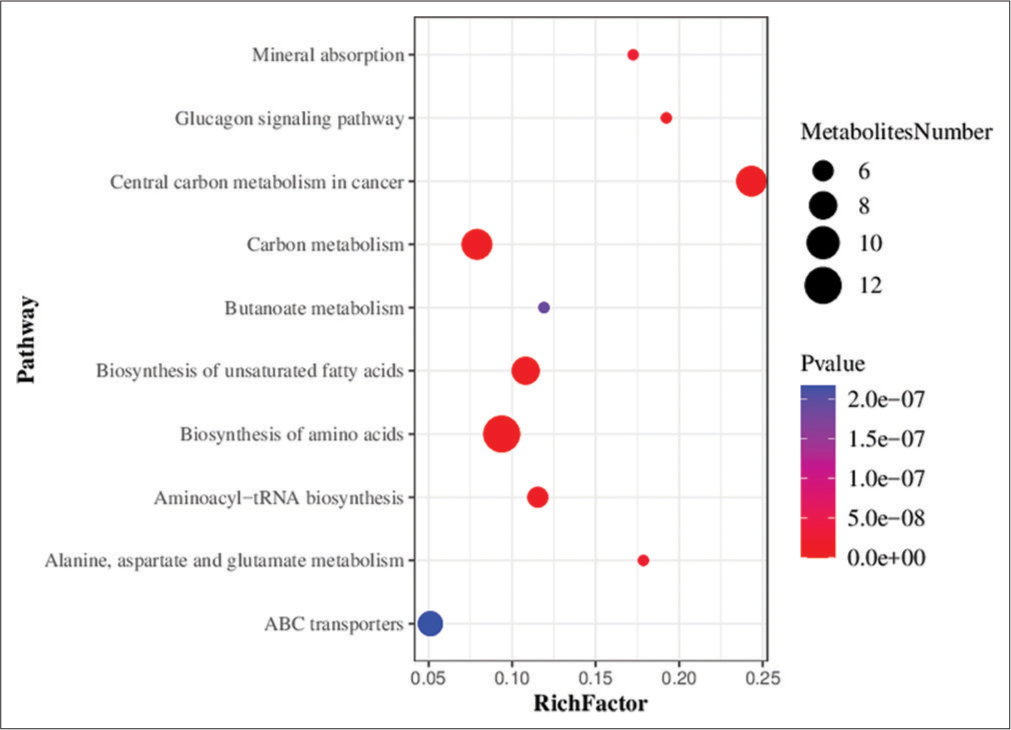
Metabolic pathwaysMetabolic pathway enrichment analysis of differential metabolites was performed based on the KEGG database. A total of 71 metabolic pathways with P < 0.05 were found to be significantly enriched by the differential metabolites. The top three pathways for enrichment included biosynthesis of amino acids (11 metabolites), carbon metabolism (nine metabolites), and central carbon metabolism of cancer (nine metabolites) [Figure 7].
Export to PPT
DISCUSSIONLung cancer is a highly complex and heterogeneous disease that exhibits diverse genetic alterations in its different histological classes.[34] The genome of cancerous cells and tissues varies slightly among cancer patients. Although there exist numerous diagnostic markers for genes and proteins, these do not provide an accurate and feasible option for diagnosis due to the heterogeneity of cancer cells within individual patients.[35] Mutations in the tumor suppressor gene TP53 occur in 40–60% of non-small-cell lung cancer (NSCLC) tumors, with a higher incidence of lung cancers from smokers compared to non-smokers.[34] In addition, 2–9% of NSCLCs have genetic changes in the ALK gene.[36] Mutations in exon 19 or 21 of EGFR occur in 15–30% of NSCLC patients.[37] About 30% of LUAD patients also have KRAS mutations. However, in contrast to mutant EGFR or ALK proteins, mutant KRAS is still not a clinically useful target.[38] Consequently, some patients may benefit from these markers while others do not.[35]
Cytological examination of lung tumor samples obtained by different methods has always been an important modality for diagnostic and predictive testing of lung cancer patients. Cytology provides several benefits compared to histology specimens when it comes to the morphological interpretation of cases.[39] These advantages include fewer artifacts, immediate fixation, improved preservation, and clear nuclear and cytoplasmic details in alcohol-fixed preparations. Nonetheless, certain challenges arise when attempting to further subtype a subset of NSCLC cases into squamous cell carcinoma and adenocarcinomas.[39]
The use of metabolomics in cancer research first started about 10 years ago. Along with studies of cancer metabolism, metabolomics has recently emerged as a research hotspot.[20] Metabolomics research has progressed rapidly in recent years and is anticipated to become a new hotspot in the field of lung cancer research. Compared to cytology, metabolomics has the ability to provide a comprehensive view of the metabolic state of a biological system, such as cell culture, biological fluid, and tissue.[40] By analyzing the complete set of metabolites in a sample, metabolomics can reveal changes in biochemical pathways that may not be detected by cytology or other methods. In contrast, cytology is typically better at detecting visible changes in cell morphology or structure that may result from cell abnormalities.[41] Therefore, both methods have their own distinct advantages in cancer diagnosis.
The human organism tightly controls metabolic biochemical reactions. Compared to genes and proteins, such reactions show substantially less difference between individuals.[20] A previous study showed that the ability of tumor cells to metabolize proteins, lipids, and carbohydrates to maintain cell proliferation is significantly altered compared to normal cells.[42] On tumor development, metabolic reprogramming gives cancer cells the ability to endure and grow.[43] Thus, metabolomics shows great promise as a means of finding reliable cancer metabolic markers, especially for tumor types that are difficult to detect in the early stages, such as LUAD.[
留言 (0)