Gene expression data collection
The GEO database (https://www.ncbi.nlm.nih.gov/geo/) was used to analyze mRNA expression levels in OC patients. This study used the datasets GSE66957 (Normal: 12, Tumor:57), GSE14407 (Normal: 12, Tumor: 12), and GSE18520 (Normal: 10, Tumor: 53). The TCGA database (https://portal.gdc.cancer.gov/) only contains cancer tissue samples from 587 OC patients; therefore, we introduced 88 normal ovarian tissue samples from the GTEx database (https://www.gtexportal.org/) as a control for TCGA-OC. All detailed information of patients were listed in Supplementary File 1.
Identification of differentially expressed genes with Limma
Differential gene analysis was performed on GSE66957 using the “Limma” package, with |logFC|> 1 and a p-value < 0.05 indicating significance. More details are in Supplementary File 2.
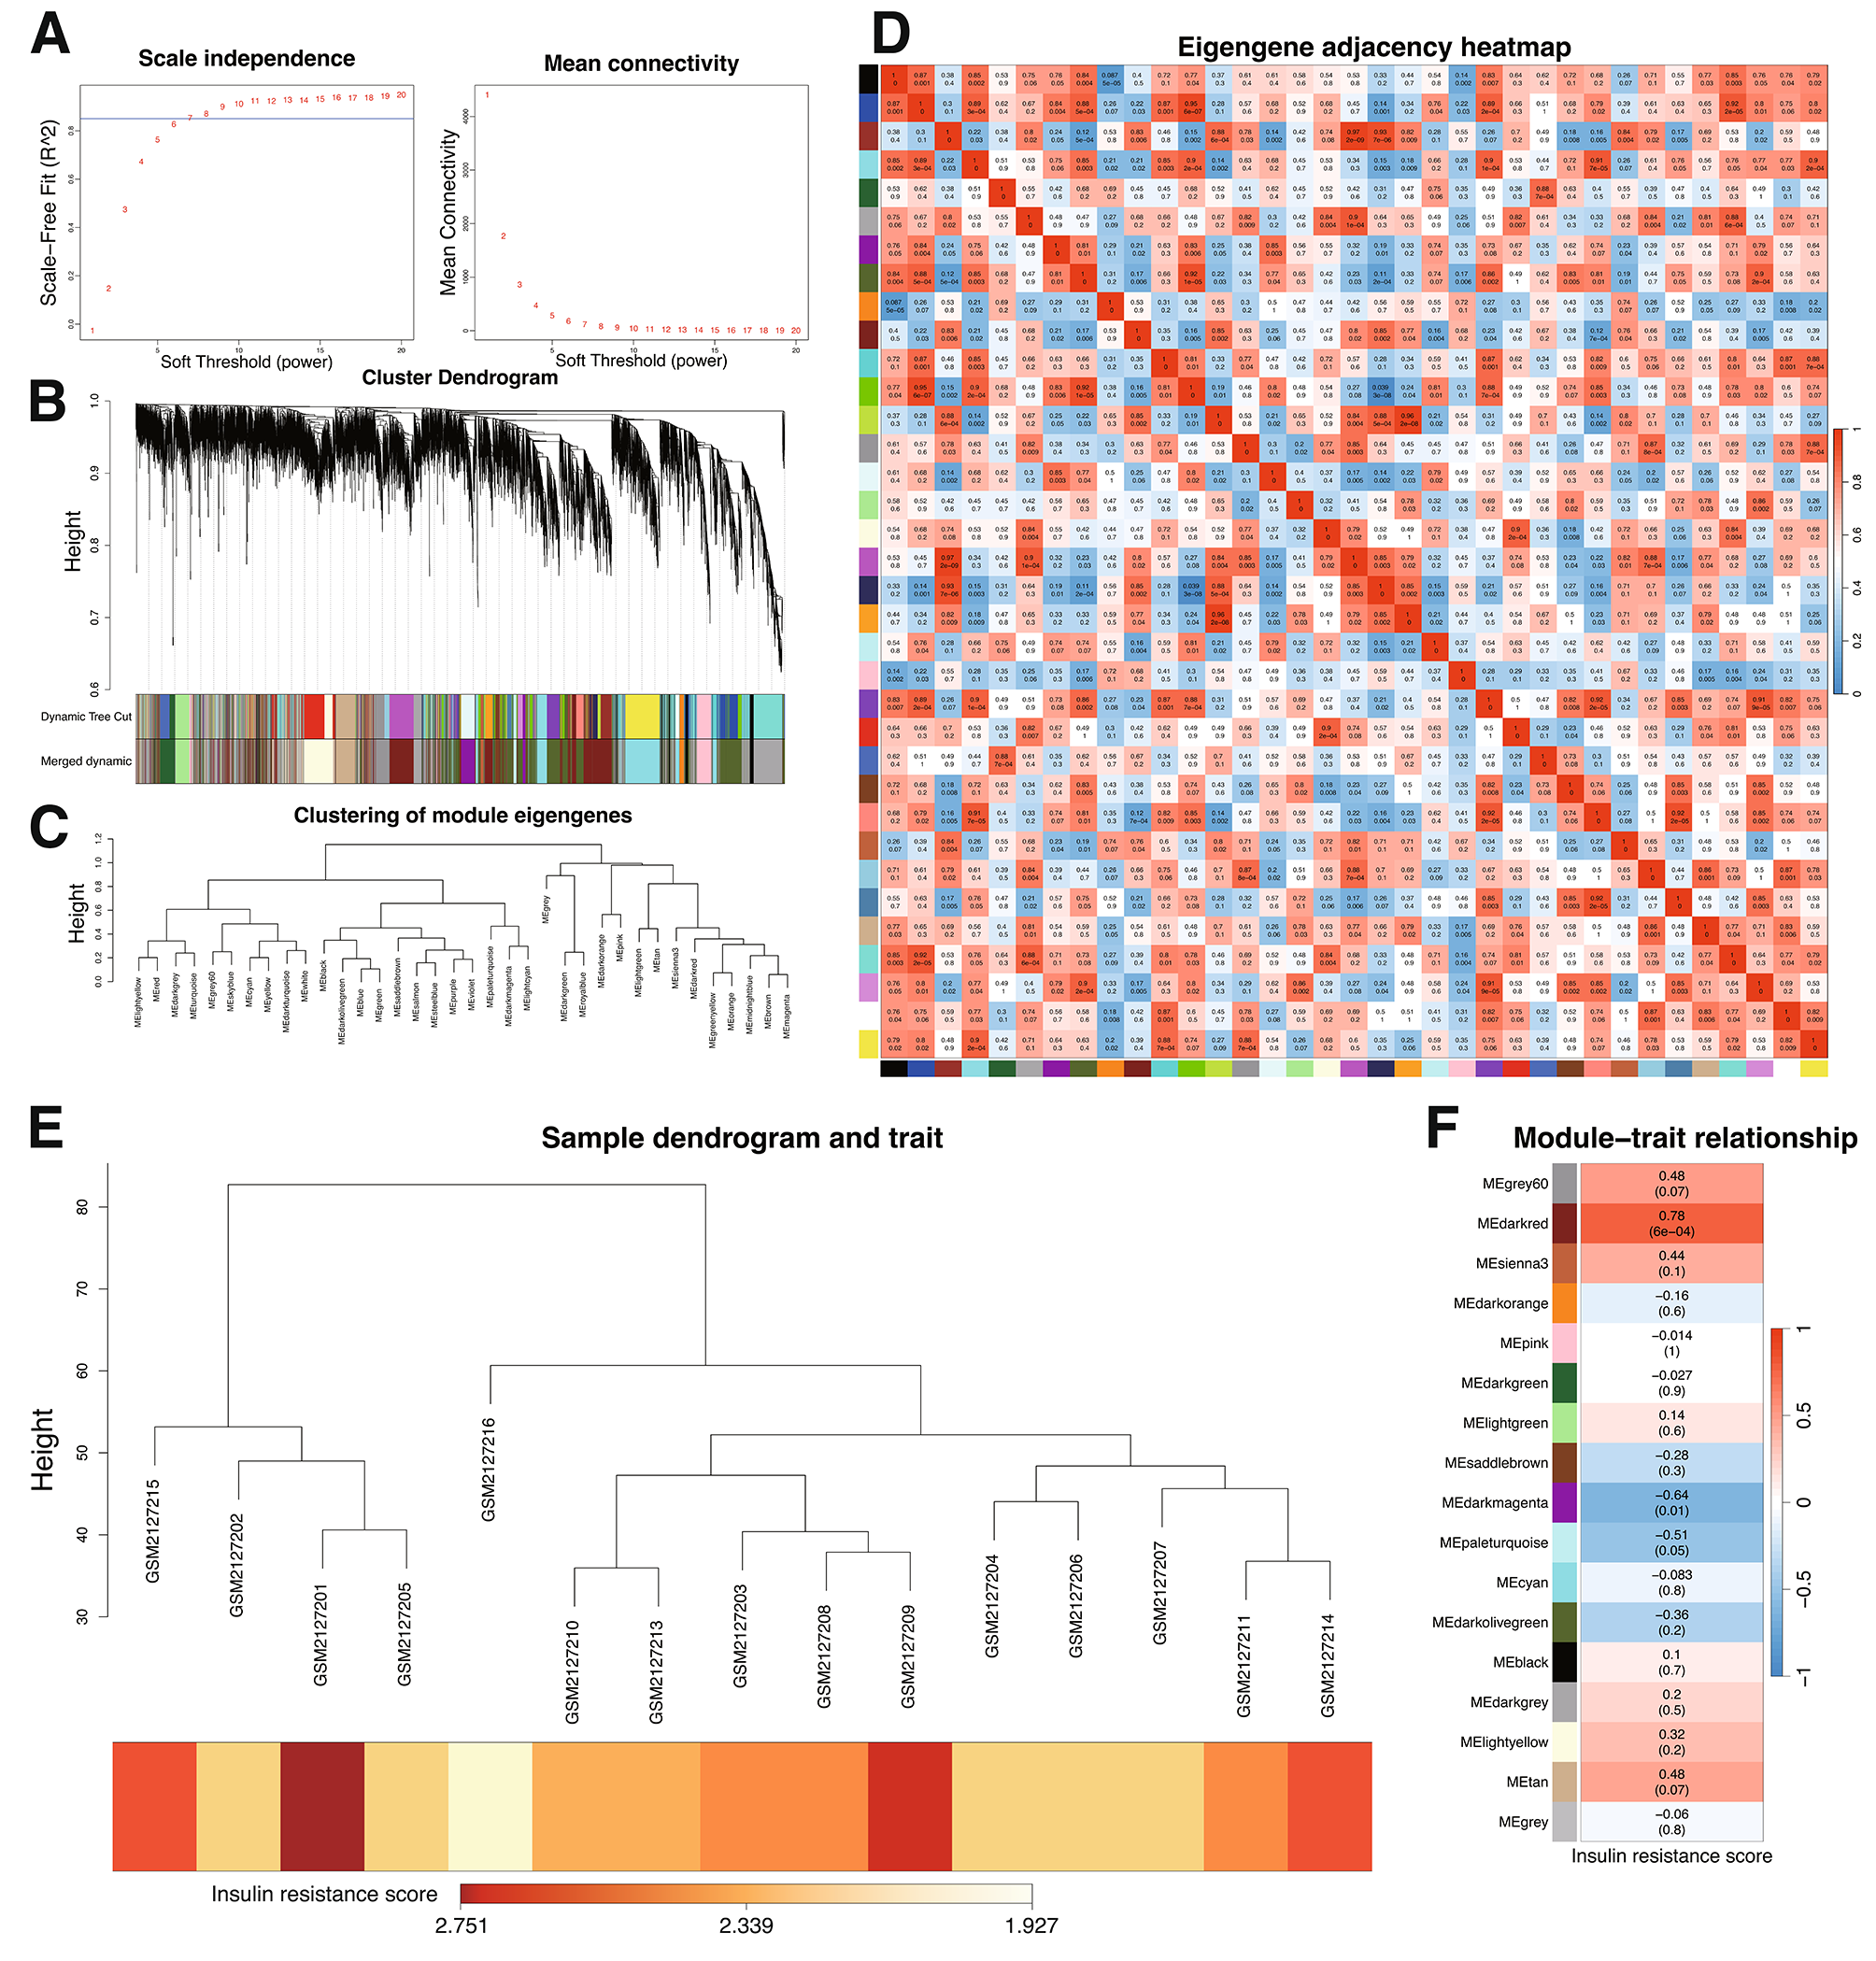
Weighted Gene Co-Expression Network Analysis (WGCNA)
This study analyzed GSE66957 using WGCNA and constructed a co-expressed gene module. The soft threshold of GSE66957 was set to 5, the minimum module gene was set to 30, the module merge threshold was set to 0.25, and MM values greater than 0.8 were considered disease-characteristic genes. More details are in Supplementary File 3. ‘Venny’ (https://bioinfogp.cnb.csic.es/tools/venny/) was used to create the Venn diagram. Common DEGs were used for subsequent analyses. More details are in Supplementary File 4.
Functional analyses
Following the identification of common DEGs, we conducted a functional enrichment analysis. The following databases were used: GO, KEGG, Reactome, and WikiPathways. These databases were used to determine the biological pathways and functions of common DEGs. Statistical significance was set at p < 0.05. More details are in Supplementary File 5.
PPI network construction
A PPI network was developed using the STRING database (https://string-db.org) to analyze the interactions among DEGs. If the confidence setting was greater than 0.7, non-hidden proteins were hidden.
Screening of hub genes
The results generated using the string database were imported into Cytoscape for analysis, and the plugin cytoHubba was used to analyze hub genes. The top 10% of genes calculated through MCC and Degree algorithms were considered hub genes. More details are in Supplementary File 6.
Verification of hub genes
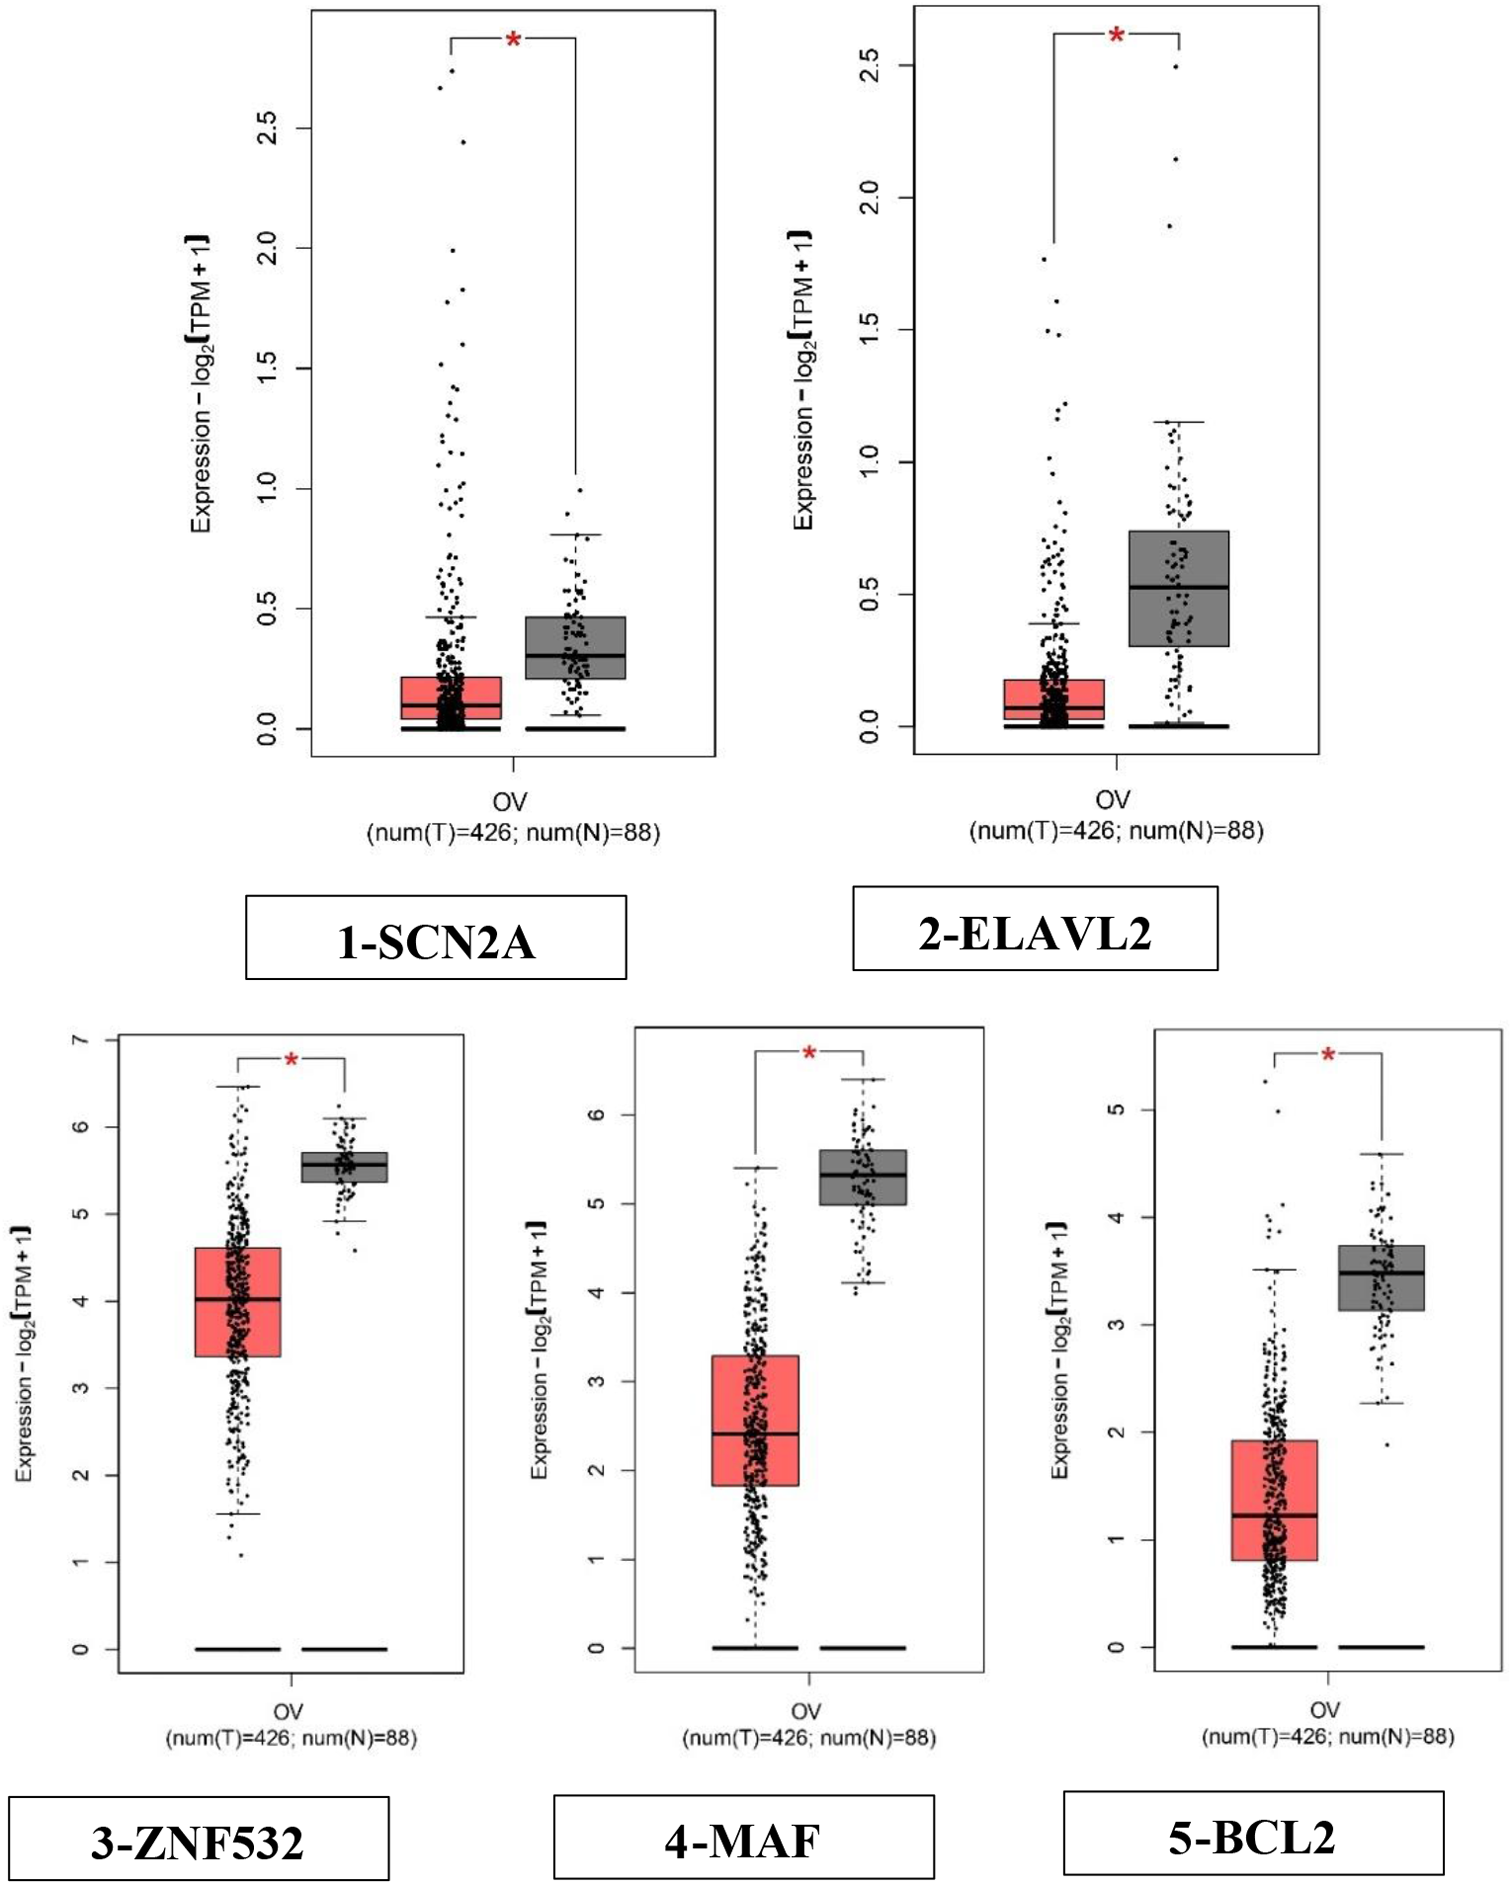
GSE14407 and GSE18520 from the GEO database were obtained to further analyze hub gene expression. The GEPIA2.0 database (GEPIA2.cancer-pku.cn) integrates sequencing data from TCGA and CTEx databases. The GEPIA2.0 database was used to evaluate the expression levels of hub genes.
Prognostic signature of hub genes
The Kaplan–Meier plotter (www.kmplot.com) was used to perform OS, progression‐free survival (PFS), and post-progression survival (PPS) analyses of hub genes.
Immune analysis
The TIMER algorithm was performed to calculate the abundances of B cells, Macrophage cells, Dendritic cells, Neutrophil cells, CD4+ T cells, and CD8+ T cells. The MCP Counter algorithm was used to calculate the abundance of ten immune infiltrating cells. The Stromal, ESTIMATE, and immune scores were calculated to estimate the immune status in OC using the ESTIMATE algorithm. Furthermore, CIBERSORT was used to distinguish between 22 human immune cell phenotypes.
GeneMANIA analysis
GeneMANIA (http://www.genemania.org) is a protein database that analyzes the core proteins and their interactions. This database explains the functional networks between genes and promotes research on their functions.
Construction of ceRNA network
The Starbase (https://starbase.sysu.edu.cn/starbase2/index.php) and TargetScan (http://www.targetscan.org/vert_72/) databases were used to predict the hub gene miRNAs. Common miRNAs were used in the Starbase and TargetScan databases to predict lncRNAs. The collected miRNAs, lncRNAs, and hub genes were connected to construct a ceRNA regulatory network. More details are in Supplementary File 7.
Drug sensitibity analysis
The molecular and pharmacological data of the NCI-60 cancer cell line were downloaded from CellMiner (https://discover.nci.nih.gov/cellminer/home.do), and the correlation was evaluated between IRF6 mRNA expression levels and drug sensitivity using Pearson’s correlation coefficient.More details are in Supplementary File 8.
Ovarian cancer tissue and immunohistochemistry
Tumor and normal samples from ovarian cancer patients were obtained from the Affiliated Sir Run Run Shaw Hospital of Zhejiang University School of Medicine, all detailed information of patients are listed in Supplementary File 9. Paraffin-embedded tissues from Tumor and normal samples were sectioned for immunohistochemistry. Briefly, sections were deparaffinized in xylene and dehydrated using a graded ethanol series. After deparaffinization and rehydration, the endogenous peroxidase activity was blocked with 0.3% hydrogen peroxide in methanol for 30 min. Following heat-mediated antigen retrieval in sodium citrate buffer (pH 6.5), the blocked sections were incubated with anti-IRF6 antibody (1:100 dilution; Santa Cruz Biotechnology, Santa Cruz, CA) overnight at 4 °C. The signal was amplified by adding 3–3'-diaminobenzidine to the avidin–biotin-peroxidase complex (Beyotime, China). Finally, the sections were counterstained with hematoxylin and observed under a microscope.
Cell culture and transfection
The human OC cell line SKOV3 (Homo sapiens, human; RRID: CVCL_0532) was purchased from the Cell Bank of the Chinese Academy of Sciences (Shanghai, China). The cell line was authenticated by STR profiling. The cells were cultured in DMEM supplemented with 10% FBS, 100 U/mL of penicillin sodium, and 100 mg/mL of streptomycin sulfate. The cells were then incubated at 37 °C with 5% CO2. SKOV3 cells were cultured in 12-well plates and transfected with si-NC or si-IRF6 using Lipofectamine 3000 (Invitrogen, Carlsbad, CA, USA), according to the manufacturer’s instructions. All experiments were performed using mycoplasma-free cells. The sequences of siRNA-IRF6 and si-control were 5ʹ- CTGAGCATATTACCAATGA -3ʹ and 5ʹ- TTCTCCGAACGTGTCACGT -3ʹ.
Transwell invasion and scratch assays
The migration and invasion of the human OC cell line SKOV3 were evaluated using a Transwell assay with a 24-well, 8-µm pore size Transwell plate (Costa, Cambridge, MA). Before seeding the cells onto the membrane for invasive testing, 100 μL of 1:10 DMEM filtered Matrix (BD, USA) was added to each well and incubated at 37 °C for 6 h, then SKOV3 cells transfected with si-NC or si-IRF6 (1 × 10⁵ cell/well) were inoculated in the upper chamber (serum-free medium), and 20% FBS culture medium was added to the lower chamber. After 24 h, fixation, and crystal violet staining were performed, and the migrated cells were photographed under a microscope. To assess the cell migration properties of SKOV3, SKOV3 cells transfected with si-NC or si-IRF6 (1 × 10⁵ cell/well) were grown until confluence. When the cell fusion reached 80%, the P200 pipette tip was used perpendicular to the horizontal line to scratch, and the scratch assay was observed under an inverted microscope at 0, 24, and 48 h, respectively. To determine cell migration ability, one examined the wound healing percentage (distance migrated/original wound distance × 100%).
Cell proliferation assay based on CCK8 (Cell Counting Kit-8) assay
The human OC cell line SKOV3 were seeded in 96-well plats with 2 × 10⁴ cell/well and were cultured for 0 h, 24 h, 48 h or 72 h. 10 μL of CCK8 solution (Yeasen, Shanghai, China) were added to each well and incubated for 2 h at 37 °C. A microplate reader was used (Thermo Fisher Scientific, Waltham, USA) to measure optical density at 450 nm (OD450nm).
RT-qPCR
Human ovarian cancer tissues and adjacent noncancerous tissues were collected, and total RNA was extracted using TRIzol Reagent (Invitrogen) according to the kit instructions. 1 μg of total RNA was reverse‐transcribed to cDNA using the cDNA Reverse Transcription kit (Vazyme, Nanjing, China) at 37 °C for 60 min. Real-time PCR was performed using TB Green™ Premix Ex Taq™ II (RR420A; Takara, China) in a Roche LightCycler®96 qRT-PCR system according to the manufacturer’s protocol. Primers for IRF6 (interferon regulatory factor 6) were, forward: 5′- CCCCAGGCACCTATACAGC-3′ and reverse: 5′- TCCTTCCCACGGTACTGAAAC-3′; GAPDH was used as an internal reference for the calculation of IRF6 RNA expression, expression difference was calculated using 2−ΔΔCT method.
Statistical analysis
GraphPad Prism 8.0 software was used for data analysis. All data are expressed as mean ± standard deviation (SD) and mean ± standard error of the mean (SEM). Group differences with P < 0.05 were considered statistically significant using Student's t‐test.


留言 (0)