Microarray data acquisition
The primary data of ovarian cancer RNA-sequencing profiles and corresponding clinical information were acquired from the TCGA database (http://portal.gdc.cancer.gov/). A total of 146 patients were obtained according to the following criteria: comprehensive gene expression data; exclusive clinical data, including LNM status, age, race, histological type, clinical stage, and vital status. 99 patients were LyI+, while 47 were LyI-.
Three gene expression profiling datasets, including mRNA expression data of HGSOC samples and matched normal ovarian tissues, were obtained from the GEO database (https://www.ncbi.nlm.nih.gov/geo/). The number of HGSOC samples vs. normal tissues in the GSE18520, GSE54388, and GSE27651 datasets was 53 vs. 10, 16 vs. 6, and 22 vs. 6, respectively.
Data mining for LNM-related DEGs and HGSOC-related DEGs
The LNMS-related DEGs (LyI+ vs. LyI-) were screened using the edgeR package, and the threshold for a significant difference was set to |log2 Fold Change | > 0.585 (that is, Fold Change > 1.5 or Fold Change < 1/1.5) and P-value < 0.05. Then, DEGs mining of the four GEO profiles (HGSOC vs. normal) was performed under the same conditions using the limma package. DEGs co-existing in all three GEO profiles with the same down- or upregulation trend were defined as the final cancer-related DEGs of ovarian cancer. By overlapping the upregulated LNM-related DEGs and the upregulated cancer-related DEGs, a total of 12 overlapping genes were obtained.
Validation of the expression of the overlapping 12 genes and its relationship with prognosis in ovarian cancer
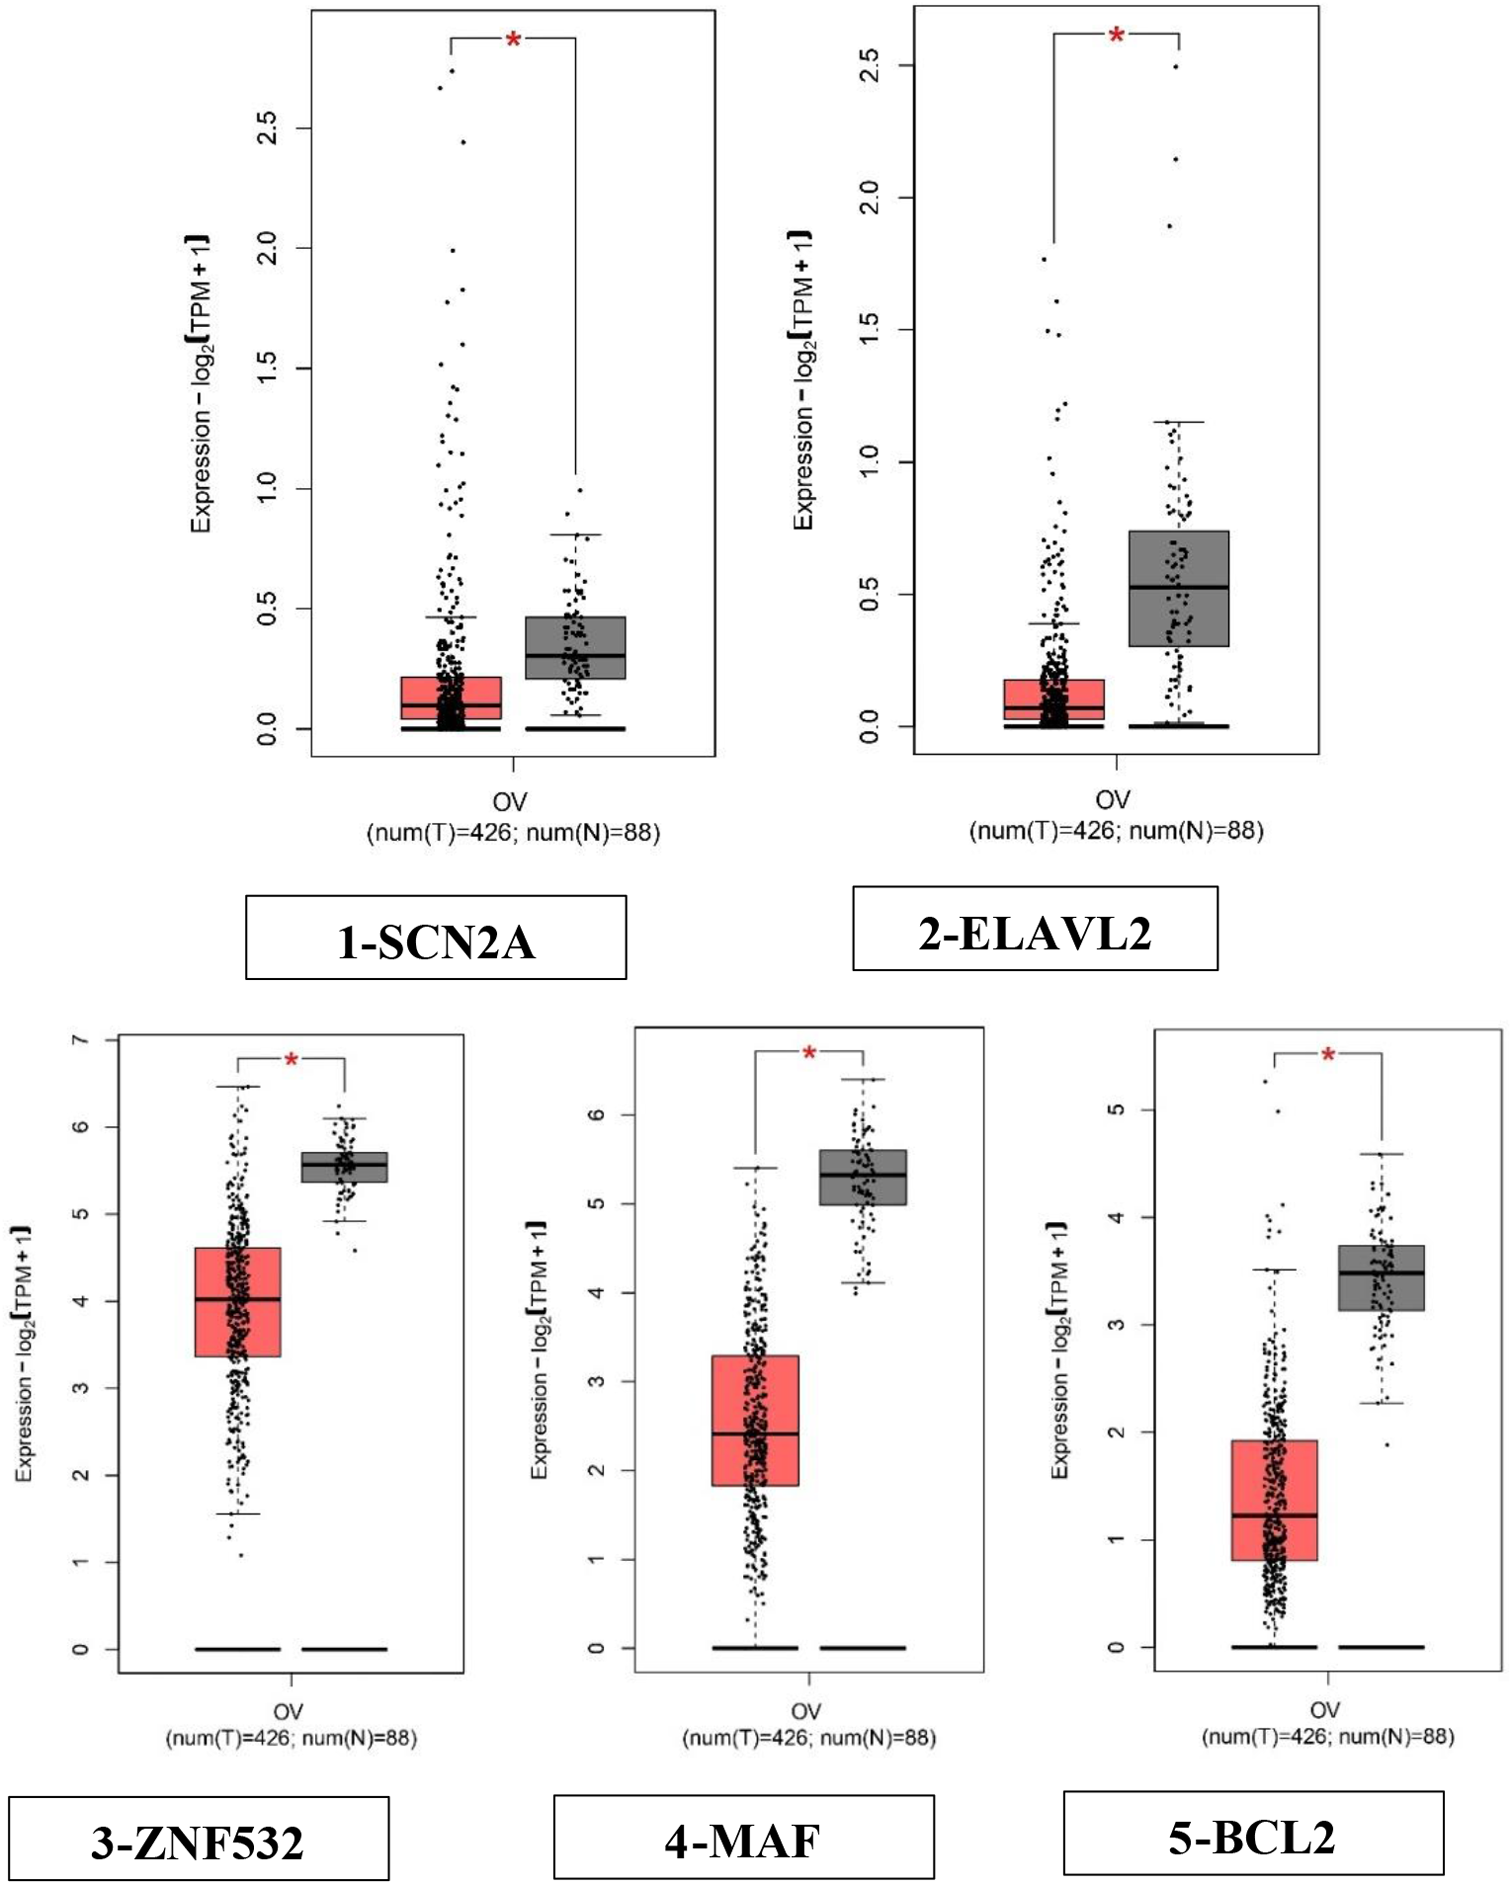
The gene expression levels of the overlapping 12 genes in ovarian cancer tissues and normal ovarian tissues were verified using data from the TCGA and GTEx databases (https://gtexportal.org/). A fold change > 2 and a P-value < 0.05 were considered significant differences. The ROC analysis was performed to assess the predictive ability of the overlapping 12 genes in predicting the sample state (normal or tumor) and lymph node metastatic state (LNM+ and LNM-). The value of AUC is between 0.5 and 1. The closer the AUC is to 1, the better the diagnostic effect. AUC has low accuracy when it is 0.5-0.7, AUC has certain accuracy when it is 0.7-0.9, and AUC has high accuracy when it is above 0.9.
The survival analysis was conducted via Kaplan–Meier plotter (http://kmplot.com/analysis/) to achieve the OS and PFS analysis of the expression of the overlapping 12 genes in ovarian cancer. A P-value < 0.05 was regarded as statistically significant.
Gene expression of MEOX1 and its association with prognosis in pan-cancer via the public databases
The pan-cancer expression landscape of MEOX1 mRNA was obtained via the UALCAN (http://ualcan.path.uab.edu/analysis-prot.html) and TIMER2.0 (http://timer.cistrome.org/) website. Via the GEPIA2.0 (http://gepia.cancer-pku.cn), we analyzed the differences in mRNA expression of MEOX1 between tumor tissues (TCGA data) and normal tissues (GTEx data). Using the Oncomine (http://oncomine.org/) platform, we examined the mRNA expression of MEOX1 in various tumor tissues (Su Muti-cancer statistics, reporter: 36010_at) and various tumor cell lines (Staunton Cellline Statistics, reporter: U10492_at). The CCLE database (https://sites.broadinstitute.org/ccle) rendered the mRNA expression of MEOX1 in pan-cancer cell lines, including ovarian cancer. The relation between MEOX1 expression and clinical survival in pan-cancer was obtained from the “Pan-Cancer” module on the ACLBI (https://www.aclbi.com/) website.
The association of MEOX1 expression with tumor grade and histopathology of ovarian cancer
The mRNA level of MEOX1 in different histopathological types of ovarian cancer was obtained from the Oncomine (Schwartz Ovarian Statistics, reporter: U10492_at; Meyniel Ovarian Statistics, reporter: 205619_s_at). The relationship between MEOX1 expression and G stage in ovarian cancer in GSE27651 was obtained from the GEO database.
GSEA and pathway analysis of MEOX1 in ovarian cancer
According to the average expression level of MEOX1, the ovarian cancer cases in TCGA were categorized into a MEOX1 high expression group (MEOX1-high, n = 107) and a MEOX1 low expression group (MEOX1-low, n = 272). Then, enrichment of DEGs between MEOX1-high and MEOX1-low was performed by the GSEA analysis using the GSEA software and Hallmark signatures EMT, G2M checkpoint, “PID_Lymph_Angiogenesis_Pathway”, and “CLASPER_Lymphatic_Vessels_During_Metastasis_Up”. Enriched datasets with a false discovery rate (FDR) < 0.05 and P-value = 0.01 were considered statistically significant.
The expression correlation between MEOX1 and pathways in ovarian cancer was analyzed via the ACLBI website: after obtaining the expression profile data of ovarian cancer in the TCGA database, download all gene sets included in the relevant pathways such as EMT markers, degradation of ECM, ECM-related genes, and collagen formation; single sample GSEA algorithm was used to calculate the enrichment score of the samples in the relevant pathways, and the correlation between gene expression and enrichment score was calculated to obtain the correlation between the gene and the pathway.
The expression correlation of MEOX1 with prolymphangiogenic factors or lymphatic endothelial cell markers in ovarian cancer
Downloaded and normalized the transcriptome sequencing data of ovarian cancer from the TCGA database, used Spearman correlation analysis method to analyze the expression correlation between MEOX1 and prolymphangiogenic factors, and finally used ggplot package (https://www.xiantao.love/) to visualize the correlation heat maps. Then, logged in to GEPIA2.0 online database website, selected "Exploration Analysis" - "Correlation Analysis" module, input MEOX1 and the ten signatures of prolymphangiogenic factors, selected Spearman analysis method and chose TCGA ovarian cancer, and the correlation between them could be obtained. Based on the expression levels of lymphatic endothelial cell markers, TCGA ovarian cancer was sorted into the high-expression group and the low-expression group. Then analyze whether there was a significant difference in mRNA levels of MEOX1 between the two groups.
Cell lines and cell culture
The human ovarian cancer cell lines SKOV3, A2780, and OVCAR-5 were obtained from the American Type Culture Collection (ATCC, Virginia, USA), and HO8910 cells were purchased from the Cell Bank of the Chinese Academy of Sciences (Shanghai, China). CAFs were separated and cultured from the ovarian cancer tissues obtained from the Obstetrics & Gynecology Hospital of Fudan University with written informed consent from patients. The acquirement of all clinical samples used in our study was approved by the institute's Ethics Committee of the Obstetrics & Gynecology Hospital of Fudan University. SKOV3 and A2780 cells were maintained in RPMI 1640 (SH30809.01, HyClone, Logan, Utah, USA) containing 10% fetal bovine serum (FBS) (10270-106, GIBCO, California, USA) and 1 × 10⁵ IU/L penicillin and streptomycin (15140-122, GIBCO, California, USA). HO8910 and OVCAR-5 cells were cultured in DMEM (SH30022.01, HyClone, Logan, Utah, USA) supplemented with 10% FBS and 1 × 10⁵ IU/L penicillin and streptomycin. CAFs were cultured in Fibroblast Medium (2301, ScienCell, California, USA). All cells were incubated at 37 °C in a 5% CO2 and 95% air humidified atmosphere.
Suppression or overexpression of MEOX1 in ovarian cancer cells
To downregulate the expression of MEOX1 in ovarian cancer cells, we used Lentivirus (LV)-MEOX1-shRNA1/2 (MEOX1-sh1/2) (Genechem, Shanghai, China) to transfect the cells according to the manufacturer’s protocol. The target sequence of MEOX1-shRNA-1 was GGATGAAGTGGAAGCGTGTGA; the target sequence of MEOX1-shRNA-2 was GGAGGAGCACATCTTCACTGA. Conversely, ovarian cancer cells were transfected with LV-MEOX1(Genechem, Shanghai, China) to overexpress MEOX1.
Quantitative Real-Time PCR (qPCR)
According to the manufacturer's protocol, total RNA was isolated using Total RNA Extraction Reagent (R401-01, Vazyme, Nanjing, China). Reverse transcription was performed using a ReverTra Ace qPCR RT Master Mix (FSQ101, TOYOBO, Osaka, Japan). qPCR was performed with SYBR Green Realtime PCR Master Mix (QPK-201, TOYOBO, Osaka, Japan). The primers used in these studies were: MEOX1 (forward: 5’ -GCAGGGGGTTCCAAGGAAA- 3’, reverse: 5’-GTCAGGTAGTTATGATGGGCAAA-3’) and GAPDH (forward: 5’- GGAGCGAGATCCCTCCAAAAT -3’, reverse: 5’-GGCTGTTGTCATACTTCTCATGG -3’).
Western blot assays
Proteins were extracted from cells using RIPA buffer supplemented with phenylmethylsulfonyl fluoride and a protease inhibitor cocktail. The BCA protein assay kit (P0012, Beyotime Biotechnology, Shanghai, China) was used to determine the protein concentration. Protein samples were separated using SDS-PAGE. Then separated proteins were electrophoretically transferred onto PVDF membranes. After blocking with 5% non-fat milk for 1 h at room temperature, we incubated the membranes with a primary antibody overnight at 4 °C and then incubated them with a secondary antibody for 1 h at room temperature. Chemiluminescence on the protein bands was revealed using High-sig ECL Western Blotting Substrate (180-5001, Tanon Science & Technology Ltd, Tanon, Shanghai, China). The primary antibodies used in the present study were anti-MEOX1 (TA804716, Origene, Wuxi, China), anti-Tubulin (11224-1-AP, Proteintech, Chicago, USA), anti-Vimentin (#5741, Cell Signaling Technology, Danvers, MA, USA), anti-E-cadherin (#3195, Cell Signaling Technology, Danvers, MA, USA), and anti-GAPDH (#5174, Cell Signaling Technology, Danvers, MA, USA).
Immunohistochemistry (IHC)
All clinical samples used in our study were obtained with written informed consent from patients. The institute's Ethics Committee of the Obstetrics & Gynecology Hospital of Fudan University approved the present study (protocol code 2021-94, May 6th, 2021). After heating for 1 h at 65 °C, the paraffin-embedded slides were deparaffinized in xylene and rehydrated in graded ethanol solutions (100%-70%). Then, the slides were subjected to 1% Triton X-100 and 3% hydrogen peroxide at room temperature for 10 minutes in sequence, followed by antigen retrieval using the Antigen Retrieval Buffer (50 × Tris-EDTA, pH 9.0) (36318ES60, Yeasen, Shanghai, China) at 95 °C according to the instructions. Slides were blocked with 5% donkey serum for 1 h at room temperature and then washed three times with PBST (PBS with 0.05% Tween 20). For detection of MEOX1, slides were incubated with a primary antibody against MEOX1 (ab279366, Abcam, Cambridge, UK) overnight at 4 °C. After being washed three times with PBST, the slides were incubated with a secondary antibody at room temperature for 1 h. Next, the slides were overlaid with DAB Horseradish Peroxidase Color Development Kit (G1212-200T, Servivebio, Wuhan, China) according to the instructions after three washes with PBST. Finally, slides were counterstained with hematoxylin, dehydrated, and mounted. For each slide, at least three randomly selected microscopic fields were chosen for quantitative analysis of IHC staining. The evaluation of MEOX1 expression was based on the staining score including the percentage of positive cells in the tissue (0, 0%; 1, 1–10%; 2, 11–50%; 3, 51–70%; 4, 71–100%) and the staining intensity (0, none; 1, weak; 2, moderate; 3, strong).
Transwell migration assay
The migration of ovarian cancer cells was evaluated using the 8 μm pore size, 24-well polycarbonate membrane (353097, Becton,Dickinson and Company, New Jersey, USA). Cells (5 × 10⁴ cells/well) in a conditioned medium were seeded in the upper chamber with the lower chamber supplemented with the double-serum medium. After 24 h, non-migrating cells on the surface of the upper chamber were removed with a cotton swab. Migrating cells on the lower surface were fixed with 4% paraformaldehyde (BL539A, Biosharp, Guangzhou, China), stained with 0.5% Crystal Violet Stain Solution (60506ES60, Yeasen, Shanghai, China), and counted in five random fields per well under an optical microscope.
Cell counting kit-8 (CCK8) assay
Cell proliferation was evaluated using the Cell Counting Kit-8 (C0039, Beyotime Biotechnology, Shanghai, China). A2780 or SKOV3 cells were seeded in 96-well plates after down- or upregulating MEOX1 expression. After culturing for a particular time (24 h, 48 h, 72 h), CCK-8 was added into the medium and incubated for 1 h at 37 °C. The proliferation was measured by a microplate reader (BIO-TEK, Vermont, USA).
Colony formation assay
Cells were plated in six-well plates (2 × 10³ per well), and the medium was refreshed every three days. Ten days later, the colonies were visible and then fixed in 4% paraformaldehyde (BL539A, Biosharp, Guangzhou, China) and stained with 0.5% Crystal Violet Stain Solution (60506ES60, Yeasen, Shanghai, China). Finally, the stained colonies (> 10 cells) were counted using a light microscope.
Tumor xenograft
All animal experiments complied with ethical regulations and were approved by the Animal Welfare and Ethics Group, Department of Experimental Animal Science, Fudan University (Code Number: 202209013S). After being stably transfected with LV-MEOX1-shRNA1/2 or LV-control-shRNA, A2780 cells (5 × 10⁶ in 100 μl PBS) were subcutaneously injected into the 5-6 weeks nude mice (GemPharmatech, Nanjing, China). Approximately one week later, tumors were detectable, and tumor volumes were measured and calculated by the formula V = (maximal diameter × perpendicular diameter2) / 2. After 4 weeks, the mice were euthanized, the transplanted tumor was taken and measured.
Statistical analysis
All values were presented as mean ± S.D and were analyzed and plotted using GraphPad Prism 9.0. The Student's t-test was used to determine whether there was a significant difference between the two groups; One way ANOVA was used to determine whether there was a significant difference between multiple groups. P < 0.05 was considered statistically significant.


留言 (0)