
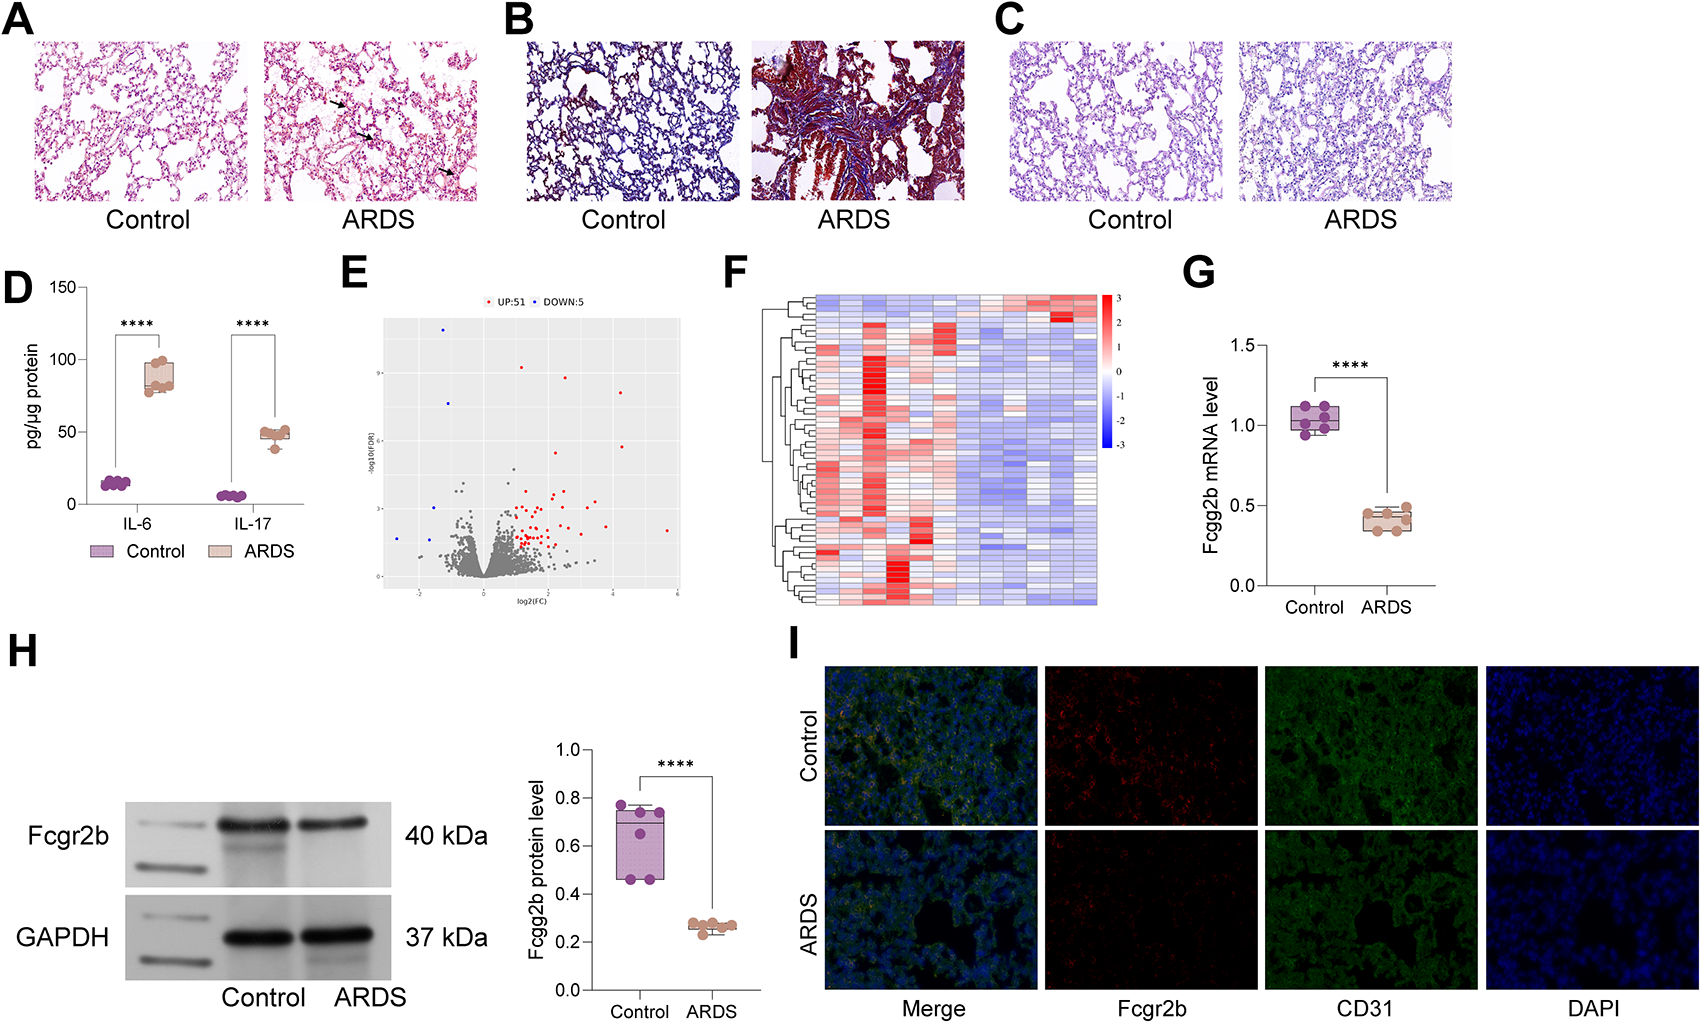
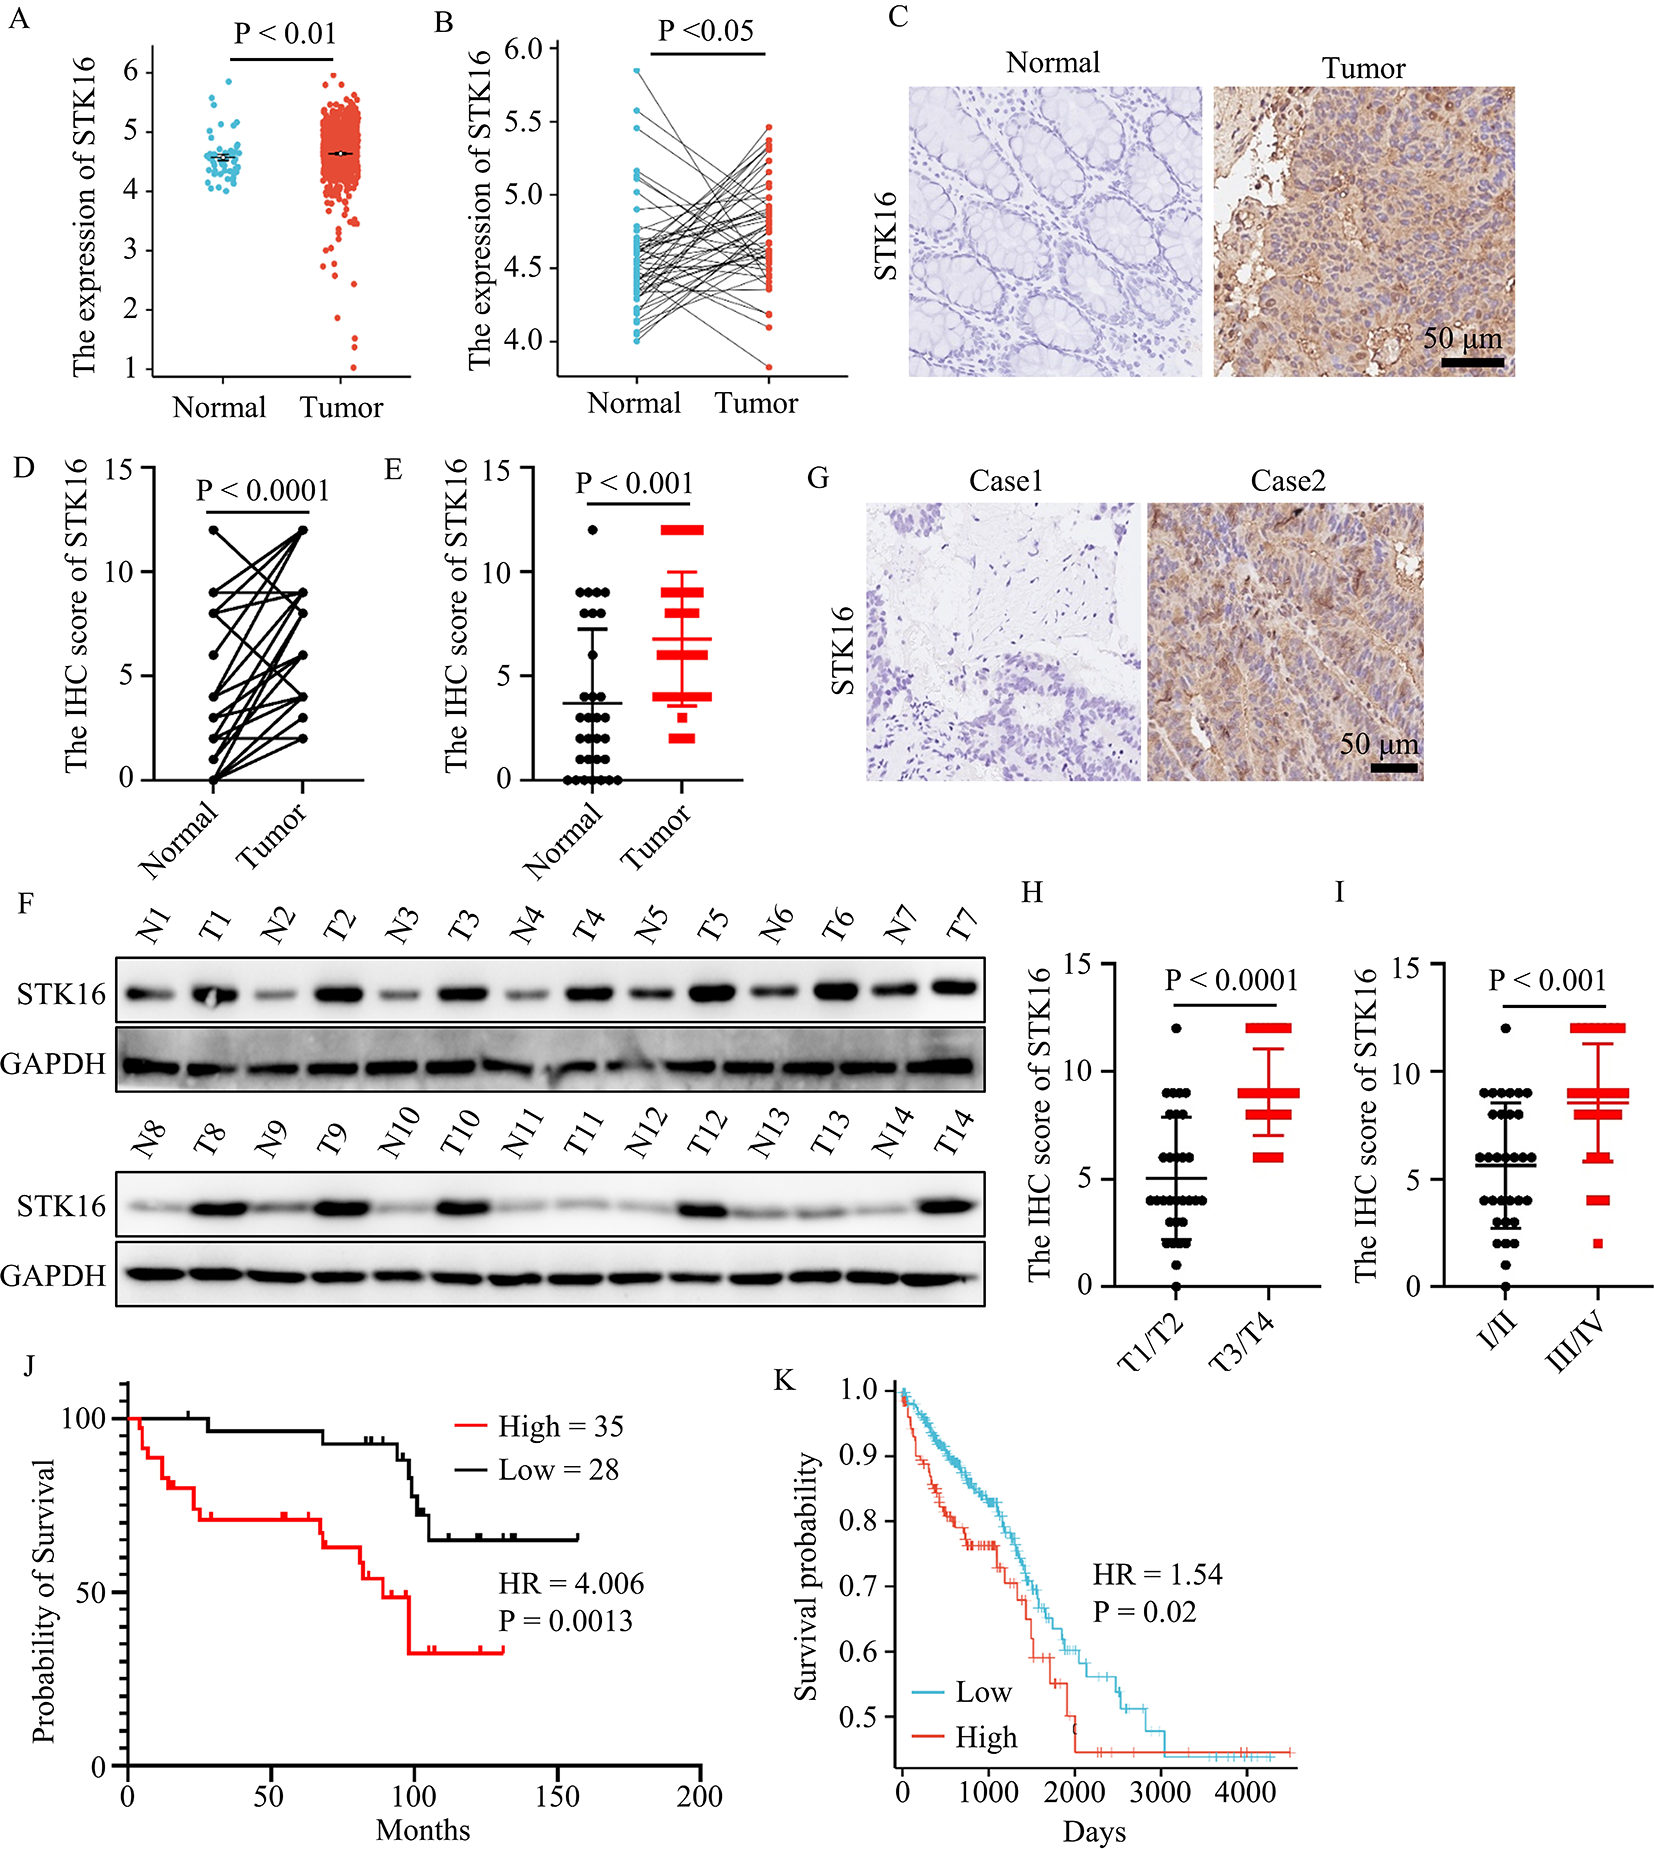
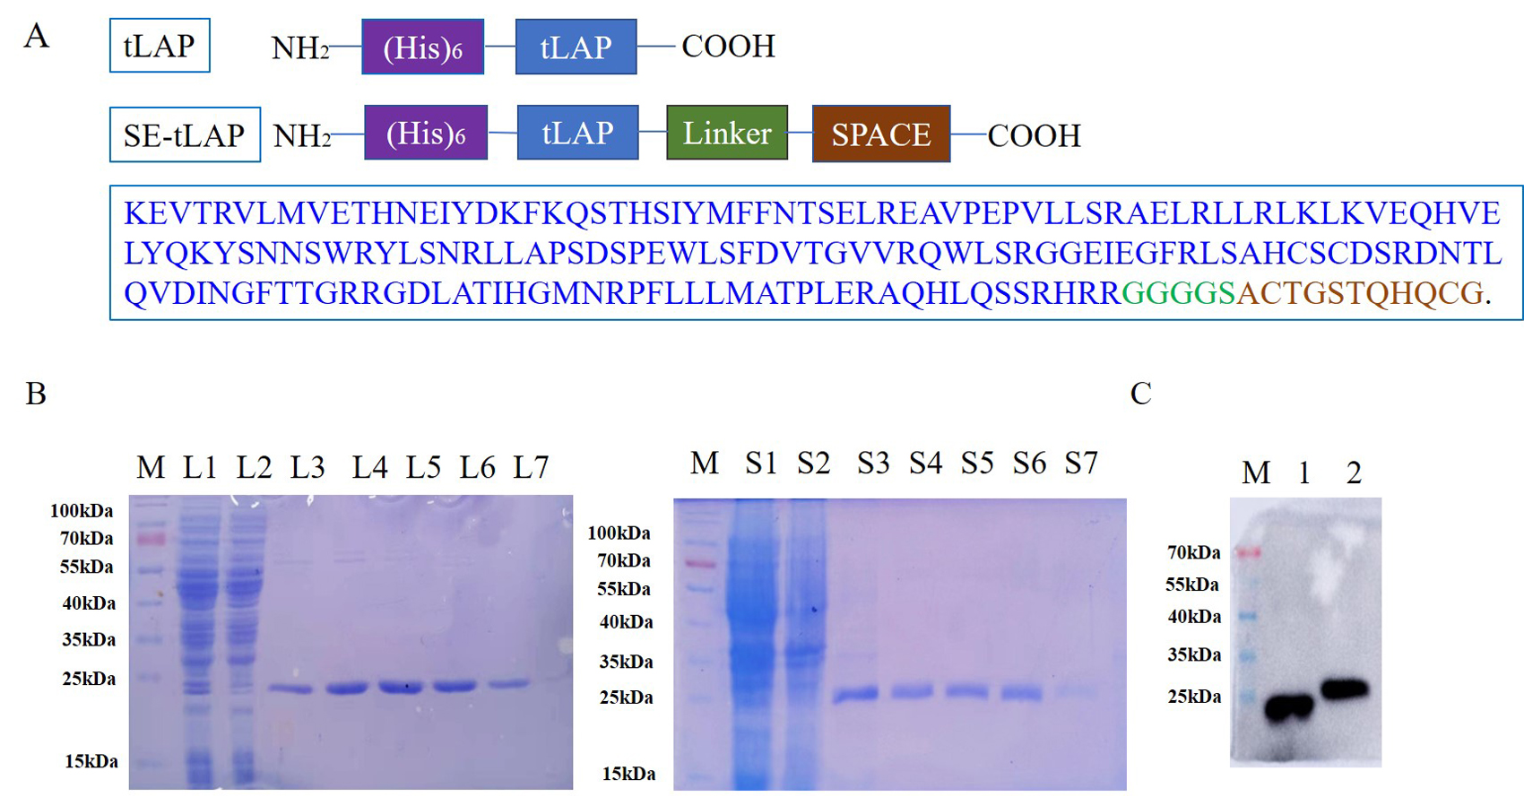
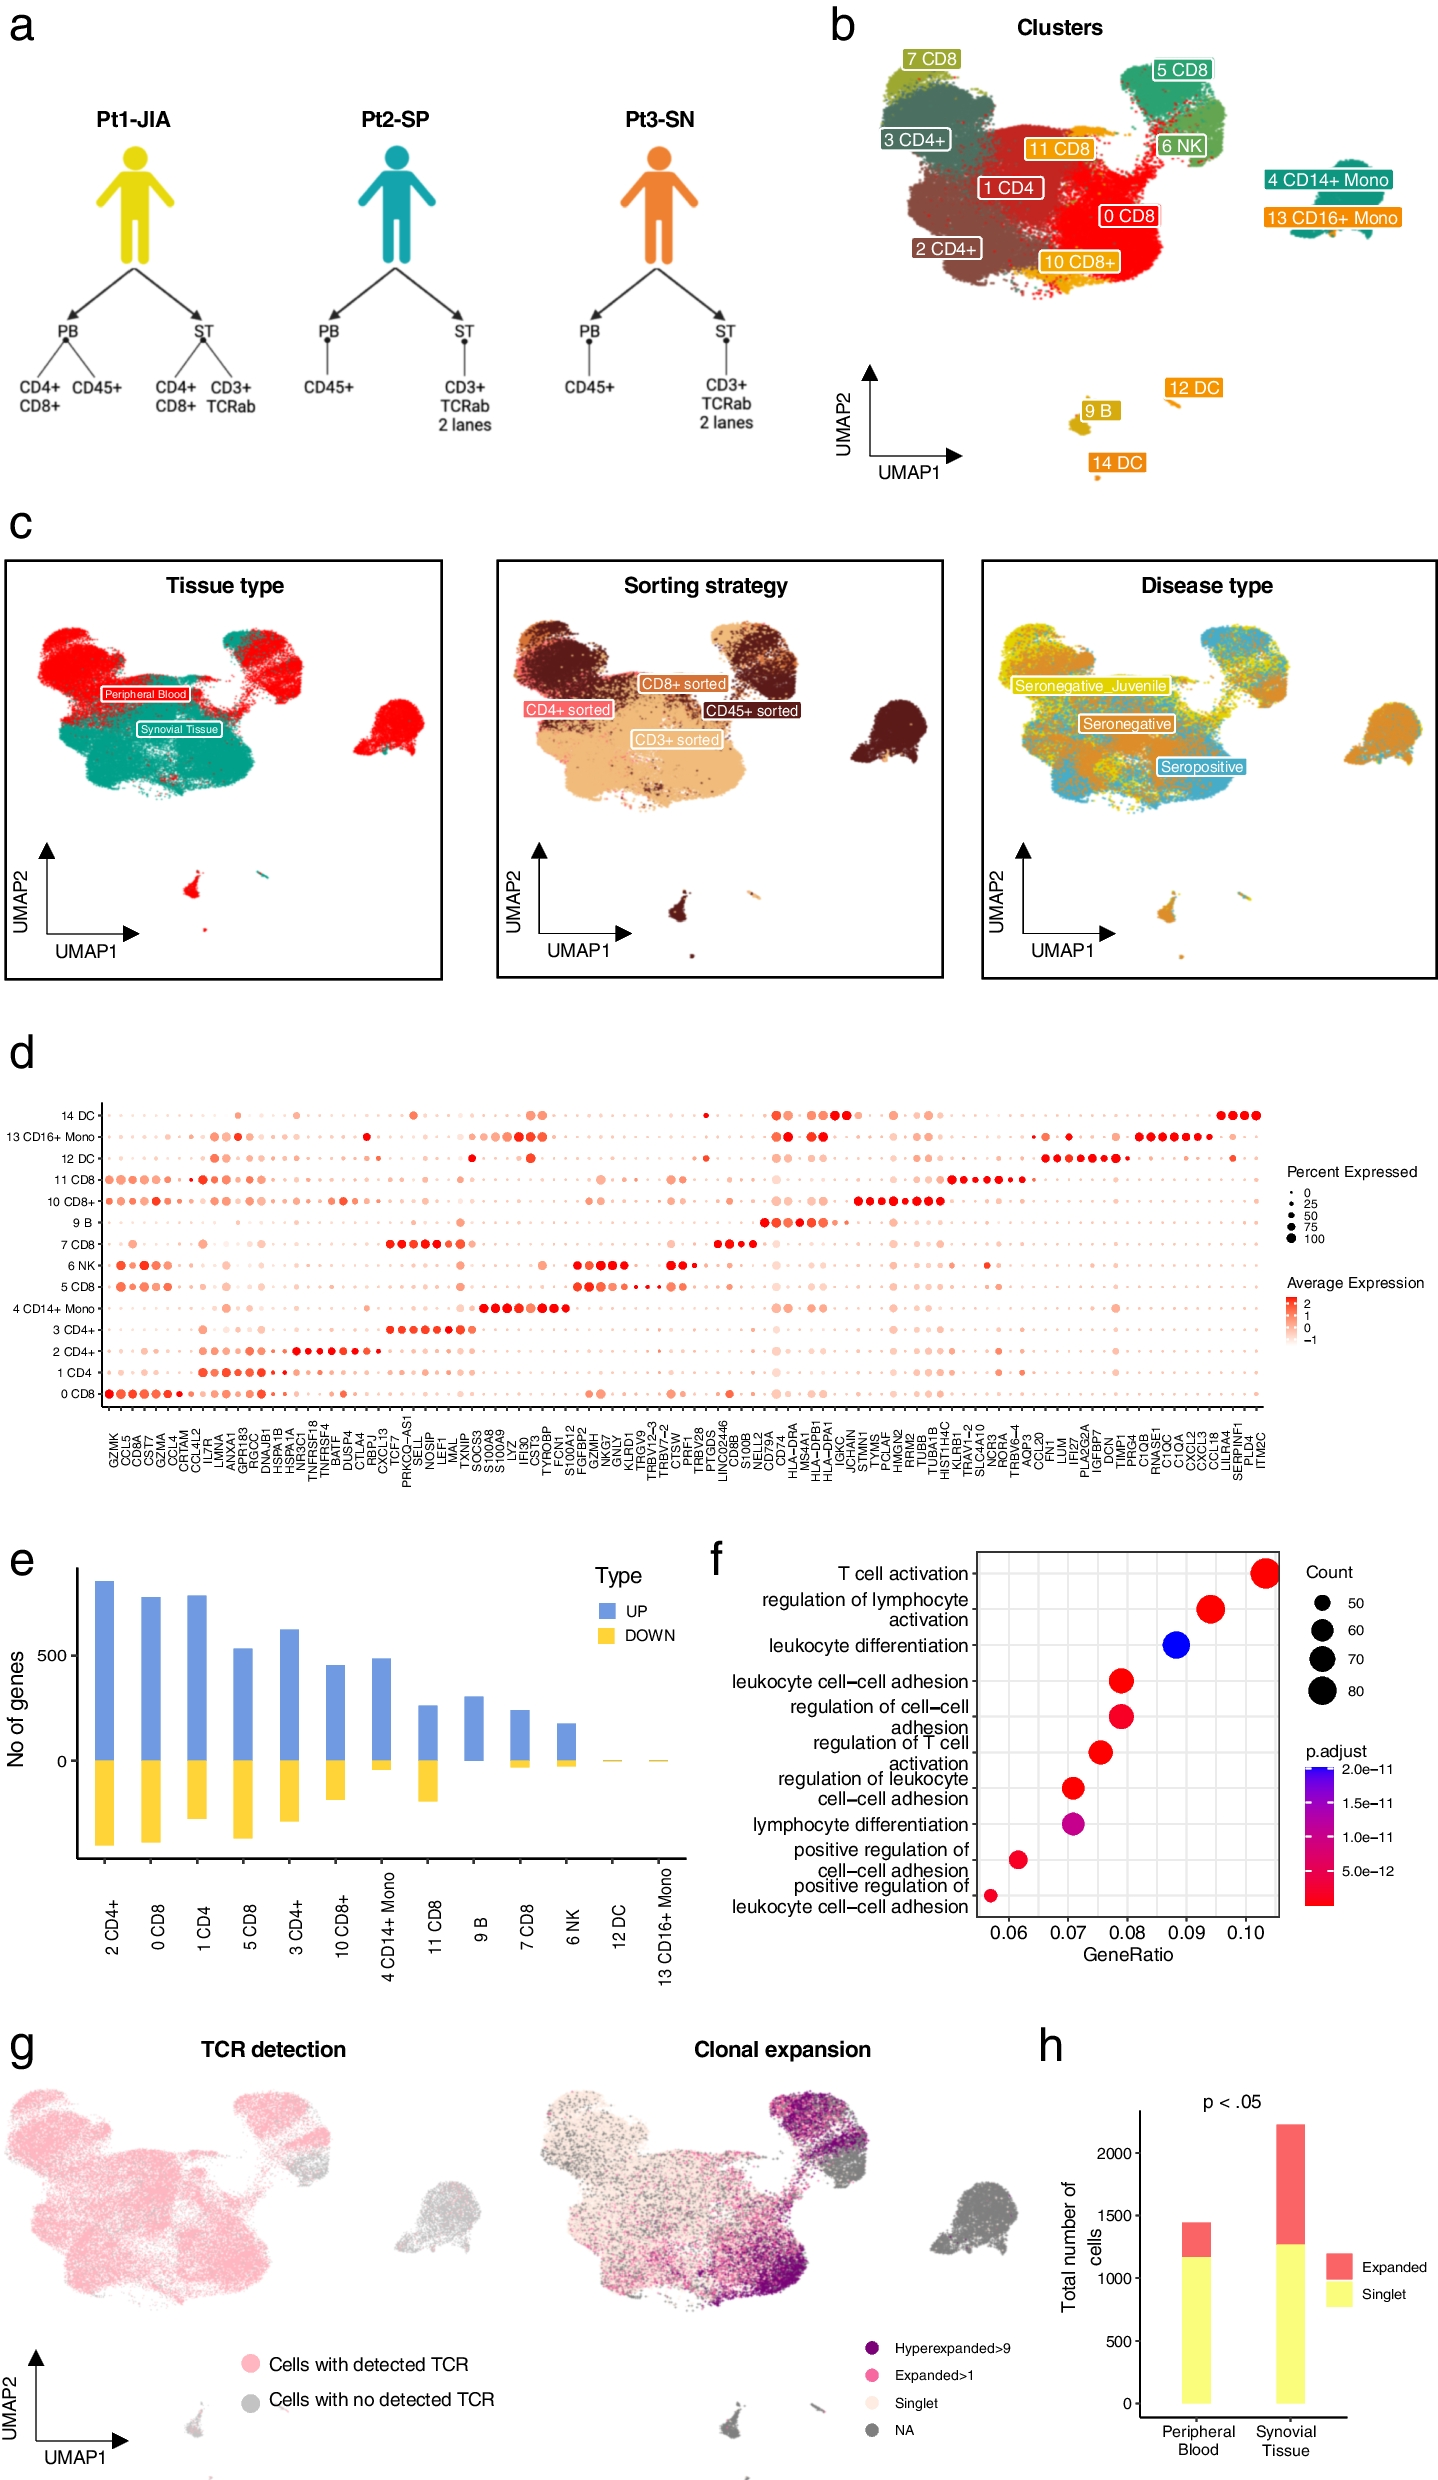
記住我


Digital PCR, in contrast to quantitative PCR (qPCR), is an endpoint PCR method. The basic principle of digital PCR is the random separation of the sample into many individual reactions, where single, parallel PCR reactions take place. These partitions can contain either zero, one, or more than one target molecules (Quan et al. 2018). The primary difference between the available systems is in the separation of the individual reactions. For this mainly droplet/emulsion based, or chip/micro-well based systems are used. We opted to use the chip-based QuantStudio™ 3D Digital PCR System (ThermoFisher). However, we believe that the assays that we have developed could be easily transferred to any platform and technology. After the PCR, positive and negative signals/wells are counted, and quantification of the target sequences is subsequently achieved by using Poisson Plus statistics to calculate the final transcript numbers. For our use, the biggest advantages of digital PCR over qPCR are the greatly increased sensitivity and the fact that no internal or external standards are needed for absolute quantification.
To establish our assays, we used a primary human fibroblast line with extremely long repeat of over 170 CAGs (GM09197, Coriell), which we also previously analysed by qPCR (Neueder et al. 2017). This very long CAG repeat length led to substantial HTT1a expression levels that were easily detectable (Figs. 1 and 2; approx. 1% of HTT1a vs total HTT expression levels). A schematic overview of the position of the assays within the 5’ region of the HTT gene is shown in Fig. 1A. Assay details and sequences are given in Table 1. Figure 1B shows a typical result from a digital PCR chip of the GM09197 fibroblast line. HTT exon 2 transcripts (HTTex2) are shown on the x-axis and HTT1a transcripts on the y-axis. Wells with a positive signal for each assay are shifted towards larger values. Wells that did not contain a target transcript are shown in yellow. Wells that were only positive for either HTTex2 or HTT1a are shown in red or blue, respectively. Wells that contained both target transcripts are shown in green. Histograms for each axis show the thresholds between negative and positive signals (black lines).
Fig. 1
A multiplexed digital PCR assay to analyse HTT1a expression levels in human samples
Fig. 2
HTT1a expression in primary human fibroblasts can only be detected in lines with large CAG expansions
We included HTT exon 2 containing transcripts in our analysis to be able to draw conclusions about the expression levels of ‘full-length’ HTT mRNA, which has been reported to be downregulated with larger repeat lengths in certain tissues (Neueder et al. 2017; Evers et al. 2015). Naturally, other regions of the HTT gene would be feasible to analyse HTT full-length expression levels, too. However, we noticed that the best correlation between assays is reached when the assays target sequences in close spatial proximity (data not shown). This is either an effect of reverse transcription from the polyA tail, or alternative splicing, or other RNA modifying events, that potentially modulate the expression of the more distally different isoforms. Our digital PCR system allows multiplexing of two assays. Therefore, we tested if the HTT1a and HTT exon 2 assays were affected by the multiplexing strategy but could not detect major differences in lymphoblastoid cell lines (Fig. 1C). In particular, the ratio of the two assays was very stable (Fig. 1C, HTT1a/HTTex2 ratio). Regarding the relatively high levels of HTT1a in lymphoblastoid lines from control individuals (Fig. 1C), the reader is referred to the text below.
Furthermore, we analysed the inter-chip variation. To this end, the same cDNAs were run on two individual chips and results were compared (Fig. 1D). Although the inter-chip variation was relatively low, we decided to use two chips as a technical replicate for each sample in all following experiments.
A Schematic overview of assay positions within the 5’ region of the HTT gene. The cryptic polyA site is 7,327 bp into intron 1. Sequences are listed in Table 1. B Exemplary results of a chip-based, multiplexed digital PCR assay. HTT exon 2 transcripts (HTTex2) are shown on the x-axis and HTT1a transcripts on the y-axis. Wells with a positive signal for each assay are shifted towards larger values. Wells that did not contain a target transcript are shown in yellow. Wells that were only positive for either HTTex2 or HTT1a are shown in red or blue, respectively. Wells that contained both target transcripts are shown in green. C and D Samples had CAG sizes in the control (control), adult onset (HD) or juvenile-onset range (HD juvenile). C Comparison of the performance of individually run assays versus multiplexed assays in primary human lymphoblastoid cell lines. The same cDNAs were used for the comparisons. D Assessment of technical inter-chip variation. The same cDNA from human lymphoblastoid cell lines was run on multiple chips. The black line denotes the mean of the individual chips. Each stack represents a different cell line. Ratios were built by dividing the signal of HTT1a/HTT exon 2 for each chip and subsequently calculating the mean for each line.
Validation of the multiplexed digital PCR assayTo validate our multiplexed digital PCR assay, we analysed human post mortem brain tissues and primary human fibroblast lines, both of which we had analysed previously by qPCR (Neueder et al. 2017). When we analysed fibroblast lines, we were able to robustly detect HTT exon 2 in lines with CAG lengths in the control and adult-onset range, however elevated levels of HTT1a were only detectable in lines with very long CAG repeats (> approx. 100) (Fig. 2). No statistically significant differences for the group-wise comparisons were detected (Fig. 2). This is in line of what we had observed previously using qPCR assays (Neueder et al. 2017).
HTT1a and HTT exon 2 (HTTex2) expression in primary human fibroblast lines was analysed in lines with a CAG repeat in the control (control), adult onset (HD) or juvenile-onset range (HD juvenile). We could only detect HTT1a reliably in the lines containing very long CAG repeats (> 100). The black line represents the linear model of expression level with CAG repeat length calculated from the mean of 3 different time points in culture (see also Figure S1A). R2 (coefficient of determination) and P value for the fit of the linear modelling are shown. Grey areas represent the standard error of the regression model. We did not include the line with the very large expansion in the modelling to avoid spurious fits.
Next, we applied digital PCR to different post mortem brain regions (Fig. 3), some of which were analysed previously by qPCR (Neueder et al. 2017) (Fig. 3A and B (juvenile-onset range; CAG > 65) and 3D). In addition, we included samples from post mortem BA9 cortex (Fig. 3C). Throughout all brain regions we detected robust normalised HTT1a (to HTTex2) expression levels in samples with CAG sizes in the juvenile-onset range. Unfortunately, we only had access to two samples with repeats in the adult-onset range and could only analyse 2 out of the 4 brain regions. Normalised HTT1a levels in these samples were on par with HTT1a levels in control individuals (Fig. 3B and C). Our analysis of motor cortex, for which we also had the largest samples size with CAG repeat lengths up to approximately 140, showed a statistically significant, positively correlated relationship of normalised HTT1a levels with CAG repeat length (Fig. 3B). In conclusion, our assays confirmed the previously published data (Neueder et al. 2017) and demonstrated that HTT1a is produced in HD patient brains throughout different regions.
Fig. 3
HTT1a is generated in a CAG repeat-length-dependent manner in post mortem brain regions
HTT1a normalised to HTT exon 2 (HTTex2) expression levels in sensorimotor cortex (A), motor cortex (BA4) (B), BA9 cortex (C) and cerebellum (D) were analysed from HTT mutation carriers with adult-onset CAG repeat lengths (HD) or juvenile-onset CAG repeat lengths (HD juvenile) and control individuals (control), respectively. The black line represents the linear model of expression level with CAG repeat length. R2 (coefficient of determination) and P value for the fit of the linear modelling are shown. Grey areas represent the standard error of the regression model. For data showing the individual HTT isoform expression levels see supplementary Figure S2.
HTT1a expression in lymphoblastoid cell lines might be biased by unintentionally unstable CAG expansionsLymphoblastoid cells lines expand almost indefinitely and thus are widely used as a renewable source of patient specimens. Lymphoblastoid lines were purchased from the European Huntington Disease Network (EHDN, www.ehdn.org). Lines were generated by BioRep (Italy, www.biorep.it) by immortalizing B-cells with Epstein Barr virus (EB virus). We analysed lines with CAG repeats in the control (control), adult-onset (HD) or juvenile-onset range (HD juvenile) (Fig. 4A). We detected high levels of HTT1a expression that significantly increased with CAG repeat length. However, repeat sizing of some of the lymphoblastoid lines show cell populations with highly expanded CAG repeats (Fig. 4B, arrows). We detected these expanded populations in all groups; interestingly some control lines expanded into the disease relevant range (Fig. 4B, control), but not systematically in every line.
Fig. 4
HTT1a is generated in a CAG repeat-length-dependent manner in lymphoblastoid cell lines
AHTT1a and HTT exon 2 (HTTex2) expression in human lymphoblastoid cell lines was analysed in lines with a CAG repeat in the control (control), adult-onset (HD) or juvenile-onset range (HD juvenile). The black line represents the linear model of expression level with CAG repeat length calculated from the mean of three different time points in culture ± SEM (see also Figure S1B). R2 (coefficient of determination) and P value for the fit of the linear modelling are shown. Grey areas represent the standard error of the regression model. B Exemplary CAG repeat size traces from lymphoblastoid lines analysed in A. CAG repeat length of the longer allele determined from total blood DNA is given in brackets. CHTT1a and HTT exon 2 expression analysis of CD123+/CD19+ FACS sorted cells (dotted lines) versus the total population (solid lines). Linear modelling was as in A. D Exemplary CAG repeat size traces from lymphoblastoid lines analysed in C. CAG repeat length of the longer allele determined from total blood DNA is given in brackets.
Next, we wanted to determine, whether most of the cells in the lymphoblastoid lines, which were CD123+/CD19+ cells (corresponding to a population of dendritic like cells left after immortalisation), were also responsible for the high levels of HTT1a expression. To this end, we FACS sorted the dendritic cells and analysed HTT exon 2 and HTT1a expression levels in comparison to the total population (Fig. 4C). We detected comparable levels of HTT exon 2 expression. However, expression levels of HTT1a were comparatively lower in the CD123+/CD19+ cells than in the total population suggesting that another cell type, other than CD123+/CD19+ cells, was generating the high levels of HTT1a (Fig. 4C). CAG repeat sizes in the CD123+/CD19+ cells were generally the same as in the total population (Fig. 4D). While this was certainly an interesting observation, given the issues around CAG repeat instability in these lines and the generation through EB virus transduction, a careful further evaluation of HTT1a expression in different cell types isolated from native blood cells is required in future experiments.
HTT1a is generated in a CAG repeat-length-dependent manner in PBMCs, but not in skeletal muscle tissuePBMCs from blood, as well as skeletal muscle, are easily accessible peripheral sample sources. The samples can be collected from living individuals and can be rapidly processed. Therefore, they do not suffer from RNA degradation due to post mortem delays. Monitoring HTT1a expression in these samples could be of high clinical relevance.
HTT1a and HTT exon 2 (HTTex2) expression in human skeletal muscle tissue (A) or PBMCs (B) was analysed from HTT mutation carriers (HD) or control individuals (control). The black line represents the linear model of expression level with CAG repeat length. R2 (coefficient of determination) and Pvalue for the fit of the linear modelling are shown. Grey areas represent the standard error of the regression model.
We analysed skeletal muscle samples and PBMCs from HTT mutation carriers in the early manifest stages, as well as age and sex matched control individuals (Fig. 5). HTT exon 2 expression in PBMCs was only about half of the levels in skeletal muscles (Fig. 5, HTTex2). However, HTT1a expression in control individuals was similar in both sample types, indicating either better quality control for splicing in skeletal muscle, or a more severe HD related phenotype in PBMCs as compared to skeletal muscle (Fig. 5, HTT1a). Consequently, we detected only slightly elevated expression levels of HTT1a in the skeletal muscle samples from HTT mutation carriers. In contrast, HTT1a levels in PBMCs were significantly higher in HTT mutation carriers compared to unaffected individuals and increased with CAG repeat lengths (Fig. 5B).
Fig. 5
HTT1a is generated in a CAG repeat-length-dependent manner in PBMCs, but not in skeletal muscle tissue
留言 (0)