
記住我


Rotator cuff (RC) tears are a common cause of shoulder pain and disability, and its prevalence is known to increase with age.1 Common symptoms include shoulder pain and weakness of shoulder flexion, abduction, and internal and external rotation, depending on the tear pattern, restricting everyday activities and affecting the quality of life.1 In case of failed conservative treatment, minimal invasive arthroscopic RC repair is the current criterion standard for treatment of symptomatic full-thickness RC tears. However, retear rates of up to 27% at 2 years after surgery have been reported.2,3
After a tendon tear, the RC muscle undergoes degenerative changes including fatty infiltration and atrophy.3–6 Recent studies correlated preoperative fatty infiltration of the RC muscles with RC repair outcome mainly for the supraspinatus (SSP) muscle, but there are contradicting results in the literature about which threshold of fatty infiltration should be used for outcome prediction.7–9 Improved preoperative screening with reliable biomarkers would be beneficial to predict the risk of retear and select those patients for surgery where a good outcome is likely.
Fatty infiltration of the RC muscles is commonly assessed with the Goutallier classification.10 However, it was reported that this classification might be affected by the retraction of the myotendinous unit, and the interrater reliability is limited (reported κ range of 0.41–0.91), making the Goutallier classification less useful in predicting the surgical outcome.11,12
Recently, different quantitative methods to assess the degree of fatty muscle infiltration more objectively were proposed. Some of the most promising methods include chemical shift–based techniques such as single-voxel magnetic resonance spectroscopy and frequency selective magnetic resonance imaging (MRI), as well as chemical shift–encoded multipoint water-fat separation techniques.13–17 Dixon-based techniques including extended 2-point Dixon methods were also successfully used for fat quantification, in particular for calculating proton density fat fraction (FF) of the RC muscles.17–19 Predicting the outcome of arthroscopic RC repair by assessing quantitative data for FF and muscle atrophy before and after successful RC repair was shown to be feasible. However, the reported measurements are controversial, often limited by small patient cohorts, a small number of retears, and the studies mainly focused on the assessment of the SSP, although RC repair of the subscapularis (SSC) and infraspinatus (ISP) tendon is also commonly performed.7–9 Nozaki et al8 reported preoperative FFs of up to 37% of the SSP muscle for patients with failed RC repairs, which is contradictory to the report by Wieser et al7 who found a preoperative FF of 7.8% in patients with failed SSP repairs. Both studies are limited by the relatively small number of patients with SSP retear, and so far, no reliable cutoff values regarding the FF and atrophy of the RC muscles have been defined for predicting the retear probability.
The purpose of this study was to quantitatively and longitudinally analyze RC muscle fatty infiltration and volume before and after arthroscopic RC repair and compare the results of successful repairs with failed operative or conservative treatment, in order to define cutoff values for FF which best predict retear or success after arthroscopic RC repair.
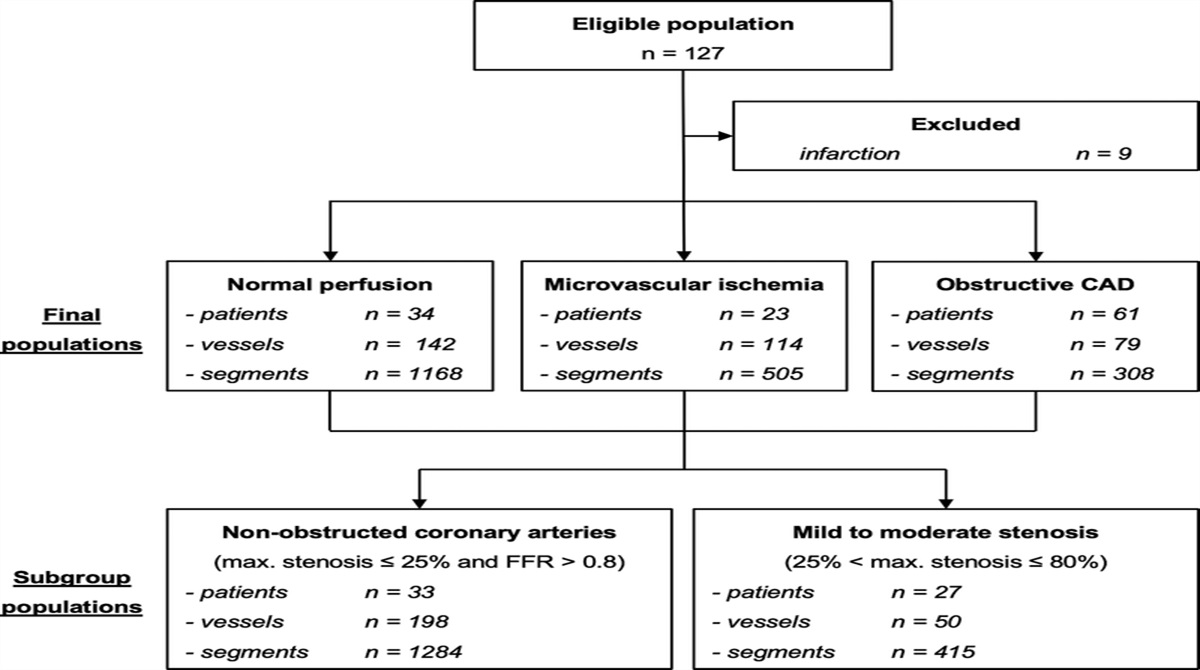
MATERIALS AND METHODS Patient SelectionIn this retrospective study, electronic patient records were screened for the diagnosis of a full thickness tear of at least 1 RC tendon (SSP tendon, ISP tendon, SSC tendon, or teres minor tendon), and patients were eligible if they received an MRI of the shoulder including a 2-point Dixon sequence between July 2016 and December 2022 (n = 879, Fig. 1). Because of the effects of antirheumatic treatment on muscle mass and body fat distribution, patients with inflammatory rheumatoid arthritis were excluded. In addition, patients with a history of surgery for fractures or osteoarthritis were excluded. The remaining patients were divided according to their treatment into a conservative treatment group (n = 203) and a surgical treatment group (n = 623). Both groups were screened for a follow-up MRI including the 2-point Dixon sequence (n = 284). Magnetic resonance examinations with and without MR arthroscopy were reviewed. Of the 284 eligible patients with 2 imaging time points, 91% (n = 259) patients underwent MR arthroscopy at baseline imaging and 93% (n = 264) patients at follow-up imaging. The indications for follow-up MR imaging were persistent pain and discomfort in the shoulder, as well as functional limitations.
 FIGURE 1:
 Patient selection flowchart. Patients with a full-thickness rotator cuff (RC) tear of at least 1 tendon undergoing magnetic resonance imaging (MRI) before and after arthroscopic RC repair including a 2-point Dixon sequence were screened for eligibility. First, patients with retear of 1 or more RC tendons diagnosed on MRI (Sugaya IV and V) were enrolled into group 1. Afterward, 1 or preferably 2 patients with intact RC repair (Sugaya I and II) were enrolled in group 2 and matched for age, sex, body mass index, and MRI time interval to group 1. A third group (group 3) with conservatively treated full-thickness RC tears was included as reference and was also matched to the failed RC repair group (group 1).
Patients in the surgical treatment group were assessed for the RC repair outcome, categorized according to the Sugaya classification into failed RC tendon repairs (Sugaya IV and V) and intact RC tendon repairs (Sugaya I and II20). Patients from the failed RC repair group were matched for age, sex, and preoperative tear size and location (Patte and Cofield classifications21,22) to at least 1 patient from the intact RC repair group and 1 patient from the conservative treatment group, which served for comparison. The study was approved by our institutional review board (Cantonal Ethics Committee Zurich (BASEC Nr. 2023-00180)). Written informed consent was obtained from all study participants.
Magnetic Resonance ImagingAll patients underwent initial MRI of the shoulder in a 3 T scanner (MAGNETOM Skyrafit or MAGNETOM Vida; Siemens Healthcare) with a dedicated 16-channel shoulder coil. Because of the implanted material, the follow-up MRI was performed with metal artifact reduction sequences in a 1.5 T scanner (MAGNETOM Avantofit or MAGNETOM Sola; Siemens Healthcare). The MRI protocols were equivalent for all patients at each imaging time point. A sagittal oblique 2-point Dixon sequence was part of the routine shoulder imaging protocol due to its fast acquisition time compared with 6-point Dixon imaging and MR spectroscopy. The 2-point Dixon sequence was acquired at 3 T with the following parameters: echo time, 1.31 milliseconds and 2.57 milliseconds (in and opposed phase, respectively); field of view, 160 × 160 mm; bandwidth, 1010 Hz/Px; and acquisition matrix, 120 × 160. At 1.5 T, the echo times were 2.39 milliseconds and 4.77 milliseconds for in-phase and opposed-phase images. To reduce susceptibility artifacts on follow-up MRI, clinical metal artifact reduction sequences were used in which the radiofrequency and readout bandwidth were increased. Detailed scan parameters are shown in the Supplementary Material (https://links.lww.com/RLI/A904). Water-only, fat-only, in-phase, and out-of-phase images were generated from the 2-point Dixon sequence. Signal intensity values on in-phase and fat-only images were defined as S(In) and S(Fat). The FF maps were calculated as the following7,17,19:
SWater+SFat=SIn
Before images were transferred to the picture archiving and communication system (PACS), the image quality was visually checked by the MR technologist for image artifacts such as motion, streaking, or water/fat swapping. In the case of severe artifacts, the images were not transferred, and the acquisition was repeated.
Image AnalysisThe RC tendons were graded preoperatively according to their integrity into full-thickness tears, partial thickness tears, and no tear/tendinopathy. The integrity of the RC after arthroscopic repair was rated according to the Sugaya classification: type I (intact repair with sufficient thickness and homogenous signal of the repaired tendon), type II (intact repair with sufficient thickness and partial high-signal intensity area), type III (insufficient thickness without discontinuity), type IV (minor discontinuity on fewer than 2 slices), type V (major discontinuity over at least 2 slices) (Fig. 2).20 The RC tendon tear size was assessed using the Cofield classification, dividing the tear into small (<1 cm), medium (1–3 cm), large (3–5 cm), and massive (>5 cm).21 The degree of tendon retraction of the SSP tendon was graded using the Patte classification22 (stage 1, proximal stump near the bony insertion; stage 2, proximal stump at the level of the humeral head; and stage 3, proximal stump at the level of the glenoid). Qualitative assessment of the fatty infiltration was done using the Goutallier grades 0–4: grade 0, normal muscle; grade 1, some fatty streaks; grade 2, less than 50% fatty muscle atrophy; grade 3, 50% fatty muscle atrophy; and grade 4, greater than 50% fatty muscle atrophy.10 Magnetic resonance images were analyzed by 2 radiologists ([R.M.] with over 10 years of experience and [G.F.] with over 4 years of experience in radiology). The assessment of the preoperative RC tears and the postoperative Sugaya classifications were performed as consensus readings. In case of disagreement, a third reader ([R.S.] with over 15 years of experience) was asked for a decision. Analysis was performed on a PACS workstation certified for clinical use (MERLIN 7.1.22; Phönix-PACS GmbH). The images were read individually and independently in random order and blinded to clinical information and any other imaging data.
 FIGURE 2:
 MR-based evaluation of the outcome of arthroscopic RC repair using the Sugaya classification in MR arthrography (A, B, and D) and noncontrast MRI (C). In A, an intact RC repair is shown (Sugaya I; arrow) without relevant signal inhomogeneities of the repaired tendon. B also shows a patient with intact RC repair with sufficient thickness of the repaired tendon but with signal inhomogeneities (Sugaya II; arrow). In C and D, failed RC repairs are shown with small (C, Sugaya IV) and large (D, Sugaya V) retears of the supraspinatus (SSP) tendon (asterisk).
Quantitative AnalysisQuantitative analysis of the RC muscle FF and semiautomatic volumetric segmentation of the muscles was performed by [G.F.]. The segmentations were performed in the sagittal oblique plane of the FF images calculated from the 2-point Dixon sequences using ITK snap.23 Regions of interest (ROIs) were manually drawn on every fifth slice of each RC muscle, and the missing ROIs were semiautomatically interpolated by the segmentation software. Semiautomatic slice interpolation is based on a method proposed by Albu et al.24 It is performed by first determining the correspondence between shapes on adjacent segmented slices by detecting overlaps. The corresponding shapes are then aligned by generating a transition sequence of 1-pixel dilations and taking the median as the result. Recursion is used when the original segmented slices are separated by more than 1 empty slice.24,25 Before data extraction, all ROIs were reviewed manually for the correct placement. The mean FF and volume were calculated for each segmented RC muscle at baseline and at follow-up (Fig. 3).
 FIGURE 3:
 A, Sagittal oblique fat fraction (FF) map of a 45-year-old patient calculated from the 2-point Dixon sequence. RC muscles were segmented semiautomatically by drawing regions of interest (ROIs) on every fifth slice around the SSP muscle (B), infraspinatus (ISP) muscle, and subscapularis (SSC) muscle. The missing ROIs were interpolated, and after careful review, fat fraction and volume of the muscles were calculated. C and D are showing 3D models of the segmented SSP muscle (red), ISP muscle (green), and SSC muscle (blue).
A separate cohort of 15 patients was identified to assess the limits of agreement for FF measurements on 3 T MRI and 1.5 T MRI. These patients had no metal implants and were scanned on both scanners within 1 week of each other, with no intervention in between. The RC muscles were segmented as described previously, and separate Bland-Altman plots were generated for the FF measurements of the SSP, ISP, and SSC muscles. Overall, the difference between the 3 T and 1.5 T MRI measurements showed good agreement (Supplementary Fig. S1, https://links.lww.com/RLI/A904).
StatisticsStatistics were performed in SPSS (v. 28.0 IBM Corp). Nonnormal distribution of the data was assessed with the Kolmogorov-Smirnov and Shapiro-Wilk test. Receiver operator characteristics (ROC) curves and Youden index were used to determine the FF cutoff values for predicting RC tendon retears. Mann-Whitney U and Wilcoxon signed rank tests were used to assess the differences among the 3 groups. A 1-way analysis of variance was used to compare the changes of FF and muscle volume over time among the groups. Post hoc analysis with Bonferroni correction was used to assess the differences between each group. Interreader assessment was evaluated using weighted Cohen κ.
RESULTSOf the 187 patients in the surgical treatment group, 41 (22%) patients were diagnosed with a failed RC tendon repair (Sugaya IV and V) of at least 1 tendon and enrolled into failed RC repair group (mean age, 58 ± 7 years; 16 women and a mean time interval between baseline and follow-up MRI of 17.1 ± 2.6 months). Complying with the matching criteria, 50 (27%) patients were enrolled into the intact RC repair group (Sugaya I and II; mean age, 57 ± 6 years; 20 women; mean follow-up, 16.9 ± 2.6 months) and 45 (24%) patients into the conservative treatment group (mean age, 58 ± 7 years; 18 women; mean follow-up time, interval, 17.2 ± 3.5 months). Similar time intervals among baseline imaging, surgical RC repair, and follow-up imaging were observed for groups 1 and 2 (group 1: baseline to surgery 5.2 ± 2.1 months, surgery to follow-up 11.9 ± 1.9 months; group 2: baseline to surgery 5.0 ± 2.9 months, surgery to follow-up 11.9 ± 2.5 months; P = 0.867 and P = 0.786, respectively). No tears of the teres minor tendon were detected, hence its exclusion from further analysis. At baseline, no significant differences were found among the 3 groups for the Goutallier, Patte, and Cofield classifications (Table 1). At follow-up, no significant increase in the Goutallier score was detected in all 3 groups (group 1: baseline 1.1 ± 0.5, follow-up 1.2 ± 1.1, P = 0.245; group 2: baseline 0.7 ± 0.6, follow-up 0.8 ± 0.5, P = 0.093; group 3: baseline 1.0 ± 0.6, follow-up 1.2 ± 0.7, P = 0.612).
TABLE 1 - Comparison of Patient Characteristics Between the Groups at Baseline Group 1, Failed RC Repair Group 2, Intact RC Repair Group 3, Conservative Treatment P † Age, y*,‡ 58 ± 7 57 ± 6 58 ± 7 0.732 Male 25 30 27 0.447 Female 16 20 18 0.571 Body mass index*,‡ 27 ± 4 28 ± 6 28 ± 4 0.925 MRI follow-up interval, mo*,‡ 17.1 ± 2.6 16.9 ± 2.6 17.2 ± 3.5 0.813 SSP tear 37 42 40 0.691 ISP tear 11 15 13 0.584 SSC tear 8 9 10 0.783 Teres minor tear 0 0 0 Goutallier classification*,‡ 1.1 ± 0.5 0.7 ± 0.6 1.0 ± 0.6 0.245 Patte classification*,‡ 2.5 ± 0.6 1.9 ± 0.7 1.7 ± 0.5 0.085 Cofield classification*,‡ 2.2 ± 1.1 1.8 ± 0.8 1.8 ± 0.6 0.191*Data are given as mean ± standard deviation.
†Comparison between the groups at baseline using a 1-way analysis of variance.
‡No significant difference detected in the Bonferroni and Scheffe adjusted post hoc analysis.
RC, rotator cuff; MRI, magnetic resonance imaging; SSP, supraspinatus; ISP, infraspinatus; SSC, subscapularis.
Baseline FF was significantly higher in the failed RC repair group and in all RC muscles when compared with the intact RC repair and conservative treatment groups (mean FF [%] SSP muscle group 1: 8.3 ± 3.7, group 2: 5.2 ± 2.1, group 3: 6.2 ± 1.5, P < 0.001; ISP muscle group 1: 9.6 ± 4.0, group 2: 4.7 ± 1.4, group 3: 5.2 ± 1.9, P < 0.001; SSC muscle group 1: 11.7 ± 2.1, group 2: 6.8 ± 3.2, group 3: 6.1 ± 1.5, P = 0.026). When comparing FF measured in the SSP muscle at baseline to FF at follow-up, the failed RC repair group and conservative treatment group showed a significant increase when compared with the intact RC repair group (mean FF [%] group 1: baseline 8.3 ± 3.7, follow-up 10.6 ± 3.5, P < 0.001; group 2: baseline 5.2 ± 2.1, follow-up 5.8 ± 2.3, P = 0.12; group 3: baseline 6.2 ± 1.5, follow-up 9.11 ± 5.6, P < 0.001; Fig. 4). Detailed comparisons of FFs between baseline and follow-up for each RC muscle of each group are listed in Table 2.
 FIGURE 4:
 Magnetic resonance arthrography of a 48-year-old patient with full-thickness RC tear of the SSP tendon (arrow) (A) and SSC tendon (arrowhead) (B) with only minor fatty infiltration of the SSP muscle (asterisks) and SSC muscle (star) detected on the T1-weighted sagittal oblique image (C); the FF values obtained with the 2-point Dixon sequence were 7.9% for the SSP muscle and 8.4% for the SSC muscle. Follow-up MR arthrography of the same patient 15 months after RC surgery reveals a retear (arrow) of the SSP tendon (D) and SSC tendon (arrowhead) (E) with severe fatty infiltration of the muscles (SSP: 15.3% FF and SSC: 13.5% FF) (F).
TABLE 2 - Comparison of Fat Fractions Between Baseline and Follow-up for Each RC Muscle of Each Group Groups and Muscles Baseline FF* Follow-Up FF* P † Group 1, failed RC repair SSP (n = 37) 8.3 ± 3.7 10.6 ± 3.5 <0.001 ISP (n = 11) 9.6 ± 4.0 12.9 ± 5.7 0.041 SSC (n = 8) 11.7 ± 2.1 13.3 ± 2.7 0.012 Group 2, intact RC repair SSP (n = 42) 5.2 ± 2.1 5.8 ± 2.3 0.124 ISP (n = 15) 4.7 ± 1.4 6.5 ± 3.4 0.021 SSC (n = 9) 6.8 ± 3.2 7.2 ± 4.1 0.341 Group 3, conservative treatment SSP (n = 40) 6.2 ± 1.5 9.11 ± 5.6 <0.001 ISP (n = 13) 5.2 ± 1.9 7.4 ± 4.4 <0.001 SSC (n = 10) 6.1 ± 1.5 7.5 ± 2.3 <0.001*Data are given in mean percentages ± standard deviation.
†Comparison between baseline and follow-up fat fractions for each group using the Wilcoxon signed rank test.
RC, rotator cuff; FF, fat fraction; SSP, supraspinatus; ISP, infraspinatus; SSC, subscapularis.
The ROC curves showed a good performance predicting retears of the RC tendons using preoperative FF values with a large area under the curve (AUC) of 0.83 for the SSP muscle, 0.82 for the ISP muscle, and 0.94 for the SSC muscle (Fig. 5). The Youden index was calculated using the sensitivity and specificity in order to define ideal cutoff values, which best predict the RC retears. The best performance was calculated for an FF of 6.0% (sensitivity 0.757, specificity 0.829) in the SSP muscle, 7.4% (sensitivity 0.730, specificity 0.970) in the ISP muscle, and 8.3% (sensitivity 0.875, specificity 0.872) in the SSC muscle.
 FIGURE 5:
 Receiver operating characteristic (ROC) curves for the use of 2-point Dixon-based fat fractions from the SSP muscle (A), ISP muscle (B), and SSC muscle (C) to distinguish patients with failed arthroscopic RC repair and intact/healed arthroscopic RC repair. The area under the curve (AUC) was 0.83 for the SSP muscle, 0.82 for the ISP muscle, and 0.94 for the SSC muscle.
For comparison, the performance of the Goutallier scores in predicting RC tendon retears was analyzed using separate ROC curves and showed an AUC of 0.61 for the SSP muscle, 0.63 for the ISP muscle, and 0.70 for the SSC muscle.
Rotator Cuff Muscle VolumeThe SSP muscle volume in the failed RC repair and the conservative treatment groups decreased significantly (mean volumes [cm3] group 1: baseline 31.6 ± 10.8, follow-up 28.3 ± 13.8, P < 0.001; and group 3: baseline 25.2 ± 7.3, follow-up 21.7 ± 5.9, P = 0.003), but not in the intact RC repair group 2 (mean volumes [cm3] baseline 31.2 ± 12.9, follow-up 29.6 ± 13.1, P = 0.063; Table 3, Fig. 6). The same results were observed for the SSC muscle (mean volumes [cm3], failed RC repair: baseline 103.1 ± 22.8, follow-up 95.9 ± 20.8, P = 0.006; intact RC repair: baseline 107.0 ± 37.0, follow-up 101.7 ± 34.0, P = 0.091; and conservative treatment: baseline 102.8 ± 28.0, follow-up 95.1 ± 27.5, P < 0.001). In the failed RC repair and conservative treatment group, a nonsignificant muscle volume decrease was also observed for the ISP muscle (mean volumes [cm3] group 1: baseline 59.3 ± 21.53, follow-up 51.4 ± 24.6, P = 0.155; and group 3: baseline 71.8 ± 29.3, follow-up 68.2 ± 26.9, P = 0.109). For the intact RC repair group, a slight increase in muscle volume of the ISP was detected again without reaching statistical significance (mean volumes [cm3] group 2: baseline 92.5 ± 25.2, follow-up 92.1 ± 28.9, P = 0.886). Receiver operator characteristics curves were calculated to assess the performance of preoperative muscle volume for predicting retears of the RC tendons. The calculated AUCs (SSP, 0.51; ISP, 0.62; SSC, 0.54) were not able to predict retears after RC repair reliably. When comparing the different groups, a significant lower muscle volume was detected for the SSP muscle of the conservative treatment group at follow-up compared with the surgical treatment groups (mean volumes [cm3] group 1: 28.3 ± 13.8, group 2: 29.6 ± 13.1, group 3: 21.7 ± 5.9, P = 0.035). For the ISP and SSC muscle, significant lower volumes at follow-up were detected in the failed RC repair group and the conservative treatment group compared with the intact RC repair group (mean volumes [cm3] ISP: group 1 51.4 ± 24.6, group 2 92.1 ± 28.9, group 3 68.2 ± 26.9, P = 0.023; and SSC group 1 95.9 ± 20.8, group 2 101.7 ± 34.0, group 3 95.1 ± 27.5, P = 0.018).
TABLE 3 - Comparison of RC Muscle Volume Between Baseline and Follow-up for Each RC Muscle and Each Group Groups and Muscles Baseline Muscle Volume* Follow-up Muscle Volume* P † Group 1, failed RC repair SSP (n = 37) 31.6 ± 10.8 28.3 ± 13.8 <0.001 ISP (n = 11) 59.3 ± 21.53 51.4 ± 24.6 0.155 SSC (n = 8) 103.1 ± 22.8 95.9 ± 20.8 0.006 Group 2, intact RC repair SSP (n = 42) 31.2 ± 12.9 29.6 ± 13.1 0.063 ISP (n = 15) 92.5 ± 25.2 92.1 ± 28.9 0.886 SSC (n = 9) 107.0 ± 37.0 101.7 ± 34.0 0.091 Group 3, conservative treatment SSP (n = 40) 25.2 ± 7.3 21.7 ± 5.9 0.003 ISP (n = 13) 71.8 ± 29.3 68.2 ± 26.9 0.109 SSC (n = 10) 102.8 ± 28.0 95.1 ± 27.5 <0.001*Data are given as mean (cm3) ± standard deviation.
†Comparison between baseline and follow-up fat fractions for each group using the Wilcoxon signed rank test.
RC, rotator cuff; SSP, supraspinatus; ISP, infraspinatus; SSC, subscapularis.
 FIGURE 6:
 A, Magnetic resonance arthrography of a 53-year-old patient with full-thickness tear (arrow) of the SSP tendon and tendon retraction. On the sagittal oblique T1-weighted image (B), no fatty infiltration or atrophy was detected qualitatively, and the FF value obtained with the 2-point Dixon sequence was 3.6%. Noncontrast shoulder MRI (C) of the same patient 13 months after arthroscopic RC repair with intact SSP tendon (white arrow) and no fatty infiltration or atrophy (asterisk) of the SSP muscle (FF 3.9%) (D).
Interreader ReliabilityOverall interreader agreement in assessing RC tears and retears was substantial to almost perfect (κ = 0.96; 95% confidence interval [CI], 0.92–1.00). In 5 cases, the initial RC tear was graded differently, and in 3 cases, the outcome of the RC repair using the Sugaya classification was graded differently. The interreader agreement for the Goutallier classification was excellent (baseline: κ = 0.76; 95% CI, 0.65–0.86, follow-up: κ = 0.80; 95% CI, 0.68–0.90) but lower compared with the interreader agreement of the Patte and Cofield classifications (Table 4).
TABLE 4 - Interreader Agreement for the Qualitative Assessment of the RC Features Parameters Baseline Follow-up Reader 1 Reader 2 κ† Reader 1 Reader 2 κ† RC tear classification* 3.85 ± 0.68 3.81 ± 0.67 0.96 [0.91–1.00] NA NA NA Sugaya classification* NA NA NA 3.47 ± 1.33 3.45 ± 1.35 0.97 [0.92–1.00] Goutallier classification* 0.81 ± 0.66 1.05 ± 0.79 0.76 [0.65–0.86] 1.14 ± 0.92 1.29 ± 0.91 0.80 [0.68–0.90] Patte classification* 2.03 ± 0.74 2.04 ± 0.72 0.91 [0.86–0.96] 2.01 ± 0.70 2.07 ± 0.68 0.93 [0.78–0.97] Cofield classification* 1.92 ± 0.82 1.94 ± 0.87 0.87 [0.79–0.95] 1.95 ± 0.80 1.97 ± 0.78 0.89 [0.71–0.89]*Data are given as mean ± standard deviation.
†Weighted Cohen κ.
RC, rotator cuff; NA, not applicable.
Several studies have reported that patients with RC tendon tears and increased preoperative fatty muscle infiltration have a higher risk of tendon retear after surgical repair. However, there was no consensus about an appropriate cutoff value for RC retear prediction, because the previously published data were based on cohorts with retears of only 9 to 19 patients.7–9 In our study with 136 patients, we revisited the question of which cutoff value for fatty muscle infiltration should be chosen, with the largest patient cohort of retears so far, encompassing 41 patients with RC retear, and matched groups of intact RC repairs and patients with conservative treatment. Higher preoperative FFs were detected for the RC muscles with ultimately failed RC repair, when compared with those with intact RC repairs. A significant increase in FF for all RC muscles approximately 1.5 years after diagnosis of tear was detected in the failed RC repair group and the conservative treatment group, but not in the intact RC repair group. This is in line with previous studies, showing that fatty infiltration and atrophy of the SSP muscle can be halted after successful surgical RC repair.7,26
It was demonstrated that the fatty infiltration is a prognostic factor for the outcome of RC tears and that patients with severe infiltration greater than Goutallier grade 2 have a less satisfactory outcome after RC tear.27–29 However, there has been a considerable debate regarding the clinical application of the Goutallier grading system due to the high interreader and intrareader variability: Slabaugh et al30 analyzed the interobserver and intraobserver reliability of 30 raters in patients with chronic RC tears and reported only a moderate agreement (interobserver, κ = 0.43; intraobserver, κ = 0.56). Similar results were recently reported by Werthel et al31 who detected a fair to moderate (κ 0.27–0.42) interobserver agreement for the Goutallier grading of 102 patients. In our study, excellent interrater reliability was observed for the Goutallier grading (κ = 0.76–0.80). However, in contrast to the aforementioned studies, in which the interpretation was performed by orthopedic surgeons with different levels of experience, the analysis in this study was performed by 2 musculoskeletal radiologists with comparable levels of experience.
Because of the good reproducibility, the application of quantitative imaging methods for assessing RC muscle FF and volume has been of increasing interest.16 Dixon-based MRI techniques were shown to be a reliable method for the assessment of intramuscular fat quantification with low variability and good linearity.32–34 Nevertheless, previously reported values for RC muscle FF based on either 2-point or 6-point Dixon imaging methods are contradictory, often limited by small patient cohorts and mainly focused on the SSP muscle.7–9 In a cohort of 50 patients, Nozaki et al8 reported FF cutoff values acquired with 2-point Dixon imaging of 26.6% for the SSP muscle with a sample size of 11 failed RC repairs and 31% FF for the ISP muscle with a sample size of 7 failed repairs. In contrast, Wieser et al7 evaluated a cohort of 40 patients using 6-point Dixon imaging with 19 failed repairs and reported a cutoff of 7.8% for preoperative FF in patients with failed SSP repairs. Similarly, in a study with 9 failed SSP tendon repairs, Lansdown et al9 observed a preoperative FF of 11.7% measured on a fast gradient echo pulse sequence with 6 echoes. Also, the results of our analysis revealed a cutoff value that was much lower than the FF reported by Nozaki et al8 and was much closer to the studies by Wieser et al7 and Lansdown et al,9 with an FF cutoff for the SSP of 6.0%. Moreover, we were able to establish cutoff values for the ISP and SSC of 7.4% and 8.3%, respectively.
In recent years, the continuous development of machine learning–based methods has opened up new possibilities for disease detection in musculoskeletal radiology. The application of new machine learning–based analytical models, multifactorial correlations, and classifiers allows the processing of large data sets and testing thousands of features to identify the relevant markers.35 Lin et al36 reported a convolutional neural network for RC tear assessment that achieved excellent performance in detecting full thickness RC tears (AUC, 0.95–0.99). The network was trained on a data set of nearly 12,000 noncontrast shoulder MRIs, using the radiological reports as ground truth. However, the performance of the algorithm in predicting retears of the RC tendons was not evaluated.36
Similar to Wieser et al,7 a quantitative 3D analysis of the segmented SSP, ISP, and SSC muscles was performed in this study to obtain more reliable FF and muscle volumes. In the current study, the muscle volume of the intact RC repair group did not change significantly between baseline and follow-up, indicating that successful RC repair halted further progression of fatty infiltration and atrophy. Wieser et al7 reported no significant progression of muscle atrophy 3 months after successful repair of the SSP muscle and even a slight increase in muscle volume 12 months after successful repair. Similar results were reported by Hata et al,37 finding no significant atrophy progression of the SSP and ISP muscles up to 24 months after successful RC repair.
A point that might affect a reliable volume measurement is the retraction of the myotendinous unit after RC repair, leading to a “compression” of the muscle belly.38 Jo et al38 assessed the muscle atrophy after RC tear before surgery, directly after surgery (within 3 days) and after 1 year. When comparing muscle atrophy directly after surgery and 1 year after repair, a significant progression was reported in intact repairs. This observation contradicts previous studies and might imply the influence of false preoperative volume measurements due to tendon retraction.
留言 (0)