Serum samples and cell culture
Peripheral blood samples were collected from each RA sufferer (n = 50) and each healthy volunteer (n = 25) at the General Hospital of Central Theater Command in this research, which was approved by the Ethics Committee of General Hospital of Central Theater Command. After centrifugation, the serum specimens were acquired. Meanwhile, all participants signed written informed consent prior to enrolling in this study. The detailed clinical characteristics of patients and healthy volunteers are described in Table 1.
Table 1 The clinical characteristics of the patients with RA and NormalIn addition, RA-FLSs were isolated as described previously [33, 34]. Briefly, synovial tissues from RA sufferers (same as blood donors) were obtained during knee joint arthroscopy and immediately placed in RPMI1640 medium (Sigma-Aldrich, St. Louis, MO, USA). After being minced into about 5 mm pieces, these tissues with the medium were evenly spread on the bottom of cell culture flasks for 6 h at 37˚C, followed by the addition of 10% FBS and 1% penicillin/streptomycin. Subsequently, the non-adherent tissue pieces were taken out via changing the culture medium every 3 ~ 5 days. Then, the primary synovial cells were allowed to reach 70 ~ 80% for passaging. Finally, FLSs from passages 4 to 8 were applied in the following assays. For hypoxic experiments, RA-FLSs were exposed to 2% O2 in a hypoxia incubator chamber (ASTEC, Fukuoka, Japan) for 24 h as a hypoxia group. Meanwhile, these RA-FLSs were induced with 0, 10, 20, and 40 µM of TMP (Sigma-Aldrich) for 24 h. Besides, 40 µM TMP treatment for 24 h was used for further functional experiments. Besides, cells were incubated under normoxic conditions in a 5% CO2 incubator for 24 h as a normoxic group.
Counting kit (CCK-8) assay
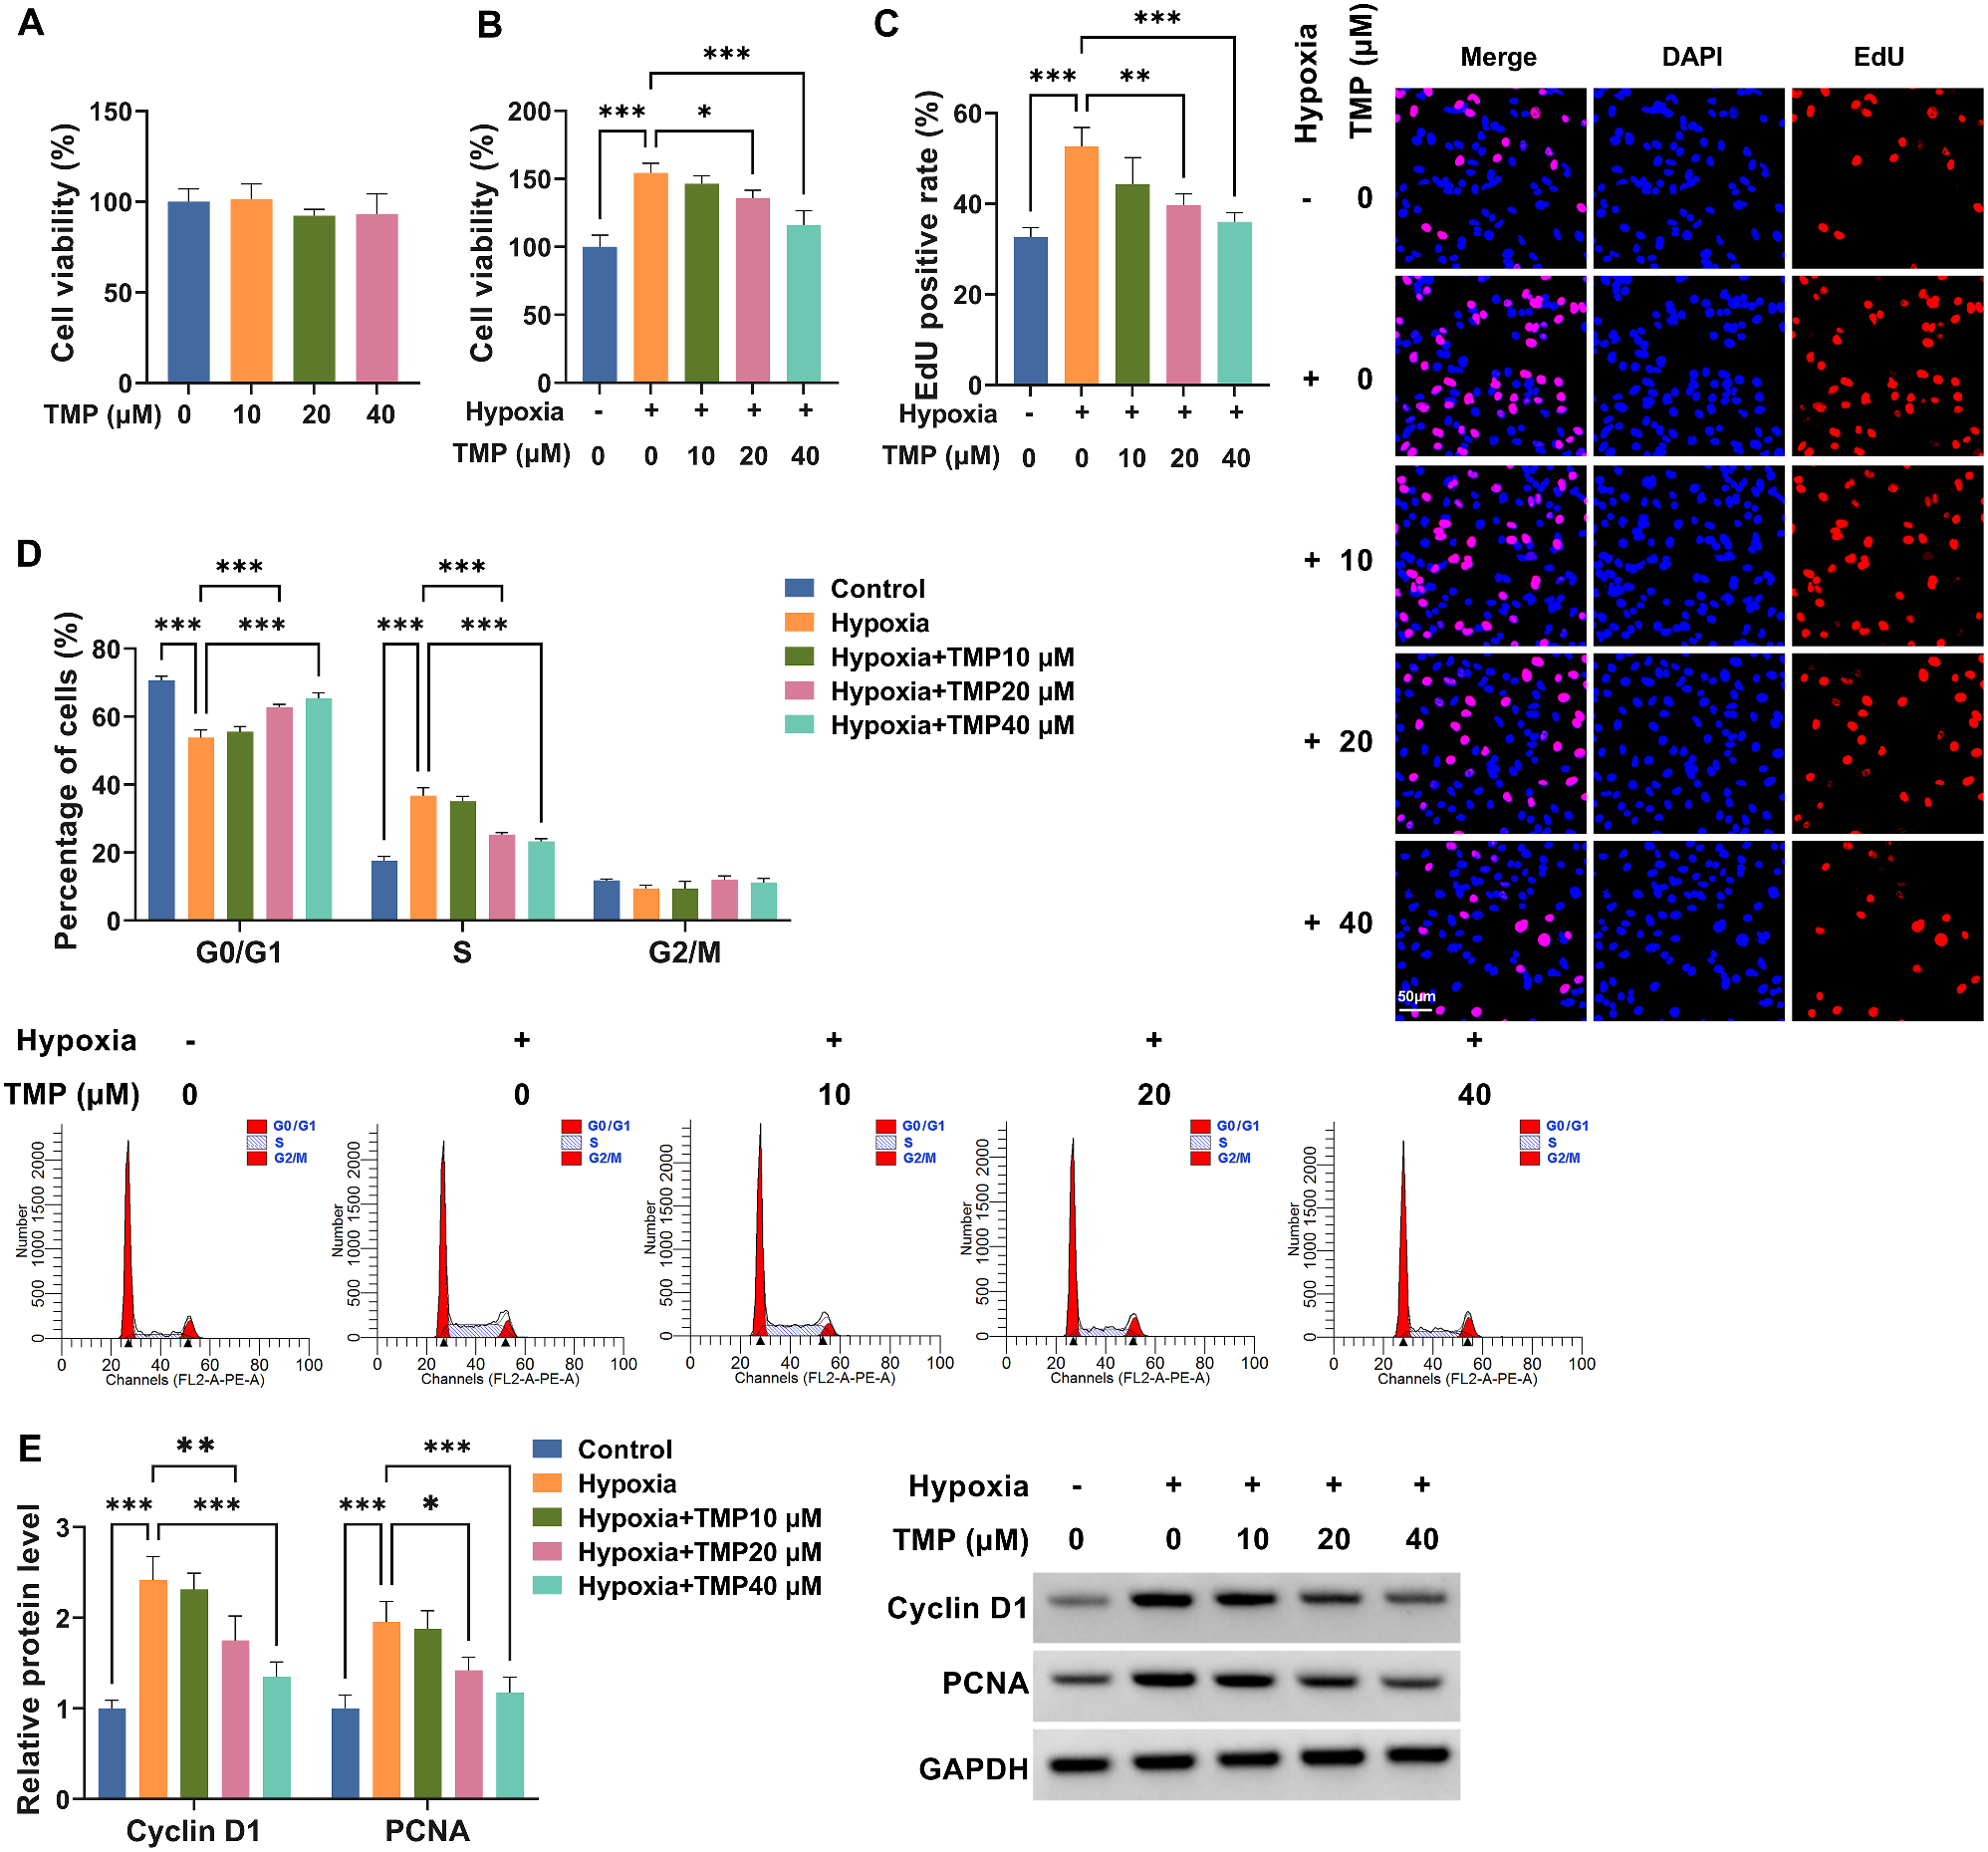
Assessment of RA-FLS viability was performed in this experiment. In short, treated or untreated 5 × 10³ cells under hypoxic conditions were cultured overnight. At indicated time points, CCK-8 (10 µL, Dojindo, Kumamoto, Japan) was allowed to be added into each well. A further 4 h later, a microplate reader at 450 nm was applied to record the absorbance.
5-ethynyl-2’-deoxyuridine (EdU)
Generally, 1 × 10⁴ RA-FLSs were grown for 48 h in six-well plates, followed by incubation with 50 µM EdU working solution (RiboBio, Guangzhou, China). 2 h later, 4% formaldehyde was utilized to fasten the cells, which then were reacted with Apollo reaction cocktail and DAPI for 30 min. Finally, samples were visualized based on a fluorescence microscope.
Flow cytometry for cell cycle progression
After harvesting and washing in ice-cold PBS, 70% ethanol at 4˚C was used to fix 1 × 10⁵ RA-FLSs, which then were centrifuged and mixed with RNase (50 µg/mL) for 30 min. Then, nucleic acids were stained with Propidium Iodide (PI, Bender Med System, Vienna, Austria). At last, samples were processed using a FACSCalibur Flow Cytometer (BD Biosciences, Franklin Lakes, NJ, USA) and Cell Quest Pro. Results were analyzed using ModFit 3.1 software (BD Biosciences).
Western blot assay
In brief, whole cell lysates from treated RA-FLSs were generated using RIPA lysis buffer (Keygen, Nanjing, China) containing protease inhibitors. After separation on the gel, the proteins were loaded onto nitrocellulose membranes (Sigma-Aldrich), which then were incubated overnight at 4˚C, with primary antibodies: Cyclin D1 (1:200, ab16663, Abcam, Cambridge, MA, USA), Proliferating cell nuclear antigen (PCNA, 1:1000, ab29, Abcam), MMP2 (1:1000, ab86607, Abcam), MMP9 (1:1000, ab76003, Abcam), HIF-1α (1:2500, 20960-1-AP, Proteintech Group, Rosemont, IL, USA), and GAPDH (1:50000, 60004-1-lg, Proteintech Group). At last, the ECL reagent (Millipore, Molsheim, France) was utilized to visualize the bands after incubation with a secondary antibody for 2 h.
Cell migration assay
Measurement of RA-FLS migration ability was carried out using wound healing and transwell assays. Briefly, 1 × 10⁵ treated RA-FLSs in 6-well plates were cultured overnight to generate the monolayer confluence. Then, a sterile pipette tip was applied to make standardized wound scratches (time 0 h), followed by replacement with serum-free medium. After that, cells were allowed to migrate for 24 h, and the gap size was captured and analyzed using Image J software. In terms of transwell assay, transwell chambers (BD Biosciences) were introduced with 5 × 10⁴ RA-FLSs with serum-free medium, while the lower compartment possessed a complete medium. After a 24 h incubation, the cells attached to the lower surface were fixed and stained, followed by microscope observation.
Enzyme-linked immunosorbent assay (ELISA)
After multiple treatments, RA-FLS supernatants were collected from cell culture experiments, followed by measurement of IL-6 and IL-8 levels using specific ELISA kits (BMS213-2, KHC0081, Invitrogen, Paisley Scotland, UK).
Real-time quantitative polymerase chain reaction (RT-qPCR)
For RA-FLS RNA extraction, Trizol reagent (Invitrogen) was utilized. After synthesizing temple DNA using High-Capacity cDNA Reverse Transcription Kit (Applied Biosystems, Foster City, CA, USA), amplification reaction was conducted on Thermal Cycler CFX6 System (Bio-Rad, Hercules, CA, USA) with SYBR Green PCR Kit (Takara, Tokyo, Japan). Relative expression was calculated by the 2–ΔΔCt method, normalizing to GAPDH. Primer sequences were presented in Table 2.
Table 2 Primers sequences used for PCRFor subcellular fractionation assay, RNA isolation of nuclear and cytoplasmic fractions from RA-FLSs was performed using PARIS Kit (Ambion, Austin, TX, USA). Then, circCDC42BPB, U6 (nucleus control), and GAPDH (cytoplasm control) expression levels were determined using RT-qPCR.
To validate the circular feature of circCDC42BPB, RNase R (Seebio, Shanghai, China) was applied for the digestion of total RNAs from RA-FLSs. At 20 min after incubation at 37˚C, the abundance of circCDC42BPB and liner CDC42 binding protein kinase beta (CDC42BPB) were measured using RT-qPCR.
Cell transfection
For circCDC42BPB overexpressing (OE-circCDC42BPB), the full-length circCDC42BPB (without intervening introns) sequence was synthesized and cloned into a lentiviral GV248 vector (Genechem, Shanghai, China). Lentiviral GV248 empty vector performed as negative control (vector). Subsequently, the construct and lentivirus packaging plasmids (psPAX2 and pMD2.G) were co-transfected into 293T cells. After being filtered and enriched, these Lentiviral particles were transduced into RA-FLSs at 60% confluency in the presence of 8 µg/mL polybrene. At last, 5 µg/mL puromycin was used to select stably expressing cell lines.
Meanwhile, HIF-1α small interfering RNA si-HIF-1α: 5’-AACUUAUCUUUUUCUUGUCGU-3’ (sense), 5’-GACAAGAAAAAGAUAAGUUCU-3’(antisense) or its control (si-NC) from RiboBio (Guangzhou, China) and the plasmids: pcDNA and pcDNA- HIF-1α (HIF-1α, NM_001530.4) were introduced into RA-FLSs using Lipofectamine 3000 (Invitrogen) for 48 h.
Dual-luciferase reporter assay
This experiment was performed as previously described [31]. For assessing circCDC42BPB promoter activity, the promoter (-2000 to -1 bp) sequences of CDC42BPB possessing the wild-type (WT) or mutant-type (MUT) HIF1α binding sites (RiboBio) were introduced into dual-luciferase reporter vector GV-238 (Genechem). Subsequently, these vectors were co-transfected into RA-FLSs along with si-HIF1α or si-NC for 48 h, followed by the analysis of luciferase activity using Dual Luciferase Assay Kit (Promega, Madison, WI, USA). Luciferase reporter assay was performed at least three times.
Chromatin immunoprecipitation (ChIP)
ChIP kit (Wanleibio, Liaoning, China) was employed for this experiment. After being cross-linked with 1% formaldehyde, RA-FLSs were added with glycine to terminate this reaction. After that, the DNA fragments were mixed with anti-HIF1α (Novus Biologicals, CO, USA), anti-IgG, and anti-Polymerase II (Pol II, Wanleibio). 16 h later, these products were subjected to RT-qPCR analysis.
Statistical analysis
In this research, data comparison was processed using Student’s t-test or one-way analysis of variance (ANOVA) with Tukey’s tests. GraphPad Prism7 software was used to analyze the statistical difference results, which were displayed as mean ± standard deviation (SD). P-value < 0.05 was applied as the threshold of significance.


留言 (0)