
記住我

Preeclampsia (PE) is one of the most severe complications of pregnancy [1,2], affecting approximately 3–5% of pregnancies globally, and is defined as new-onset hypertension with proteinuria or end-organ dysfunction after 20 weeks of gestation [3,4]. Unfortunately, there is no cure for preeclampsia except for placental delivery, and the disease can lead to severe adverse maternal or fetal outcomes if left untreated [5,6]. Therefore, the early prediction of preeclampsia is critical [7].
Currently, clinical risk assessment for preeclampsia relies mainly on maternal history and definitive guidelines or recommendations. The American College of Obstetricians and Gynecologists (ACOG) Practice Bulletin, Number 222 [8], recommends low-dose aspirin for pregnancies with any high-risk factors for preeclampsia or more than one moderate-risk factor for the primary prevention of preeclampsia [9,10]. However, this approach has limited detection rates of 5 and 2% for preterm and term preeclampsia [11], respectively. Although research has shown that there is no increase in maternal and neonatal adverse outcomes with prophylactic use of aspirin [12–15], such as bleeding, placental abruption, premature closure of the arterial canal, and neonatal bleeding, the broadening of the indications for aspirin has led to potential exposure to these side effects. To improve detection rates, recent screening methods have combined clinical risk factors with convincing predictors, such as ultrasound and maternal biochemical markers [16–19], which have been proven to have positive effects [16,17]. However, these predictors are expensive and highly dependent on technical expertise, making them less accessible in underdeveloped countries. Therefore, there is a need for additional noninvasive, inexpensive, and objectively monitored predictive indicators for routine prenatal visits [18,19].
Preeclampsia is associated with an elevated risk of damage to various organs, including the kidneys, liver, brain, eyes, and blood system [20–24]. As the retina is an extension of the brain and provides a convenient means of visualizing vascular changes in vivo[25], fundus images may reveal microvascular changes in the retina [26] that reflect changes in the cardiovascular system. Previous research has demonstrated that microvascular changes in the retinal vasculature are independent predictors of hypertension [27]. Therefore, we sought to predict preeclampsia by monitoring changes in the retinal vasculature using fundus images. Nonmydriatic fundus photography, which is widely used in hospitals and primary care settings, can easily capture retinal fundus images [28].
Given the advantages of deep learning in developing disease prediction models [29], we utilized this technique to automatically analyze fundus images because of its speed and accuracy in image processing. The details of the medical images can be automatically assessed quantitatively [30]. Deep learning techniques, such as Convolutional Neural Networks (CNNs), which are optimized for images [31], allow for a clear representation of raw data input, producing highly accurate algorithms for recognizing disease characteristics [32]. Previous studies have shown that a CNN-based retinal artificial intelligence diagnosis system has diagnostic accuracy equal to or better than that of ophthalmologists [33].
In our prospective cohort study of singleton pregnancies, we aimed to evaluate and synthesize the predictive value of retinal fundus images in preeclampsia using deep learning techniques.
MATERIALS AND METHODS Study design and participantsThis prospective cohort study was conducted at the Shanghai First Maternity and Infant Hospital (SFMIH), affiliated with Tongji University School of Medicine. Singleton pregnancies attending prenatal visits before 14 weeks of gestation at SFMIH were recruited between September 1, 2020, and February 1, 2022. Participants were offered several antenatal visits during which their weight and blood pressure were recorded. They underwent retinal fundus examinations during their initial prenatal visit upon admission before 20 weeks of gestation.
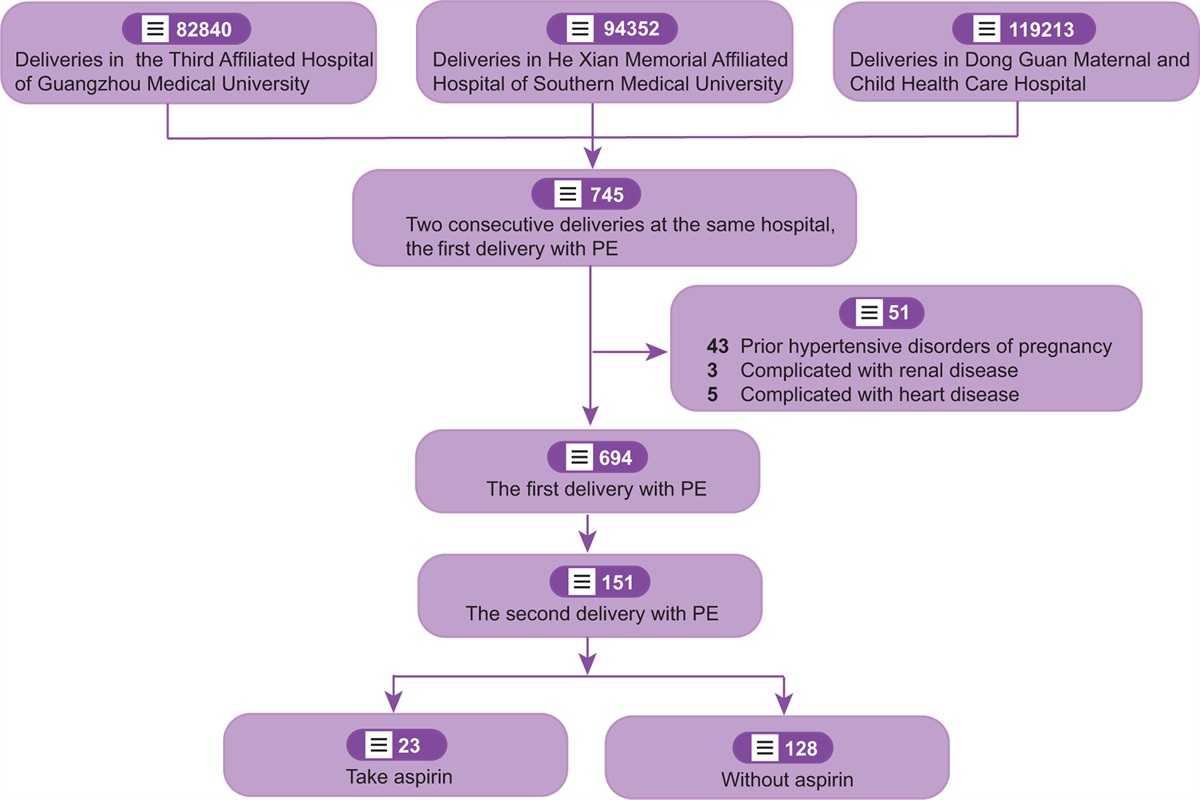
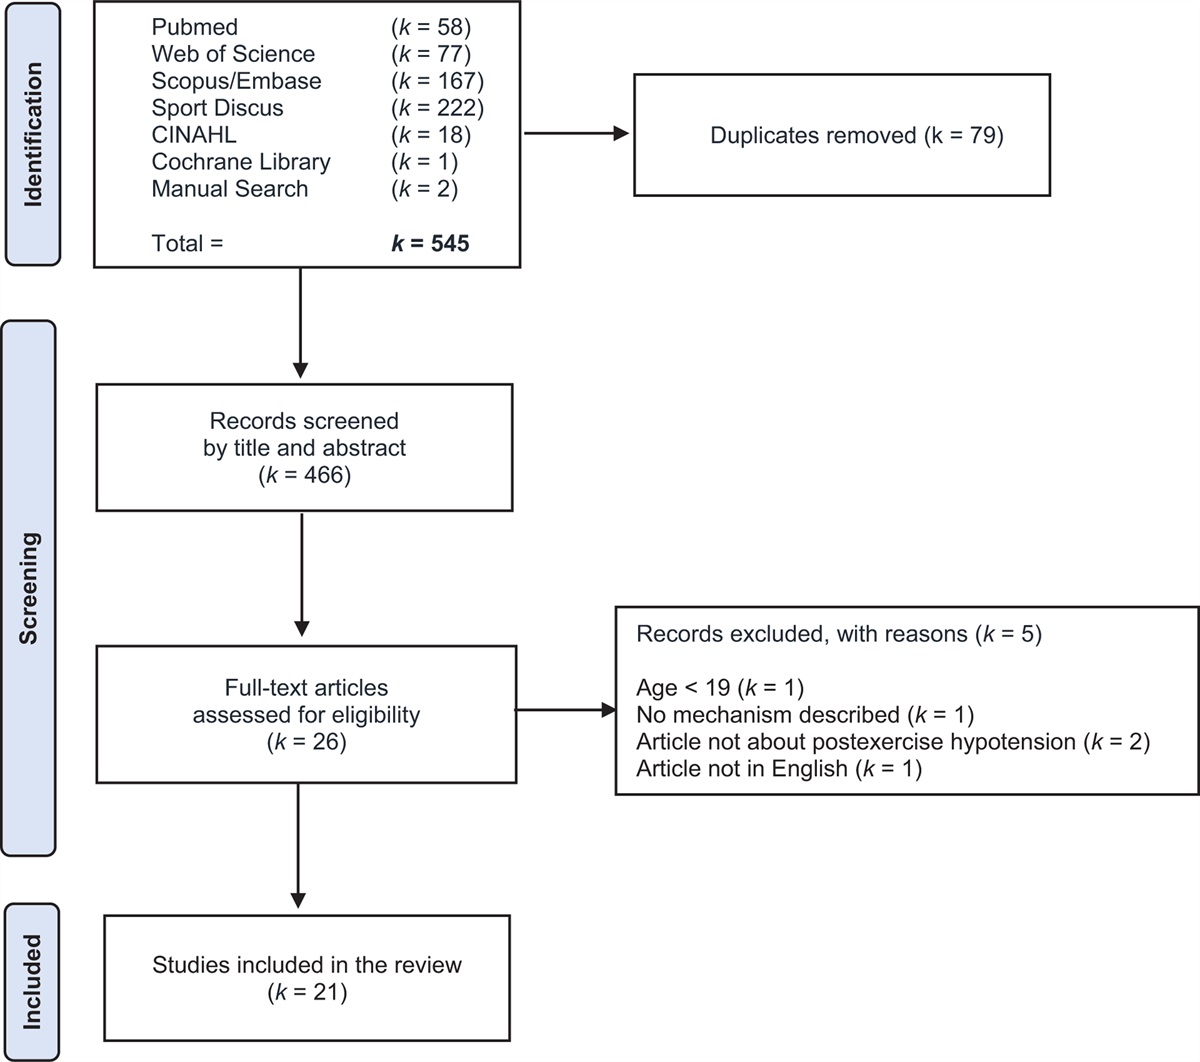
A flowchart of patient selection is shown in Fig. 1. The inclusion criteria were as follows: singleton pregnancies, attending prenatal visits before 14 weeks of gestation in SFMIH, taking fundus images before 20 weeks of gestation, and delivered in SFMIH between 28 and 42 weeks of gestation. The exclusion criteria were as follows: pregnancies not delivered in SFMIH; intrauterine fetal demise; multiple pregnancies; inability to perform fundus photography examination; and any ophthalmic diseases such as refractive media opacity or retinal diseases, which would hinder the acquisition of the fundus image or influence the image quality or the process of analysis.
 FIGURE 1:
 Flow chart for patient selection.
Data collectionHospital electronic medical records were obtained based on the inclusion criteria. The collected information included sociodemographic characteristics, obstetric characteristics, and neonatal outcomes.
Primary outcomePreeclampsia was diagnosed using the standardized criteria suggested by the ACOG [8]. The outcome was collected by certified medical record abstractors to determine the preeclampsia diagnosis.
MeasurementsGestational weeks were estimated using first trimester ultrasonographic measurements. Prepregnancy BMI (kg/m2) was calculated based on self-reported prepregnancy weight (kg) and height (m) at the first prenatal visit from the medical chart and categorized as normal weight (BMI<24.0), overweight (24.0 ≤ BMI<28.0), or obesity (BMI ≥ 28.0), according to the standards for Chinese participants proposed by the Chinese Working Group on Obesity [34]. Fundus images were obtained before 20 weeks of gestation using a nonmydriatic digital retinal camera (CA-CR-2/2 PLUS AF). Each image was independently evaluated by two experienced ophthalmologists, and images that combined other ophthalmic pathological situations were excluded.
Fundus scores generated via the deep learning algorithmIn our study, the predictive values of hypertension were generated by the hypertension detection model based on a deep learning algorithm [25], which is an artificial intelligence recognition tool for assessing hypertension. The algorithm was developed by Airdoc Ltd. in 2020 [35], in which a hypertension prediction branch was added to the Inception-ResNet-v2 backbone. The model accepts input from the fundus images of each participant, and the trained neural networks were used to export predictive values of hypertension to predict the probability of hypertension and were defined as ‘fundus scores’. Fundus scores indicated hypertension severity, with values of 0 to 1.0, representing increasing signs of typical hypertension. Because of the skewed distribution, we loge transformed fundus scores and modeled them as a continuous variable; the higher the values of the model outputs, the greater the influence of hypertension on fundus tissue, especially microvascular.
Before implementing the algorithm, an image quality control model was applied to filter out unqualified images. The quality assessment was evaluated using a deep learning model based on the architecture of the variational autoencoder and generative adversarial networks, which was developed by Airdoc Ltd. in 2021 [36].
Evaluating the predictive value of fundus score in preeclampsiaTo evaluate the predictive value of the fundus score in preeclampsia, we used stratified analyses and multivariate logistic regression to assess the diagnostic value of the fundus score in predicting hypertension disorders of pregnancy (HDP), gestational hypertension, and preeclampsia. The area under the curve (AUC), sensitivity, and specificity were determined to assess the predictive values. Sensitivity analyses were used to further validate universality.
Statistical analysisContinuous variables are expressed as medians (interquartile range [IQR]), and n (%) for categorical variables. One-way ANOVA, Pearson's chi-square test, and Fisher's exact test were used to compare the outcome groups for continuous and categorical variables.
All data were double-entered using the EpiData software (EpiData 3.1 Windows, EpiData Association Odense, Denmark). All analyses were performed using R Studio (version 2022.07.1 Build 554) with R (version 4.2.1).
Ethics statement and consentThis study was approved by the Ethics Committee of Shanghai First Maternity and Infant Hospital (reference number: KS20268). All procedures were performed in accordance with the tenets of the Declaration of Helsinki. All retinal fundus images were anonymized and de-identified prior to the analysis. Informed consent was obtained from all participants.
RESULTS Characteristics of the study populationA total of 1209 singleton pregnancies attending prenatal visits before 14 weeks of gestation were recruited, and retinal fundus images were obtained before 20 weeks of gestation. After excluding 12 cases of intrauterine fetal demise, and 59 multiple pregnancies, 1138 women were included in the final analysis, with 92 pregnancies developing into HDP, including 26 cases of gestational hypertension and 66 cases of preeclampsia (Fig. 1). Representative examples of fundus images of unaffected pregnancies and gestational hypertension and preeclampsia pregnancies are shown in Fig. 2.
 FIGURE 2:
 Examples of the original fundus images. Original fundus images of (a) unaffected pregnancy; (b) GH; and (c) PE patients.
Table 1 summarizes the demographic, obstetric, and neonatal characteristics. Chronic hypertension, gestational weeks, preterm birth, fetal birth weight, and Apgar scores differed significantly among the groups of unaffected pregnancies, gestational hypertension, and PE pregnancies. However, there were no significant differences in primiparity, rate of assisted reproductive technology (ART), occurrence of hypothyroidism, gestational diabetes mellitus (GDM), polycystic ovary syndrome (PCOS), or postpartum hemorrhage (PPH) among the three groups. Maternal age at delivery, BMI at the first prenatal visit, previous pregnancy with preeclampsia, autoimmune disease, diabetes mellitus, delivery method, and small for gestational age (SGA) were significantly different between unaffected pregnancies and gestational hypertension pregnancies.
TABLE 1 - Baseline characteristics HDP (n = 92) Characteristics Unaffected (n = 1046) GH (n = 26) PE (n = 66) P valuea P valueb Demographic characteristics Primiparity, n (%) 769 (73.5%) 22 (84.6%) 44 (66.7%) 0.123 0.711 Maternal age at delivery (year), Median (IQR) 31.00 (29.00, 33.00) 30.50 (27.25, 32.00) 33.00 (30.00, 36.00) 0.002 <0.001 Maternal age at delivery (year), n (%) 0.015 <0.001 <35.0 876 (83.7%) 23 (88.5%) 38 (57.6%) 35.0–40.0 153 (14.6%) 3 (11.5%) 20 (30.3%) ≥40 17 (1.6%) 0 (0%) 8 (12.1%) BMI at first prenatal visit (kg/m2) 21.45 (19.84, 23.43) 22.32 (19.65, 24.36) 26.06 (22.78, 29.04) <0.001 <0.001 BMI at first prenatal visit, n (%) 0.003 <0.001 ≤24.0 840 (80.3%) 19 (73.1%) 22 (33.3%) 24.0–28.0 170 (16.3%) 4 (15.4%) 24 (36.4%) ≥28.0 36 (3.4%) 3 (11.5%) 20 (30.3%) Obstetric characteristics Previous pregnancy with PE, n (%) 6 (0.6%) 0 (0%) 3 (4.5%) 0.556 0.030 ART, n (%) 51 (4.9%) 1 (3.8%) 8 (12.1%) 0.437 0.052 Chronic hypertension, n (%) 5 (0.5%) 0 (0%) 17 (25.8%) 0.002 <0.001 Autoimmune disease, n (%) 23 (2.2%) 2 (7.7%) 4 (6.1%) >0.999 0.025 DM, n (%) 7 (0.7%) 0 (0%) 3 (4.5%) 0.556 0.040 Hypothyroidism, n (%) 81 (7.7%) 4 (15.4%) 6 (9.1%) 0.460 0.289 GDM, n (%) 112 (10.7%) 3 (11.5%) 15 (22.7%) 0.261 0.010 PCOS, n (%) 5 (0.5%) 0 (0%) 1 (1.5%) >0.999 0.398 Delivery method, n (%) 0.003 <0.001 Spontaneous delivery 606 (57.9%) 12 (46.2%) 10 (15.2%) Caesarean section 440 (42.1%) 14 (53.8%) 56 (84.8%) Gestational weeks (week), Median (IQR) 39.29 (38.43, 40.14) 38.86 (38.14, 39.39) 37.43 (36.04, 38.79) 0.002 <0.001 Preterm birth, n (%) 0.030 <0.001 Normal 1008 (96.4%) 24 (92.3%) 43 (65.2%) PTB (28–37 GW) 36 (3.4%) 2 (7.7%) 21 (31.8%) extremely PTB (<28 GW) 2 (0.2%) 0 (0%) 2 (3.0%) PPH, n (%) 20 (1.9%) 0 (0%) 2 (3.0%) >0.999 0.696 Neonatal characteristics Fetal birth weight (g), Median (IQR) 3330.00 (3070.00, 3590.00) 3135.00 (2922.50, 3512.50) 2955.00 (2341.25, 3388.75) 0.103 <0.001 Low birth weight, n (%) 25 (2.4%) 2 (7.7%) 22 (33.3%) 0.016 <0.001 Fetal growth, n (%) 0.750 0.111 AGA 900 (86.0%) 23 (88.5%) 55 (83.3%) SGA 33 (3.2%) 0 (0%) 0 (0%) LGA 113 (10.8%) 3 (11.5%) 11 (16.7%) 1-minutes Apgar score, Median (IQR) 9.00 (4.00, 10.0) 9.00 (8.00, 10.0) 9.00 (3.00, 10.0) 0.017 0.003 1-minutes Apgar score ≤7, n (%) 8 (0.8%) 0 (0%) 4 (6.1%) 0.574 0.012 5-minutes Apgar score, Median (IQR) 10.0 (6.00, 10.0) 10.0 (9.00, 10.0) 10.0 (7.00, 10.0) 0.008 <0.001 5-minutes Apgar score ≤7, n (%) 1 (1%) 0 (0%) 1 (1.5%) >0.999 0.155Note: Variables are presented as Median (IQR) or n (%). HDP, hypertension disorders of pregnancy; GH, gestational hypertension; PE, preeclampsia; IQR, interquartile range; BMI, Body mass index; ART, assisted reproductive technology; DM, pregestational diabetes; GDM, gestational diabetes; PCOS, polycystic ovary syndrome; PTB, preterm birth; PPH, postpartum hemorrhage; AGA, average for gestational age; SGA, small for gestational age; LGA, large for gestational age.
aUnaffected vs. HDP groups.
bGH vs. PE groups.
First, a correlation analysis was performed to elucidate the absence of a linear relationship between fundus scores and gestational weeks (Fig. 3). Subsequently, in light of the crucial need to discern the association between fundus score and the occurrence of HDP, logistic regression analyses were performed (Table 2), and the results demonstrated significant differences in fundus scores among HDP (adjusted odds ratio [aOR], 2.547; 95% CI, 1.944–3.385, P < 0.05), gestational hypertension (aOR, 2.144; 95% CI, 1.397–3.267, P < 0.05), and preeclampsia (aOR, 2.582; 95% CI, 1.883–3.616, P < 0.001).
 FIGURE 3:
 Linear correlation between fundus score and gestational weeks before 28 weeks of gestation. (a) Linear correlation for all participants. (b) Linear correlation for HDP pregnancies. (c) Linear correlation for GH pregnancies. (d) Linear correlation for PE pregnancies.
TABLE 2 - The stratified analyses of the association between hypertensive disorders of pregnancy and fundus scores Stratification factors Unaffected HDP OR (95% CI) GH OR (95% CI) PE OR (95% CI) Overall 1046 92 26 66 Crude 3.040 (2.456–3.814)∗∗∗ 1.487 (1.055–2.043)∗ 3.714 (2.884–4.877)∗∗∗ Adjusted 2.547 (1.944–3.385)∗∗∗ 2.144 (1.397–3.267)∗∗∗ 2.582 (1.883–3.616)∗∗∗ Maternal age (years) <35.0 876 61 23 38 Crude 3.128 (2.381–4.188)∗∗∗ 1.694 (1.130–2.477)∗∗ 3.919 (2.809–5.644)∗∗∗ Adjusted 2.525 (1.816–3.551)∗∗∗ 1.896 (1.181–3.024)∗∗ 2.845 (1.854–4.463)∗∗∗ ≥35.0 170 31 3 28 Crude 3.235 (2.145–5.165)∗∗∗ 1.855 (0.680–4.629) 3.132 (2.071–5.009)∗∗∗ Adjusted 3.109 (1.937–5.358)∗∗∗ 5.115 (1.267–38.151)∗ 2.884 (1.794–4.942)∗∗∗ BMI at first prenatal visit (kg/m2) <28.0 1010 69 23 46 Crude 2.212 (1.693–2.919)∗∗∗ 1.580 (1.060–2.276)∗ 2.645 (1.886–3.788)∗∗∗ Adjusted 2.954 (2.274–3.890)∗∗∗ 2.244 (1.461–3.441)∗∗∗ 3.073 (2.265–4.244)∗∗∗ ≥28.0 36 23 3 20 Crude 5.281 (3.385–8.921)∗∗∗ 1.215 (0.571–2.381) 6.118 (3.775–10.887)∗∗∗ Adjusted 5.914 (3.388–11.289)∗∗∗ 1.955 (0.799–5.150) 5.866 (3.292–11.531)∗∗∗CI, confidence interval; GH, gestational hypertension; HDP, hypertension disorders of pregnancy; OR, odds ratio; PE, preeclampsia.
∗P < 0.05.
∗∗P < 0.01.
∗∗∗P < 0.001.
We next established the association between the fundus score and HDP when participants were stratified based on a maternal age of at least 35.0 and BMI of at least 28.0 (Table 2). Individuals in the high-risk population subgroup (maternal age ≥ 35.0) had increased aORs of HDP, gestational hypertension, and preeclampsia prediction of 3.109 (95% CI, 1.937–5.358), 5.115 (95% CI, 1.267–38.151), and 2.884 (95% CI, 1.794–4.942), respectively. Meanwhile, the subgroup of overweight pregnancies (BMI ≥28.0) had increased aOR of HDP, GH, and PE prediction of 5.914 (95% CI, 3.388–11.289), 1.955 (95% CI, 0.799–5.150), and 5.866 (95% CI, 3.292–11.531), respectively.
Predictive performance of preeclampsiaSubsequently, we conducted a receiver operating characteristic curve (ROC) analysis to evaluate the predictive performance of the fundus score, and the AUCs, sensitivity, and specificity are presented in Table 3. Figure 4 shows the ROC curves for the predictive performance of HDP, gestational hypertension, and preeclampsia.
TABLE 3 - Screening performance of different marker combinations for hypertensive disorders of pregnancy Groups screening indicators AUC 95% CI Sensitivity Specificity HDP Fundus score 0.800 0.746–0.853 0.663 0.847 Risk factors 0.685 0.625–0.745 0.551 0.804 Fundus score + risk factors 0.837 0.790–0.885 0.786 0.745 GH Fundus score 0.641 0.523–0.759 0.500 0.811 Risk factors 0.509 0.412–0.606 0.038 0.984 Fundus score + risk factors 0.775 0.696–0.854 0.962 0.519 PE Fundus score 0.845 0.791–0.899 0.681 0.904 Risk factors 0.742 0.675–0.810 0.667 0.803 Fundus score + risk factors 0.883 0.834–0.932 0.722 0.934 EPE Fundus score 0.844 0.760–0.928 1.000 0.551 Risk factors 0.694 0.516–0.872 0.692 0.779 Fundus score + risk factors 0.872 0.762–0.983 0.769 0.897 LPE Fundus score 0.838 0.771–0.906 0.698 0.902 Risk factors 0.744 0.669–0.819 0.642 0.794 Fundus score + risk factors 0.874 0.814–0.933 0.736 0.909AUC, area under the curve; CI, confidence interval; HDP, hypertension disorders of pregnancy; GH, gestational hypertension; PE, preeclampsia; EPE, early-onset preeclampsia; LPE, late-onset preeclampsia.
 FIGURE 4:
 ROC curves of the predictive performance of different methods for HDP, GH, and PE. (a) ROC curves of the predictive performance for HDP. (b) ROC curves of the predictive performance for GH. (c) ROC curves of the predictive performance for PE. (d) ROC curves of the predictive performance for early-onset PE. (e) ROC curves of the predictive performance for late-onset PE. AUC, area under the curve; CI, confidence interval.
Regarding the prediction of HDP, The AUC of the fundus score and the combination of the fundus score and risk factors were 0.800 (sensitivity, 0.663; specificity, 0.847; 95% CI, 0.746–0.853) and 0.837 (sensitivity, 0.786; specificity, 0.745; 95% CI, 0.790–0.885). To further evaluate the predictive ability of the fundus score, we calculated its AUC of the fundus score in predicting preeclampsia. The AUCs of the fundus score and the combination of the fundus score and risk factors were 0.845 (sensitivity, 0.681; specificity, 0.904; 95% CI, 0.791–0.899) and 0.883 (sensitivity, 0.722; specificity, 0.934; 95% CI, 0.834–0.932), respectively (Table 4).
留言 (0)