
記住我

Most adults 40–75 years with hypertension are eligible for statin therapy [1], the preferred treatment for hypercholesterolemia in the setting of high risk for atherosclerotic cardiovascular disease (ASCVD) [2–5]. In population-based observational studies, adults with hypertension on statins have a multivariable adjusted odds ratio for hypertension control of approximately 2 compared with those not on statins [6,7]. In propensity-score matched adults with hypertension, those on statins had an odds ratio for hypertension control on ambulatory monitoring of 1.6–1.8 compared with those not on statins [8].
Although the odds ratios for hypertension control are higher and the odds ratios for treatment- resistant hypertension lower in statin-treated than untreated adults [6–9], the antihypertensive effects of statins in randomized controlled trials appear to be less. In a meta-analysis, statins were associated with 4 mmHg lower SBP (mmHg) when baseline values were greater than 130 but were without effect when baseline SBP was 130 or less [10]. In the Anglo-Scandinavian Cardiac Outcomes Trial (ASCOT), participants randomized to moderate-intensity atorvastatin had 1.1/0.7 mmHg lower BP than those randomized to placebo [11,12]. However, among adults in the Heart Outcomes Prevention Evaluation (HOPE)-3 trial with baseline SBP 138, moderate-intensity rosuvastatin had negligible BP effect [12,13]. In propensity-score matched adults with hypertension, those on statins had 2–3 mmHg lower SBP on ambulatory monitoring than those not on statins [8]. A recent meta-analysis reported that statins lowered BP 1.42/0.82 mmHg in 45 1734 adults with and without hypertension in 49 randomized controlled trials [14]. On balance, the BP effects of statins appear limited in randomized, controlled trials and unlikely to explain the 1.6–2-fold greater odds ratios for hypertension control in statin-treated than untreated adults in observational studies.
We found that adults with hypertension who were treated for hypercholesterolemia were more likely to be aware of and treated for hypertension than those not on cholesterol-lowering therapy [7]. This study was undertaken primarily to determine if the higher rate of hypertension control in statin-treated adults than statin-eligible adults not on statins in observational studies was explained by a greater probability of receiving antihypertensive therapy. Statin-ineligible adults were excluded from the primary analysis, as they are younger, more often female individuals, and have lower cardiovascular risk than statin-treated and statin-eligible adults not on statins [1,15].
METHODSNHANES assess a representative sample of the US civilian, noninstitutionalized population using protocols approved by the Institutional Review Board of the National Center for Health Statistics of the Centers for Disease Control and Prevention [6,7,15,16]. All participants provided written informed consent. The cross-sectional surveys are conducted in 2-year cycles, noting that the 2017–2018 and 2019–2020 2-year cycles were combined given truncation of the latter cycle by COVID-19 [16]. This study includes public use data files from five surveys, combining three 2-year cycles for 2009–2014, and the 2015–2016 and 2017–2020 cycles for 2015–2020. The Strengthening of Observational Studies in Epidemiology (STROBE, cross-sectional studies) reporting statement was followed [17].
Inclusion and exclusion criteriaGiven the focus on statin-eligible adults with hypertension, men and women 20–75 years of age who met criteria for hypertension and who had at least one valid BP value were included. Adults without a fasting lipid profile required to assess statin eligibility or with fasting triglyceride values at least 400 were excluded.
Race/ethnicity was determined by self-report and classified as non-Hispanic White (NHW), non-Hispanic Black (NHB), non-Hispanic Asian (NHA), Hispanic ethnicity (HSP) of any race, and other [6,7,15,16]. In NHANES 2009–2010, NHA adults were not uniquely identified.
BP (mmHg) in NHANES measurement was previously described, including the change from mercury sphygmomanometry in 2009–2016 to oscillometry for 2017–2020 and calibration of values over time [18]. Blood pressure was measured by both methods in 2017–2018. Based on a comparative analysis, the oscillometric values for 2017–2020 were altered by +1.5/−1.3 to match previously measured mean auscultatory BP values by mercury sphygmomanometry [18,19].
Hypertension was defined as mean SBP at least 140 mmHg or DBP at least 90 mmHg, or a positive response to the question, ‘Are you currently taking medication to lower your BP?’ [6,7,15,19].
Hypertension awareness was defined by ‘Yes’ in response to, ‘Have you been told by a physician that you have hypertension?’
Hypertension treatment was defined by an affirmative response to the question ‘Are you taking prescribed medication to control your blood pressure?’
Treatment effectiveness equaled the proportion of treated adults with BP controlled [6,7].
Hypertension control was defined as SBP less than 140 mmHg and DBP less than 90 mmHg, while recognizing that goals for patients with diabetes mellitus and chronic kidney disease were less than 130/less than 80 mmHg for 2009–2014 and less than 130 mmHg/less than 80 mmHg for all adults from 2018 to 2020 [20,21]. The 2014 recommendation for a BP goal less than 150 mmHg/less than 90 mmHg for adults at least 60 years old without diabetes or CKD was endorsed by leading primary care organizations in the United States until this past year [22–24].
Statin treatment and eligibilityThe principal analysis compared the clinical epidemiology of hypertension in statin-treated adults and statin-eligible adults not on statins. Statin treatment was defined by reviewing the participants’ prescriptions taken in the previous 30 days matched to statins approved in the United States during 2009–2020. For those not on statins, eligibility for treatment was defined according to the 2013 ACC/AHA Guideline by [2]: ASCVD, ages 20–75, low-density lipoprotein cholesterol (LDL-C, mg/dl) at least 190 mmHg; ages 20–75 (no adults 20 years old in this analysis were statin-eligible); diabetes mellitus; age 40–75, LDL-C 70–189; no diabetes; age 40–75, LDL-C 70–189, 10-year ASCVD risk at least 20%, or no diabetes; and age 40–75, LDL-C 70–189, 10-year ASCVD risk 7.5% to less than 20%.
Diabetes mellitus included diagnosed and undiagnosed cases as previously defined [25].
ASCVD was defined as an affirmative response to one or more questions of having ever been told that you have had a heart attack, stroke, or angina from the Rose questionnaire [26,27].
ASCVD 10-year risk scores (ASCVD10) were calculated using race-specific and sex-specific Pooled Cohort Equations in adults aged 40–75 [2].
Smoking was determined from the question, ‘Do you now smoke cigarettes?’ Participants were categorized as current smokers if they answered either ‘Every day’ or ‘some days [28]’.
Education was defined as less than high school, high school, or some college, an associate degree, college graduation or above, that is, greater than high school.
Income relative to the federal poverty level (FPL), an index reported by NHANES, was calculated as family income divided by the poverty level specific to family size, year, and state [28].
Healthcare insurance status was dichotomized as insured or uninsured from participant responses [28].
Access to care was defined by affirmative responses to health insurance, a usual source of care, and one or more healthcare visits annually [28].
Data analysisSAS 9.4 (Cary, North Carolina, USA) survey procedures were used for analyses. Appropriate weights accounting for unequal probabilities of selection, oversampling, and nonresponse were employed. NHANES reporting guidelines were followed. The Rao–Scott chi-square test was used to assess for differences in categorical variables, and the Wald F test was used to test for differences in continuous variables. For subpopulations of interest, for example, age and race-ethnicity group, domain analysis was used, as the formation of subpopulations was unrelated to sample design. Domain analysis accounts for this variability by using the entire sample in calculating variance of domain estimates. Unadjusted and adjusted survey logistic regression models were used to provide odds ratio on hypertension control in the primary analysis. The unadjusted and adjusted logistic regression were performed with and without antihypertensive treatment as an independent variable to assess the impact of treatment on the association between statin therapy and hypertension control. On the basis of prior evidence [7,15,26,28], the following factors were included in multivariable models: age, sex, race and ethnicity, income, education, access to care, ASCVD, and diabetes. Two-sided P values less than 0.05 were accepted as statistically significant.
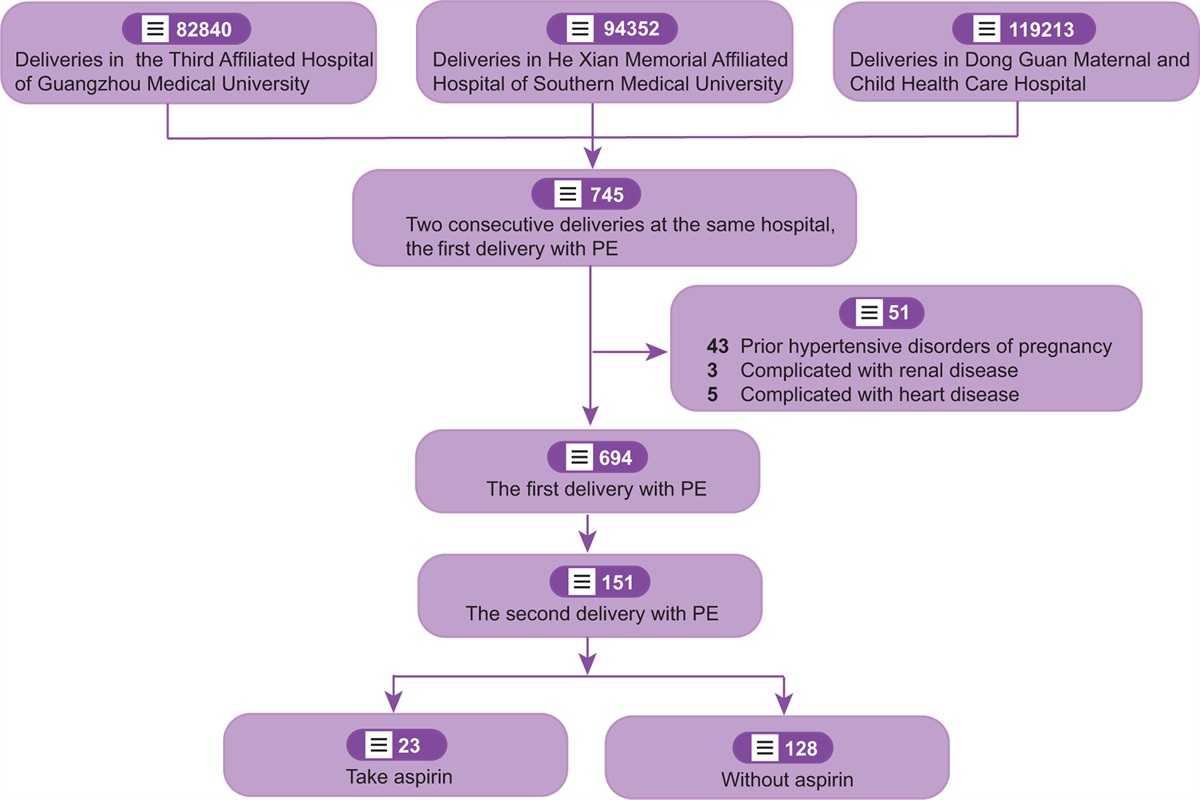
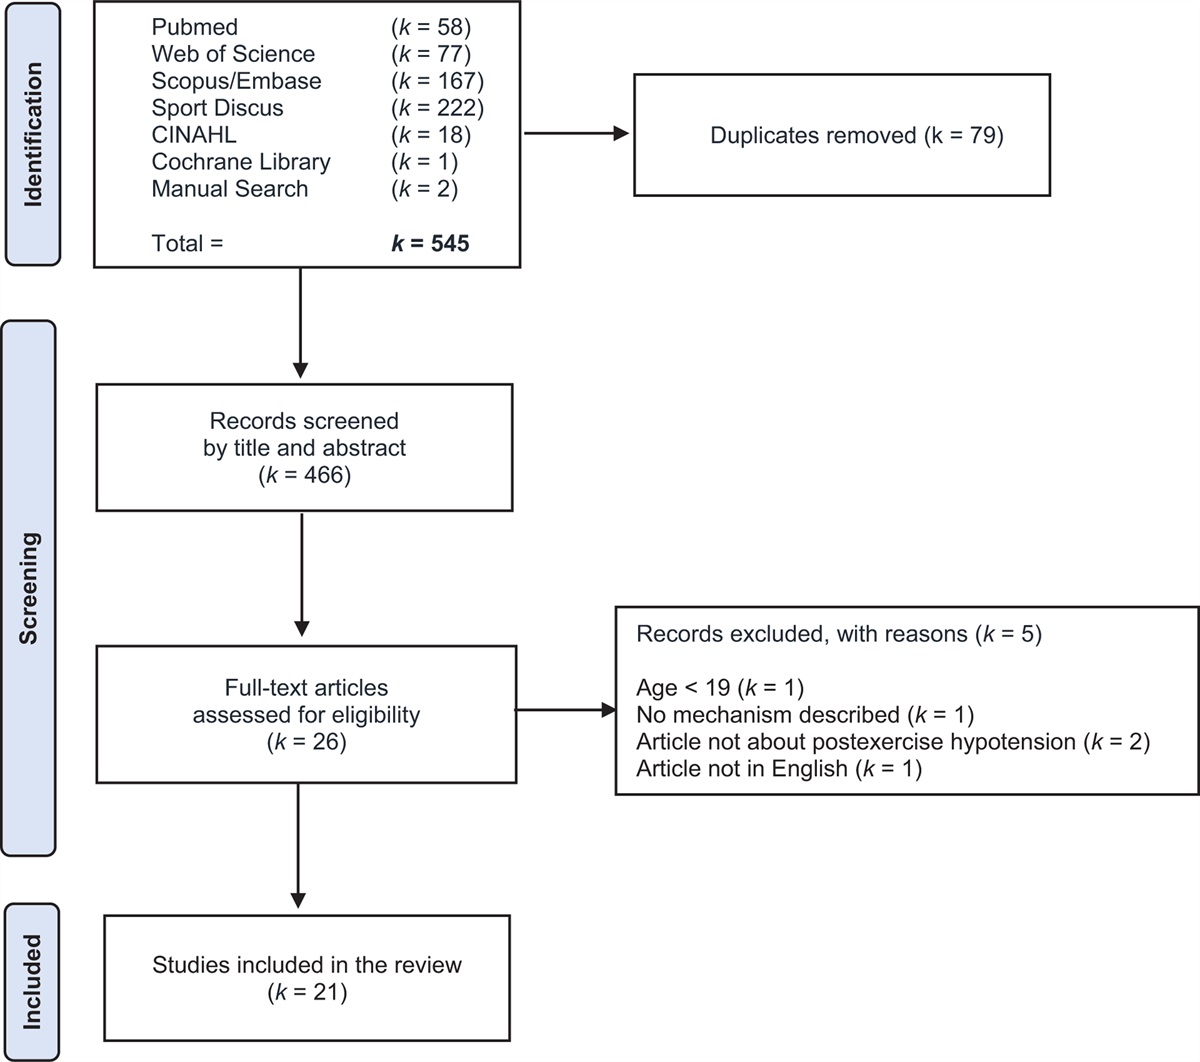
RESULTSThe process for determining the NHANES analysis subset for this study is depicted in Fig. 1. Of participants meeting the criteria for age and hypertension, 3% were excluded for missing lipid values. The 2013 Cholesterol Guideline recommends statins for adults 20–75 years of with LDL-cholesterol at least 190 or adults less than 75 years with ASCVD. No adults less than 21 years with hypertension had either condition during 2009–2020, so adults 21–75 years were analyzed. Within the 21–75 years age group, the NHANES fasting sample included 3814 individuals representing 60 000 000 adults in the US population. The numbers of NHANES participants and the US population represented for the statin-ineligible group was 956 and 18.2 million, for the statin-eligible untreated group 1452 and 19.7 million, and for the statin-treated group 1406 and 22.1 million, respectively.
 FIGURE 1:
 National Health And Nutrition Examination Survey participants inclusion–exclusion diagram. The process is shown for selecting NHANES participants in 2009–2020 with hypertension who were either statin treated or statin eligible but not on statins. NHANES, National Health And Nutrition Examination Surveys.
Selected descriptive characteristics for adults with hypertension stratified by statin treatment and statin-eligible but not statin-treated during 2009–2020 are provided in Tables 1 and 2. The frequency of missing data for variables in Tables 1 and 2 are provided in Table S1, https://links.lww.com/HJH/C382. The statin-treated group was older than the statin-eligible untreated group (Table 1). The statin-treated group was more likely to be NHW and less likely to be NHB or Hispanic than the statin-eligible untreated group. Access to care was also greater in statin-treated adults. SBP and DBP were significantly lower, whereas hypertension awareness, treatment, and control were significantly higher in the statin-treated than statin-eligible untreated group. The proportion of adults on antihypertensive treatment that attained control, a measure of treatment effectiveness, was also greater in statin-treated than statin-eligible untreated adults.
TABLE 1 - Characteristics of adults 21–75 years with hypertension by statin eligibility and treatment in National Health And Nutrition Examination Surveys 2009 through 2020 Characteristics Statin status P values Population Eligible untreated Statin treated Untreated vs. statin treated NHANES (n) 1452 1406 Population (n)a 19 656 535 22 126 625 Population (%)b 32.8 36.9 Age (years) 60.3 (59⋅7, 61⋅0) 61.7 (60⋅9, 62⋅4) 0.02 Female (%) 48.8 (45.2, 52.4) 46.3 (42.4, 50.2) 0.43 Non-Hispanic white (%) 61.6 (57.0, 66.1) 69.6 (65.3, 73.9) 0.0005 Non-Hispanic Black (%) 19.3 (16.1, 22.5) 12.8 (10.3, 15.4) <.0001 Hispanic (%) 12.2 (9.8, 14.6) 7.9 (6.2, 9.6) <.0001 Non-Hispanic Asian (%) 3.6 (2.7, 4.5) 3.8 (2.7, 4.9) 0.70 Other (%) 3.4 (1.9, 4.9) 5.9 (3.7, 8.1) 0.05 Care access (%) 77.7 (74.7, 80.8) 93.2 (91.4, 95.0) <.0001 Hypertension variables SBP (mmHg) 138.6 (137.2, 139.9) 130.3 (128⋅7, 131⋅9) <.0001 DBP (mmHg) 76.2 (75.1, 77.2) 71.1 (70.1, 72.2) <.0001 Aware (%) 80.6 (77.5, 83.6) 93.4 (91.2, 95.6) <.0001 Treated (%) 70.7 (67.4, 74.1) 91.4 (88.8, 94.0) <.0001 Control (treated) (%)c 65.3 (60.8, 69.8) 75.5 (71.8, 79.3) 0.0009 Control (all) (%)d 46.2 (42.2, 50.2) 69.0 (64.9, 73.2) <.0001Data are provided as percentage or mean and 95% confidence intervals.
aNHANES subjects are assigned sample weights reflecting the number of people represented in the US civilian population. In this row, the sum of sample weights reflects the number of adults in the population with hypertension who are either statin-eligible but untreated or statin treated.
bThe percentages are provided for the US population with hypertension 21–75 years of age who are either statin-eligible but untreated (32.8%) or statin treated (36.9%).
cBP control to less than 140 mmHg/less than 90 mmHg is shown for adults with hypertension who report taking BP medications.
dBP control to less than 140 mmHg/less than 90 mmHg is shown for all adults with hypertension including those who are not taking antihypertensive medications.
Data are presented as mean and 95% confidence intervals. ASCVD, atherosclerotic cardiovascular disease; DM, diabetes mellitus; FPL, income as a percentage of the federal poverty level; LDL, low-density lipoprotein cholesterol; NHANES, National Health And Nutrition Examination Surveys.
∗P values not provided as distributions of ASCVD risk groups are different as adults with ASCVD are more likely to be on statins and statins lower LDL-C, which can change risk group.
Statin-eligible untreated adults were more likely to have income less than 200% of the federal poverty level and less likely to have diabetes mellitus than those on statins. The statin-treated group had lower LDL-C values and lower 10-year ASCVD risk when excluding those with clinical ASCVD. Education attainment and cigarette smoking were not different.
SBP was significantly higher in the statin-eligible untreated than statin-treated group (Fig. 2, top panel). Conversely, hypertension awareness, treatment, treatment effectiveness (controlled/treated), and BP control were significantly lower in the statin-eligible group not on statins (Fig. 2, bottom panel).
 FIGURE 2:
 SBP and the hypertension control cascade 2009–2020 in statin-treated and statin-eligible untreated adults. Top panel: among adults with hypertension, mean SBP values (95% confidence intervals) are higher in statin-eligible adults not on statins (untreated) than statin-treated adults. Bottom panel: hypertension awareness, treatment, proportion of treated adults controlled, and control are higher in statin-treated than statin-eligible untreated adults.
Univariable and multivariable odds ratios and 95% confidence intervals are provided for the association between statin therapy and hypertension control (Table 3). In multivariable logistic regression, hypertension control was positively associated with statin therapy [odds ratio 1.94 (95% confidence interval (1.53–2.47)], statins were marginally related to hypertension control when antihypertensive drug therapy was included in multivariate analysis [1.29 (0.96–1.73)].
TABLE 3 - Association between statin therapy and hypertension control Hypertension control Univariable Multivariable – 1 Multivariable – 2 Statin therapy 2.36 [1.87–2 99] 1.94 [1.53–2.47] 1.29 [0.96–1.73]Data are presented as odds ratios and 95% confidence intervals. Multivariable – 1: controlled for age, sex, race/ethnicity, access to care, education, income, diabetes mellitus, and atherosclerotic cardiovascular disease. Multivariable – 2: controlled for variables in multivariable model 1 and antihypertensive therapy.
During 2009–2020, SBP was 8.3 mmHg lower and control to less than 140 mmHg/less than 90 mmHg was 22.8 percentage points higher in statin-treated than statin-eligible untreated adults (Table 1 and Fig. 2). The difference in BP between statin-treated and untreated adults from a representative sample of the US population is greater than reported from randomized controlled trials [10–14]. The mechanism by which statin therapy is associated with lower BP values and higher control rates among adults with hypertension in observational studies is not well defined. Our current analysis indicates that statin-treated adults are more likely to be aware of and treated for hypertension than statin-eligible untreated adults. Moreover, the statistically significant relationship between statin therapy and hypertension control was no longer significant after controlling for antihypertensive therapy. These observations suggest that the greater likelihood of antihypertensive therapy largely explains the lower BP values and higher control rates in statin-treated than statin-eligible untreated adults with hypertension.
Although statins are unlikely to explain the majority of the 8.3 mmHg lower SBP in statin-treated than statin-eligible untreated adults observed in this report, evidence suggests that statins have a limited effect to lower BP, improve hypertension control, and reduce the likelihood of treatment-resistant hypertension [6–10,14,29–31]. Among statin-eligible adults with treated hypertension, those on statins were more likely to have their hypertension controlled than those not on statins (Table 1). Thus, different lines of evidence indicate that statin therapy may have modest antihypertensive effects.
With regard to health equity, NHW adults were relatively over-represented, whereas NHB and Hispanic adults were under-represented in the statin-treated group (Table 1). Limited access to care in NHB and especially Hispanic relative to NHW adults likely plays a significant role in disparities of BP control and statin therapy [15,19,28]. Improving access to care, which includes healthcare insurance, especially for historically marginalized populations in the United States, could improve concurrent hypertension control and rates of statin therapy, thereby improving health equity [32,33].
Limitations of our study include NHANES cross-sectional, single time-point sampling of the US civilian population. For example, it appears that most patients with LDL at least 190 prior to statin therapy had LDL-C lowered to less than 190 on statin therapy given percentage differences in this risk category between statin-eligible untreated and treated adults. Similarly, statin-treated adults with and without diabetes and LDL-C less than 70 likely had LDL-C at least 70 before statin therapy. Regarding BP, given intra-individual variability of BP, averaging multiple values on different days is recommended to accurately define mean values for individuals. The sample size for NHANES is limited, which constrains power for assessing changes over time, especially within and between race-ethnicity groups. Reliance on the NHANES fasting sample reduced sample size for our analysis by more than 50%, and lipid values were missing for 3% of identified participants in the fasting sample. Sample weights were adjusted for adults in the analysis to reflect the civilian, noninstitutionalized US population.
Our study defined statin eligibility by the 2013 ACC/AHA Cholesterol Guideline [2], which increased the proportion of statin-eligible adults from Adult Treatment Panel III [4], although differences narrowed with the 2004 update [5]. The 2013 ACC/AHA Cholesterol Guideline recommended statin therapy for adults without diabetes and 10-year ASCVD risk 7.5 to less than 20% [3], whereas the 2018 Guideline, advocated for a shared decision among patients and their providers, that is, the impact on statin therapy is unclear.
Recommendations for antihypertensive therapy changed twice during 2009–2020. The unofficial Joint National Committee Eighth Report [22], endorsed by primary care physicians [23,24], raised the threshold for treating SBP to at least 150 for adults at least 60 years without diabetes or chronic kidney disease rather than at least 140 [20]. In contrast, the 2017 ACC/AHA High Blood Pressure Guideline increased the proportion of adults with a recommendation for antihypertensive therapy by lowering the threshold for treating SBP to at least 130 mmHg or DBP at least 80 mmHg for most adults with 10-year ASCVD risk of at least 10% [21]. Despite study limitations, NHANES is rigorously designed and performed. Analyses of NHANES data have illuminated our understanding of cardiometabolic risk and changes over time in the general civilian population and disparities in historically marginalized groups for more than 30 years.
Our study did not address statin benefits on cholesterol and ASCVD given the cross-sectional NHANES design. In statin-eligible adults not on statins, LDL-C (mg/dl) averaged 134.1 in 2009–2014 and 131.5 in 2015–2020, similar to baseline values of 133 in the Anglo-Scandinavian Cardiac Outcomes Trial (ASCOT) [11]. In ASCOT, moderate-intensity atorvastatin reduced mean LDL-C to 87 (34.6%) at 2 years. Fatal and nonfatal coronary heart disease fell 36% and total cardiovascular events and procedures 21%. Thus, lack of statin therapy in eligible adults with hypertension contributes to a large burden of preventable cardiovascular disease.
In summary, SBP was approximately 8 mmHg lower and control to less than 140 mmHg/less than 90 mmHg 22 percentage points higher in statin-treated than statin-eligible untreated adults. The differences in BP between statin-treated and untreated adults in this observational study are greater than the results from meta-analyses of randomized controlled trials. The higher rate of hypertension control in the statin-treated subset was no longer significant after controlling for antihypertensive therapy. These observations are consistent with the viewpoint that higher rates of blood pressure control in statin-treated than statin-eligible untreated adults with hypertension in observational studies are largely explained by differences in antihypertensive treatment.
ACKNOWLEDGEMENTSThe authors appreciate the expert assistance of Ben Riesser, Farris Linett, and Kiera Young for assistance with preparing and submitting the manuscript.
Sources of support: American Medical Association.
Disclaimer: the findings and conclusions in this report are those of the authors and do not necessarily represent the official American Medical Association policy.
Conflicts of interestB.M.E. receives royalties from UpToDate for hypertension-related topics. None of the other authors has disclosures to report.
REFERENCES 1. Pencina MJ, Navar-Boggan AM, D’Agostino RB, Williams K, Neely B, Sniderman AD, Peterson ED. Application of new cholesterol guidelines to a population-based sample. N Engl J Med 2014; 370:1422–1431. 2. Stone NJ, Robinson JG, Lichtenstein AH, Bairey Merz CN, Blum CB, Eckel RH, et al. 2013 ACC/AHA Guideline on the treatment of blood cholesterol to reduce atherosclerotic cardiovascular risk in adults. Circulation 2014; 129:S1–S45. 3. Grundy SM, Stone NJ, Bailey AL, Beam C, Birtcher KK, Blumenthal RS, et al. 2018 AHA/ACC/AACVPR/AAPA/ABC/ACPM/ADA/AGS/APhA/ASPC/NLA/PCNA Guideline on the management of blood cholesterol: a report of the American College of Cardiology/American Heart Association Task Force on clinical practice guidelines. Circulation 2019; 139:e1032–e1143. 4. Executive summary of the Third Report of the National Cholesterol Education Program (NCEP) expert panel on detection evaluation, and treatment of high blood cholesterol in adults (Adult Treatment Panel III). JAMA 2001; 285:2486–2497. 5. Grundy SM, Cleeman JI, Bairey Merz CN, Brewer HB Jr, Clark LT, Hunninghake DB, et al. Implications of recent clinical trials for the national cholesterol education program Adults Treatment Panel III Guidelines. Circulation 2004; 110:227–239. 6. Egan BM, Li J, Shatat IF, Fuller M, Sinpoli A. Closing the gap in hypertension control between younger and older adults: National Health and Nutrition Examination Surveys (NHANES) 1988 to 2010. Circulation 2014; 129:2052–2061. 7. Egan BM, Li J, Hutchison FN, Ferdinand K. Hypertension in the United States, 1999 to 2012: progress toward health people 2020 goals. Circulation 2014; 130:1692–1699. 8. Spannella F, Filipponi A, Giulietti F, Di Pentima C, Bordoni V, Sarzani R. Statin therapy is associated with better ambulatory blood pressure control: a propensity score analysis. J Hypertens 2020; 38:546–552. 9. Gupta AK, Nasothimiou G, Chang CL, Sever PS, Dahlöf B, Poulter NR. on behalf of the ASCOT investigators. Baseline predictors of resistant hypertension in the Anglo-Scandinavian Cardiac Outcomes Trial (ASCOT): a risk score to identify those at high-risk. J Hypertens 2011; 29:2004–2013. 10. Strazzullo P, Kerry SM, Barbato A, Versiero M, D’Elia L, Cappuccio FP. Do statins reduce blood pressure? A meta-analysis of randomized, controlled trials. Hypertension 2007; 49:792–798. 11. Sever PS, Dahlof B, Poulter NR, Wedel H, Beevers G, Caulfield M, et al. for the ASCOT investigators. Prevention of coronary and stroke events with atorvastatin in hypertensive patients who have average or lower-than-average cholesterol concentrations, in the Anglo-Scandinavian Cardiac Outcomes Trial—Lipid Lowering Arm (ASCOT-LLA): a multicentre randomised controlled trial. Lancet 2003; 361:1149–1158. 12. Thompoulos C. Do really statins reduce blood pressure? Editorial commentary. J Hypertens 2020; 38:408–411. 13. Yusuf S, Lonn E, Pais P, Bosch J, López-Jaramillo P, Zhu J, et al. HOPE-3 Investigators. Blood-pressure and cholesterol lowering in persons without cardiovascular disease. NEJM 2016; 374:2032–2043. 14. Liu HT, Deng NH, Wu ZF, Zhou ZY, Tian Z, Liu XY, et al. Statin's role on blood pressure levels: meta-analysis based on randomized controlled trials. J Clin Hypertens 2023; 25:238–250. 15. Egan BM, Li J, Qanungo S, Wolfman TE. Blood pressure and cholesterol control in hypertensive hypercholesterolemic patients: a report from NHANES 1988–2010. Circulation 2013; 128:29–41. 16. Stierman B, Afful J, Carroll MD, Chen TC, Davy O, Fink S, et al. National Health and Nutrition Examination Survey 2017–March 2020 prepandemic data files—development of files and prevalence estimates for selected health outcomes. National Health Statistics Reports; no 158. Hyattsville, MD: National Center for Health Statistics. 2021. 17. STROBE Statement – Checklist of items that should be included in reports of cross-sectional studies. STROBE-checklist-v4-cross-sectional.pdf. [Accessed 16 February 2023] 18. Ostchega, Y, Nwankwo T, Chiappa Michele, Wolz M, Graber J, Nguyen DT. Comparing blood pressure values obtained by two different protocols: National Health and Nutrition Examination Survey, 2017–2018. National Center for Health Statistics. Vital and health statistics. 2021;Series 2, Data evaluation and methods research; no. 187. https://stacks.cdc.gov/view/cdc/104185 [Accessed 7 January 2024] 19. Muntner P, Miles MA, Jaeger BC, Hannon L III, Hardy ST, Ostchega Y, et al. Blood pressure control among US adults, 2009 to 2012 through 2017 to 2020. Hypertension 2022; 79:1971–1980. 20. Chobanian AV, Bakris GL, Black HR, Cushman WC, Green LA, Izzo JL Jr, et al. Joint National Committee on Prevention, Detection, Evaluation, and Treatment of High Blood Pressure. Seventh Report of the Joint National Committee on prevention, detection, evaluation, and treatment of high blood pressure. Hypertension 2003; 42:1206–1252. 21. Whelton PK, Carey RM, Aronow WS, Case DE Jr, Collins KJ, Dennison-Himmelfarb C. 2017 ACC/AHA guideline for the prevention, detection, evaluation, and management of high blood pressure in adults. Hypertension 2018; 71:e13–e115. 22. James PA, Oparil S, Carter BL, Cushman WC, Dennison-Himmelfarb C, Handler J, et al. 2014 Evidence-based guideline for the management of high blood pressure in adults. Report from the panel members appointed to the Eighth Joint National Committee (JNC8). JAMA 2014; 311:507–520. 23. Qaseem A, Wilt TJ, Rich R, Humphrey LL, Frost J, Forciea MA. Pharmacologic treatment of hypertension in adults aged 60 years or older to higher versus lower blood pressure targets: a clinical practice guideline from the American College of Physicians and the American Academy of Family Physicians. Ann Intern Med 2017; 166:430–437. 24. Coles S, Fisher L, Lin KW, Lyon C, Vosooney AA, Bird MD. Practice Guidelines – blood pressure targets in adults with hypertension: a clinical practice guideline from the AAFP. Am Fam Phys 2022; 106:6Online. 25. Menke A, Casagrande S, Geiss L, Cowie CC. Prevalence and trends in diabetes among adults in the United States, 1988–2012. JAMA 2015; 314:1021–1029. 26. Muntner P, DeSalvo KB, Wildman RP, Raggi P, He J, Whelton PK. Trends in the prevalence, awareness, treatment, and control of cardiovascular disease risk factors among noninstitutionalized patients with a history of myocardial infarction and stroke. Am J Epidemiol 2006; 163:913–920. 27. Rose GA, Blackburn H, Gillium RF, Prineas RJ. Cardiovascular survey methods. 2nd ed.Geneva, Switzerland: World Health Organization; 1982. 28. Egan BM, Li J, Sutherland SE, Rakotz MK, Wozniak GD. Hypertension control in the U.S. 2009 to 2018: factor underlying falling control rates across age and race-ethnicity groups. Hypertension 2021; 78:578–587. 29. Lee S, Yang S, Chang MJ. Antihypertensive effects of rosuvastatin in patients with hypertension and dyslipidemia. a systematic review and meta-analysis of randomized studies. PLoS One 2021; 16:e0260391. 30. Nickenig G, Bäumer AT, Temur Y, Kebben D, Jockenhövel F, Böhn M. Statin-sensitive dysregulated AT1 receptor function and density in hypercholesterolemic men. Circulation 1999; 100:2131–2134. 31. Borghi C, Dormi A, Veronesi M, Sangiorgi Z, Gaddi A. Brisighella Heart Study Working Party. Associations between different lipid-lowering treatment strategies and blood pressure control in the Brishighella Heart Study. Am Heart J 2004; 148:285–292. 32. Egan BM, Li J, Small J, Nietert PJ, Sinopoli A. The growing gap in hypertension control between insured and uninsured adults: NHANES 1988–2010. Hypertension 2014; 64:997–1004. 33. Egan BM, Li J, Sarasua S, Davis RA, Fiscella KA, Tobin JN, et al. Cholesterol control among uninsured adults did not improve from 2001–2004 to 2009–2012 as disparities with both publicly and privately insured adults doubled. JAHA 2017; 6:e006105.
留言 (0)