
記住我
Ulcerative colitis (UC) and Crohn’s disease (CD), chronic inflammatory diseases of the gastrointestinal tract, have debilitating effects that significantly reduce patients’ health-related quality of life [1–4]. Diarrhea and abdominal pain (AP) in CD, and rectal bleeding (RB) in UC are common symptoms recognized as important patient-reported outcomes (PROs) that can be used for measuring disease activity and symptomatic burden in clinical studies [5–9]. In recognition of the strong correlation between symptomatic PROs and patient wellbeing, current treatment guidelines for UC and CD emphasize the need for control of clinical symptoms as an early treatment target [8]. Frequent monitoring of PROs throughout the disease course is also likely to help achieve durable improvements to patient quality of life [8,10–13].
Vedolizumab is an anti-α4β7 integrin antibody that selectively blocks lymphocyte trafficking to the gut [14,15]. The GEMINI clinical trials have established the efficacy and safety of intravenous (IV) vedolizumab induction and maintenance therapy for patients with moderate to severe UC and CD [16–19]. A post hoc analysis of data from the GEMINI studies showed an early onset of treatment response to vedolizumab 300 mg IV induction. Rates of clinical remission (total Mayo score of ≤2 and no individual subscore of >1 for patients with UC, or CD activity index [CDAI] score of ≤150 for patients with CD) were significantly higher in vedolizumab- vs. placebo-treated patients by the end of induction (week 6 of treatment) [20,21]. Patient-reported symptoms of inflammatory bowel disease (IBD) (combined subscores of RB and stool frequency [SF] in UC, and loose SF and AP in CD) declined weekly from baseline during induction and were significantly improved vs. placebo by the end of the induction period [20].
A post hoc analysis was conducted to assess the onset of responses to vedolizumab IV treatment over the 6-week induction period of the VISIBLE 1 [22] and VISIBLE 2 [23] phase 3 studies. The aim was to confirm the timing of improvement of symptoms after initiation of treatment with vedolizumab, as reported by patients with moderate to severe UC or CD and to evaluate in more detail the changes to early symptomatic PROs within the first 6 weeks of vedolizumab IV induction.
Methods PatientsPatients participating in the VISIBLE 1 and 2 studies were aged 18–80 years (eligibility criteria have been described previously [22,23]). In VISIBLE 1, enrolled patients had moderate to severe UC (Mayo score of 6–12 and endoscopic subscore of ≥2) diagnosed ≥6 months before enrollment (on the basis of clinical, endoscopic and histologic evidence), as well as evidence of UC extending proximal to the rectum (≥15 cm of involved colon). VISIBLE 2 patients had moderate to severe CD (CDAI score of 220–450) diagnosed ≥3 months before enrollment (on the basis of clinical, endoscopic and histologic evidence). For both VISIBLE studies, eligible patients had also previously demonstrated an inadequate response or intolerance to corticosteroids (CS), immunomodulators and/or antitumor necrosis factor alpha (anti-TNFα) treatments [22,23]. VISIBLE study protocols permitted patients to continue oral CS treatment (prednisone at a stable dose of ≤30 mg/day, budesonide at a stable dose of ≤9 mg/day, or equivalent steroid), with stable dosing for 2 weeks prior to study entry. During the study, stable CS dosing was maintained unaltered until week 6 [22,23].
Study designVISIBLE 1 (ClinicalTrials.gov, NCT02611830; EudraCT, 2015-000480-14) [22] and VISIBLE 2 [23] (ClinicalTrials.gov, NCT02611817; EudraCT, 2015-000481-58) were phase 3, randomized, placebo-controlled clinical studies. Both included an identical open-label IV induction phase, comprising vedolizumab 300 mg IV dosing at weeks 0 and 2. Concomitant treatment with immunosuppressive agents and oral 5-aminosalicylic acids and stable CS dosing were also permitted. The VISIBLE clinical study protocols and other study-related documents were reviewed and approved by the local or central institutional review boards of all study sites, and studies were conducted in compliance with informed consent regulations of the Declaration of Helsinki, International Conference on Harmonisation Guidelines for Good Clinical Practice and all applicable local laws and regulations [22,23].
Outcome measures and endpointsThe following outcomes collected from patients’ inputs into an electronic diary during the 6-week induction period were included in the post hoc analysis. Patient-reported symptom subscores were recorded daily by patients over the first 14 days of induction and then weekly thereafter.
For patients with UC, patient-reported symptoms related to SF were derived from the SF symptom item subscore of the Mayo disease activity score (where normal SF = 0; 1–2 stools more than normal = 1; 3–4 stools more than normal = 2; and ≥5 stools more than normal = 3). RB was assessed using the RB item subscore of the Mayo score (no blood = 0; visible blood with stool <50% of the time = 1; visible blood with stool ≥50% of the time = 2; and blood passes alone = 3). Other endpoints derived from these PROs included SF improvement (defined as an SF subscore of 0) and RB improvement (defined as a reduction of ≥1 [on the 4-point scale] for the mean RB subscore of 7 days). Patient-reported clinical remission was defined as scores of 0 for the SF and RB subscores of the Mayo score [24].
For patients with CD, SF was defined as the number of liquid or very soft stools per day. AP severity was rated by patients as no pain = 0; mild pain = 1; moderate pain = 2; and severe pain = 3 (same definitions as used for SF and AP components of the CDAI). SF improvement was defined as a reduction of at least three stools for the mean of 7 days. Change in AP severity from baseline over time was also calculated at the end of each week. The exploratory PRO2 endpoint (a two-item PRO, sum of SF and AP) [6–8] was assessed weekly during the induction phase in patients with CD. The definition of patient-reported clinical remission was based on the PRO2 endpoint, where a PRO2 score of ≤8 was considered to be patient-reported clinical remission (cutoff corresponding to a CDAI score of <150) [6].
Statistical analysisThis post hoc analysis included data from all enrolled patients who received at least one dose of vedolizumab during the induction phase of the VISIBLE 1 or VISIBLE 2 studies, termed the full analysis set induction (FAS-I). All analyses were performed based on observed data (no imputation of missing data was applied) from patients who received at least one dose of vedolizumab during induction (week 0 dose). Data from patients who discontinued prior to week 6 were included until the time of discontinuation. PRO scores (SF, RB and AP) were summarized each week as 7-day mean ± SD for weeks 0 (baseline) to 6 of vedolizumab induction, along with weekly mean ± SD change from baseline. Mean ± SD was used to summarize continuous efficacy endpoints (PRO data) and median (interquartile range) was used for variables such as serum biomarker concentrations, as reported in patient baseline characteristics. Number and percentage of patients (with 95% confidence interval [CI]) achieving SF or RB improvement each week were calculated. SF improvement in UC was defined as a SF Mayo subscore of 0; RB improvement was a reduction of ≥1 (on the 4-point scale) for the mean RB subscore of 7 days. SF improvement in CD was defined as a reduction of at least three stools for the mean of 7 days. Change in AP severity during the induction was summarized by frequency tables, overall and separately for patients reporting severe, moderate, mild or no pain at baseline.
Data were analyzed for the overall population, by prior anti-TNFα treatment status (naive vs. experienced), and by baseline disease severity. For patients with UC, a Mayo score of 6–8, inclusive, at baseline was classified as moderate, and a baseline Mayo score of 9–12, inclusive, as severe. For patients with CD, a baseline CDAI score of ≥220 to 330 or >330 to 450 was classified as moderate or severe CD, respectively. Percentage values (with 95% CIs) were calculated for patients achieving SF or RB improvement each week, overall and in each subgroup. Percentage values were also used to show change in AP severity over induction, by subgroup and also separately for patients reporting severe, moderate, mild or no pain at baseline.
Further subgroup analyses were conducted to evaluate the impact of baseline concomitant CS use on PROs and to investigate improvements for patients in the highest quartile of SF at baseline when compared with those in the other quartiles. Logistic regression analyses were conducted to investigate the characteristics of patients who were early responders (patients achieving SF improvement by week 3). Variables entered in the model were chosen based on their clinical interest and included: gender, age (continuous), smoking status (never smoker vs. current/ex-smoker), geographic region (non-Asia vs. Asia), BMI (continuous), CS use at baseline (yes or no) and prior anti-TNFα treatment failure (yes or no). A backward selection was applied, with a P value cutoff threshold to stay in the model set at 0.25.
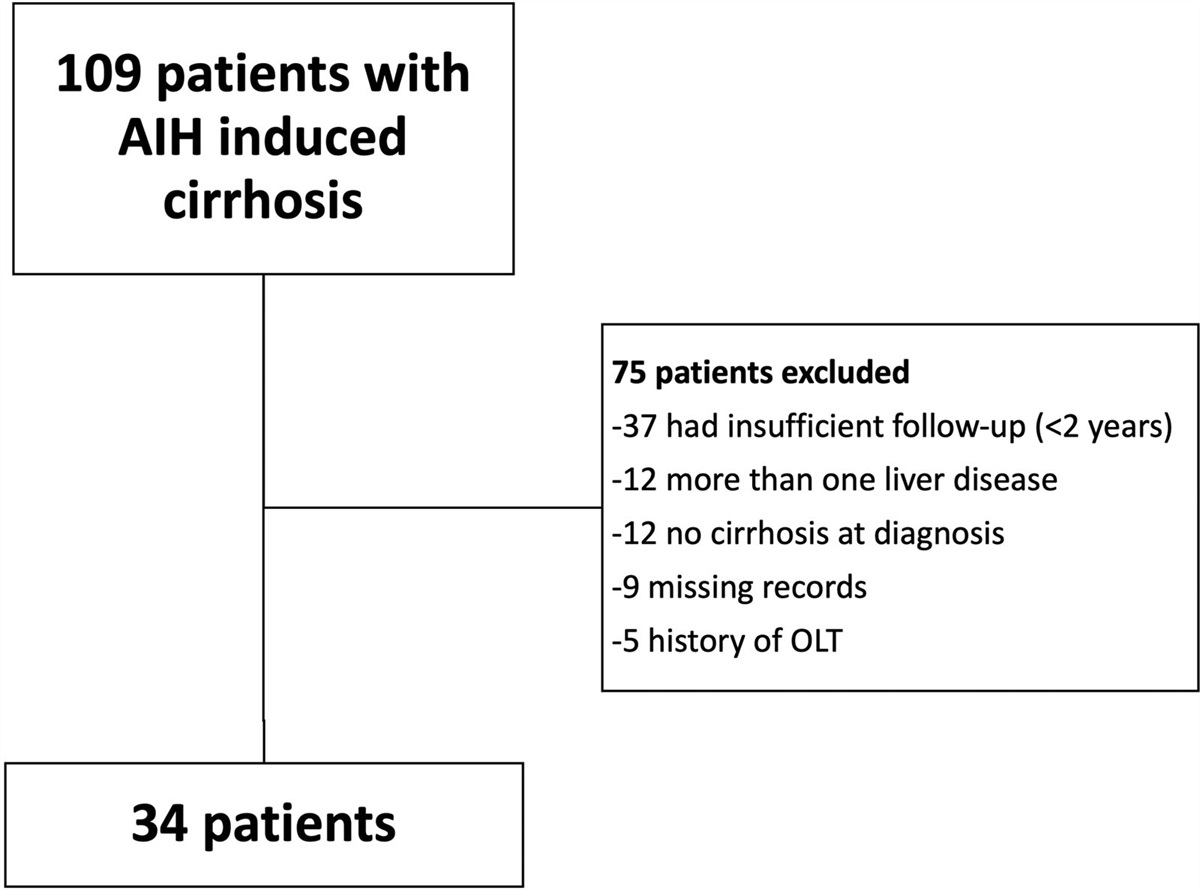
Results Study populationThis post hoc analysis included data from 994 patients (383 with UC from VISIBLE 1 and 611 with CD from VISIBLE 2) who received at least one IV dose of vedolizumab at induction (FAS-I population), and had available PRO data (33 patients from VISIBLE 2 did not have PRO data available for this analysis; the numbers of patients providing PRO data at each time point are indicated in Figs. 1–6) [22,23]. Disease characteristics were as expected for patients with moderate to severe disease (Tables 1 and 2). At baseline, patients with UC had a mean ± SD disease duration of 7.5 ± 6.6 years, 39.4% had a disease duration of ≥7 years and 7.3% were current smokers. Overall, 61.6% of the UC patient cohort had severe disease (Mayo score of 9–12) at baseline, 38.1% had moderate disease (Mayo score of 6–8), and one patient (0.3%) had mild disease (Mayo score of <6) included for analysis purposes in the subgroup of patients with moderate UC at baseline. Anti-TNFα-naive patients constituted 56.4% (n = 216) of the UC patient population. Patients with CD had a mean ± SD disease duration of 9.0 ± 8.1 years, 50.1% had a disease duration of ≥7 years, and 19.5% were current smokers. Overall, 62.7% of the CD patient cohort had moderate disease (baseline CDAI score of ≥220 to 330), 37.3% had severe disease (baseline CDAI score of >330 to 450), and 42.7% (n = 261) were anti-TNFα naive. Approximately one-third of patients with UC or CD from the VISIBLE studies had received prior CS treatment, and 163 patients with UC and 210 with CD had ongoing CS treatment at baseline.
Table 1. - Baseline demographics and disease characteristics: Patients with UC from VISIBLE 1 Parameter Anti-TNFα naiveSF scoring: normal stool frequency = 0; 1–2 stools more than normal = 1; 3–4 stools more than normal = 2; and ≥5 stools more than normal = 3. RB scoring: no blood = 0; visible blood with stool <50% of the time = 1; visible blood with stool ≥50% of the time = 2; and blood passes alone = 3. Some patients had missing data for fecal calprotectin concentration, in these instances the number of patients contributing data (N number) is indicated in labeled footnotes.
aN = 211.
bN = 164.
cN = 375.
Anti-TNFα, antitumor necrosis factor alpha; IQR, interquartile range; RB, rectal bleeding subscore from the Mayo score; SF, stool frequency subscore from the Mayo score; UC, ulcerative colitis.
AP severity scale: no pain = 0; mild pain = 1; moderate pain = 2; and severe pain = 3. SF is the actual number of liquid or very soft stools per day. Some patients had missing data for duration of CD and fecal calprotectin concentration parameters, in these instances the number of patients contributing data (N number) is indicated in labeled footnotes.
Anti-TNFα, antitumor necrosis factor alpha; AP, abdominal pain; CD, Crohn’s disease; CDAI, Crohn’s disease activity index; CRP, C-reactive protein; IQR, interquartile range; PRO2, composite endpoint of abdominal pain and stool frequency; SF, stool frequency.
aN = 260.
bN = 610.
cN = 258.
dN = 348.
eN = 606.
 Fig. 1.:
 Patient-reported UC symptoms during vedolizumab intravenous induction: weekly mean changes from baseline. SF subscores: (a) overall population, anti-TNFα-naive patients and anti-TNFα-experienced patients; and (b) overall population and patients with moderate or severe disease at baseline. RB subscores: (c) overall population, anti-TNFα-naive patients and anti-TNFα-experienced patients; and (d) overall population and patients with moderate or severe disease at baseline. Error bars indicate positive or negative SDs of the mean values. Anti-TNFα, antitumor necrosis factor alpha; RB, rectal bleeding; SF, stool frequency; UC, ulcerative colitis.
 Fig. 2.:
 UC symptom improvement during vedolizumab intravenous induction. SF improvement in patients with UC: (a) overall population, anti-TNFα-naive patients; and anti-TNFα-experienced patients and (b) overall population and patients with moderate or severe disease at baseline. RB improvement in patients with UC: (c) overall population, anti-TNFα-naive patients and anti-TNFα-experienced patients; and (d) overall population and patients with moderate or severe disease at baseline. SF improvement was defined as a Mayo SF subscore of 0. RB improvement was defined as a reduction of ≥1 (on the 4-point RB subscore from the Mayo score, where no blood = 0; visible blood with stool <50% of the time = 1; visible blood with stool ≥50% of the time = 2; and blood passes alone = 3) for the mean RB subscore of 7 days. aOne patient with UC had a baseline Mayo score of <6. Anti-TNFα, antitumor necrosis factor alpha; CI, confidence interval; RB, rectal bleeding; SF, stool frequency; UC, ulcerative colitis.
 Fig. 3.:
 Patient-reported CD symptoms during vedolizumab intravenous induction: weekly mean changes from baseline. SF: (a) overall population, anti-TNFα-naive patients and anti-TNFα-experienced patients; and (b) overall population and patients with moderate or severe disease at baseline. AP: (c) overall population, anti-TNFα-naive patients and anti-TNFα-experienced patients; and (d) overall population and patients with moderate or severe disease at baseline. Data are from mean weekly patient-reported SF and AP (error bars indicate negative SDs of the mean values), where SF was the number of liquid or very soft stools per day and AP severity was rated as no pain = 0; mild pain = 1; moderate pain = 2; and severe pain = 3. Anti-TNFα, antitumor necrosis factor alpha; AP, abdominal pain; CD, Crohn’s disease; CDAI, Crohn’s disease activity index; SF, stool frequency.
 Fig. 4.:
 CD symptom improvement during vedolizumab intravenous induction. SF improvement in patients with CD: (a) overall population, anti-TNFα-naive patients and anti-TNFα-experienced patients; and (b) overall population and patients with moderate or severe disease at baseline. AP: (c) overall population; (d) patients with moderate disease at baseline; and (e) patients with severe AP at baseline. Data are from mean weekly patient-reported SF and AP, where SF was the number of liquid or very soft stools per day. SF improvement was defined as a reduction of at least three stools for the mean of 7 days. AP severity was rated as no pain = 0; mild pain = 1; moderate pain = 2; and severe pain = 3. Anti-TNFα, antitumor necrosis factor alpha; AP, abdominal pain; CD, Crohn’s disease; CDAI, Crohn’s disease activity index; CI, confidence interval; SF, stool frequency.
 Fig. 5.:
 Patient-reported clinical remission during vedolizumab intravenous induction in patients with UC. (a) Overall population, anti-TNFα-naive patients and anti-TNFα-experienced patients; and (b) overall population and patients with moderate or severe disease at baseline. Patient-reported clinical remission in UC was defined as a Mayo stool frequency subscore of 0 and a rectal bleeding subscore of 0. aOne patient with UC had a baseline Mayo score of <6. Anti-TNFα, antitumor necrosis factor alpha; CI, confidence interval; UC, ulcerative colitis.
 Fig. 6.:
 Patient-reported clinical remission during vedolizumab intravenous induction in patients with CD. (a) Overall population, anti-TNFα-naive patients and anti-TNFα-experienced patients; and (b) overall population and patients with moderate or severe disease at baseline. Patient-reported clinical remission in CD was defined as a PRO2 (endpoint comprising the sum of abdominal pain and stool frequency) of ≤8. Anti-TNFα, antitumor necrosis factor alpha; CD, Crohn’s disease; CDAI, Crohn’s disease activity index; CI, confidence interval; PRO2, patient-reported outcome 2 composite score.
Weekly patient-reported symptoms Patients with UCMean SF and RB subscores declined steadily from baseline to week 6 (Fig. 1). The mean ± SD SF subscore was reduced from 2.3 ± 0.7 at baseline to 2.0 ± 0.8 at week 1 and decreased further week-on-week to 1.4 ± 1.0 by week 6. The mean ± SD RB subscore was reduced from 1.6 ± 0.7 at baseline to 0.6 ± 0.8 by week 6, with reductions already seen after week 1. The decline in SF and RB symptom subscores week-on-week from baseline to week 6 was observed consistently across the patient subgroups analyzed, in anti-TNFα-naive and anti-TNFα-experienced patients (Fig. 1a and c) and in patients with moderate or severe disease at baseline (Fig. 1b and d).
In anti-TNFα-naive patients and those with severe UC at baseline, mean SF subscores had declined by 1.0 point from baseline to week 6. Mean ± SD change from baseline was 0.8 ± 0.9 points for anti-TNFα-experienced patients and patients with moderate UC and 0.9 ± 0.9 points for the overall population (Fig. 1a and b). By week 2, 6.6% of patients overall, 11.6% with moderate UC and 7.9% in the subgroup of anti-TNFα-naive patients reported SF improvement (SF subscore of 0 or normal SF), rising to 17.5%, 26.6% and 21.1% by week 6 in these patient groups, respectively. By week 6, 11.8% of patients in the subgroup with severe disease and 12.9% of anti-TNFα-experienced patients had achieved SF improvement or normal SF (Fig. 2a and b).
Reductions in mean ± SD RB subscores from baseline to week 6 were 1.0 ± 0.8, 1.0 ± 0.8 and 0.9 ± 0.9 points in the overall population, the anti-TNFα-naive subgroup and the anti-TNFα-experienced subgroup, respectively (Fig. 1c). At week 6, patients with severe disease reported a mean ± SD reduction of 1.1 ± 0.8 points from baseline; the corresponding decrease was 0.8 ± 0.7 for patients with moderate disease (Fig. 1d). By week 2, 21.8% of patients overall, 32.2% of the subgroup with moderate UC and 15.3% in the severe disease subgroup reported an improvement in RB symptoms (a reduction of ≥1 [on the 4-point scale] for the mean RB subscore of 7 days) (Fig. 2c and d). At the end of induction, 44.9% of the overall population, over half (52.4%) of the patients with moderate disease and 40.2% of the subgroup with severe disease had achieved RB improvement (Fig. 2d). The proportions achieving RB improvement after induction at week 6 were similar for anti-TNFα-naive and anti-TNFα-experienced patients (45.9% and 43.6%, respectively) (Fig. 2c).
Patients with CDMean SF, AP and PRO2 scores declined each week from baseline to week 6 of vedolizumab IV induction (Fig. 3 and Supplementary Fig. 1, supplemental digital content 2, https://links.lww.com/EJGH/A997). Week-on-week reductions in these PROs from baseline were observed consistently across patient subgroups separated by prior anti-TNFα treatment experience (Fig. 3a and c) and by baseline disease severity (moderate or severe) (Fig. 3b and d).
Mean ± SD SF declined by 2.1 ± 2.3 liquid or very soft stools per day from baseline in the overall population, from a mean ± SD of 5.5 ± 2.7 at baseline to 3.4 ± 2.6 at week 6. The largest SF reductions at week 6 were reported for the patient subgroup with severe CD at baseline (mean ± SD reduction of 2.7 ± 2.6), and the subgroup of anti-TNFα-naive patients (mean ± SD reduction of 2.3 ± 2.4). By week 6, SF was also reduced from baseline in anti-TNFα-experienced patients and those with moderate CD (Fig. 3a and b). SF changes across patient subgroups indicate reductions from baseline were more pronounced in patients with severe disease and those who were anti-TNFα naive. By week 2, SF improvement (a reduction of at least three stools for the mean of 7 days) was reported by 13.0% of patients overall and 20.3% in the subgroup with severe CD compared with 8.7% with moderate CD at baseline (Fig. 4). Also, 13.5% and 12.6% in the subgroups of anti-TNFα-naive and -experienced patients, respectively, achieved SF improvement by week 2 (Fig. 4a). At week 6, 31.5% of the overall population and 42.7% of patients with severe CD achieved SF improvement compared with 24.8% of the subgroup with moderate disease (Fig. 4b). The proportion of anti-TNFα-naive patients who achieved SF improvement (34.2%) was also numerically greater than that of anti-TNFα-experienced patients (29.5%) (Fig. 4a).
Mean ± SD AP scores were reduced weekly from 2.0 ± 0.5 at baseline to 1.2 ± 0.7 at week 6 in the overall population (Fig. 3c and d). Mean reductions in baseline AP scores at week 6 were similar in anti-TNFα-naive and -experienced patients and appeared greater in the subgroup of patients with severe CD. The proportion of patients reporting moderate or severe AP decreased from baseline to week 6 (Fig. 4c). For most patients rating AP as moderate or severe at baseline (61.5% and 14.6%, respectively, compared with 21.9%/2.0% for mild/no AP), AP severity ratings had improved after vedolizumab IV induction at week 6 (moderate/severe AP, 28.5%/5.1%; mild/no AP, 43.9%/22.4%) (Fig. 4d). In the subgroup with severe AP at baseline (n = 89), approximately four in five patients rated their pain as nonsevere by week 6, with 14.6% reporting no pain (Fig. 4e).
Mean ± SD PRO2 scores declined weekly from 20.9 ± 5.9 at baseline to 12.8 ± 7.4 at week 6, corresponding to a mean ± SD reduction of 8.1 ± 7.3 points (Supplementary Fig. 1, supplemental digital content 2, https://links.lww.com/EJGH/A997). Patients in the subgroup with severe CD had mean ± SD reductions from baseline to week 6 of 10.0 ± 7.9 for this composite endpoint, compared with reductions of 7.1 ± 6.7 for the moderate disease subgroup. Mean changes from baseline to week 6 in weekly PRO2 scores were similar for anti-TNFα-naive and -experienced patients during induction.
Patient-reported clinical remission ratesAt week 6, the overall proportion of patients with UC in patient-reported clinical remission (SF subscore of 0; RB subscore of 0) was 15.9%; the proportion of patients in remission was numerically higher in the subgroup of anti-TNFα-naive (18.7%) patients vs. anti-TNFα experienced (12.3%) and in those with moderate (24.5%) vs. severe (10.5%) disease at baseline (Fig. 5a and b). The proportion of patients with CD in patient-reported clinical remission (PRO2 score of ≤8, corresponding to a CDAI score of <150) at week 6 after vedolizumab IV induction was 28.5% for the overall population (31.5% and 26.4% for anti-TNFα-naive and -experienced subgroups, respectively) (Fig. 6a). Contrasting with the data on SF improvement, patients with moderate CD at baseline had numerically higher rates of patient-reported clinical remission (34.6%) compared with those with severe disease (18.5%) (Fig. 6b).
Analyses of predictors of PRO responsesUnivariate analyses were conducted to evaluate the impact of patient characteristics on PROs and the early onset of PRO responses. An analysis of PRO measures during vedolizumab IV induction in patient subgroups with or without ongoing CS therapy at baseline indicated that this variable had no impact on any of the patient-reported UC and CD symptom improvements analyzed. In UC, of the patients with (n = 163) or without (n = 220) ongoing CS at baseline, 14.8% (24/162) and 19.5% (41/210), respectively, achieved SF improvement at week 6, and 42.6% (69/162) and 46.7% (98/210), respectively, achieved RB improvement at week 6. The proportions of patients with CD achieving SF improvement at week 6 for the groups with (n = 210) or without (n = 401) ongoing CS at baseline were 32.2% (67/208) and 31.2% (124/398), respectively. For AP severity, the proportions of patients rating AP as severe, moderate, mild or none at baseline and week 6 were similar for patients with or without baseline CS treatment.
There were some differences to note for week 6 improvements in PROs achieved by patients in the upper quartile of SF at baseline vs. the remaining patients. Patients with CD in the highest SF quartile at baseline (n = 154; 66.9% with severe CD at baseline and 54.5% with a disease duration of ≥7 years) were compared with those in the other three quartiles (n = 457; 27.4% had severe CD at baseline and 48.6% had a disease duration of ≥7 years). In line with SF improvement data analyzed using CDAI-determined disease severity at baseline, 59.2% (90/152) of patients in the upper SF quartile achieved SF improvement at week 6 compared with 22.2% (101/454) of patients in the other three quartiles. AP severity ratings appeared comparable between the upper SF quartile and the other SF quartiles. For patients with UC in the upper SF quartile at baseline (n = 102; 90.2% with severe disease and 38.2% with a disease duration of ≥7 years) vs. other quartiles (n = 281; 51.2% with severe disease at baseline and 39.9% with a disease duration of ≥7 years), SF improved for 11.2% (11/98) in the upper quartile vs. 19.7% (54/274) of remaining patients. This is reflective of the data on SF improveme
留言 (0)