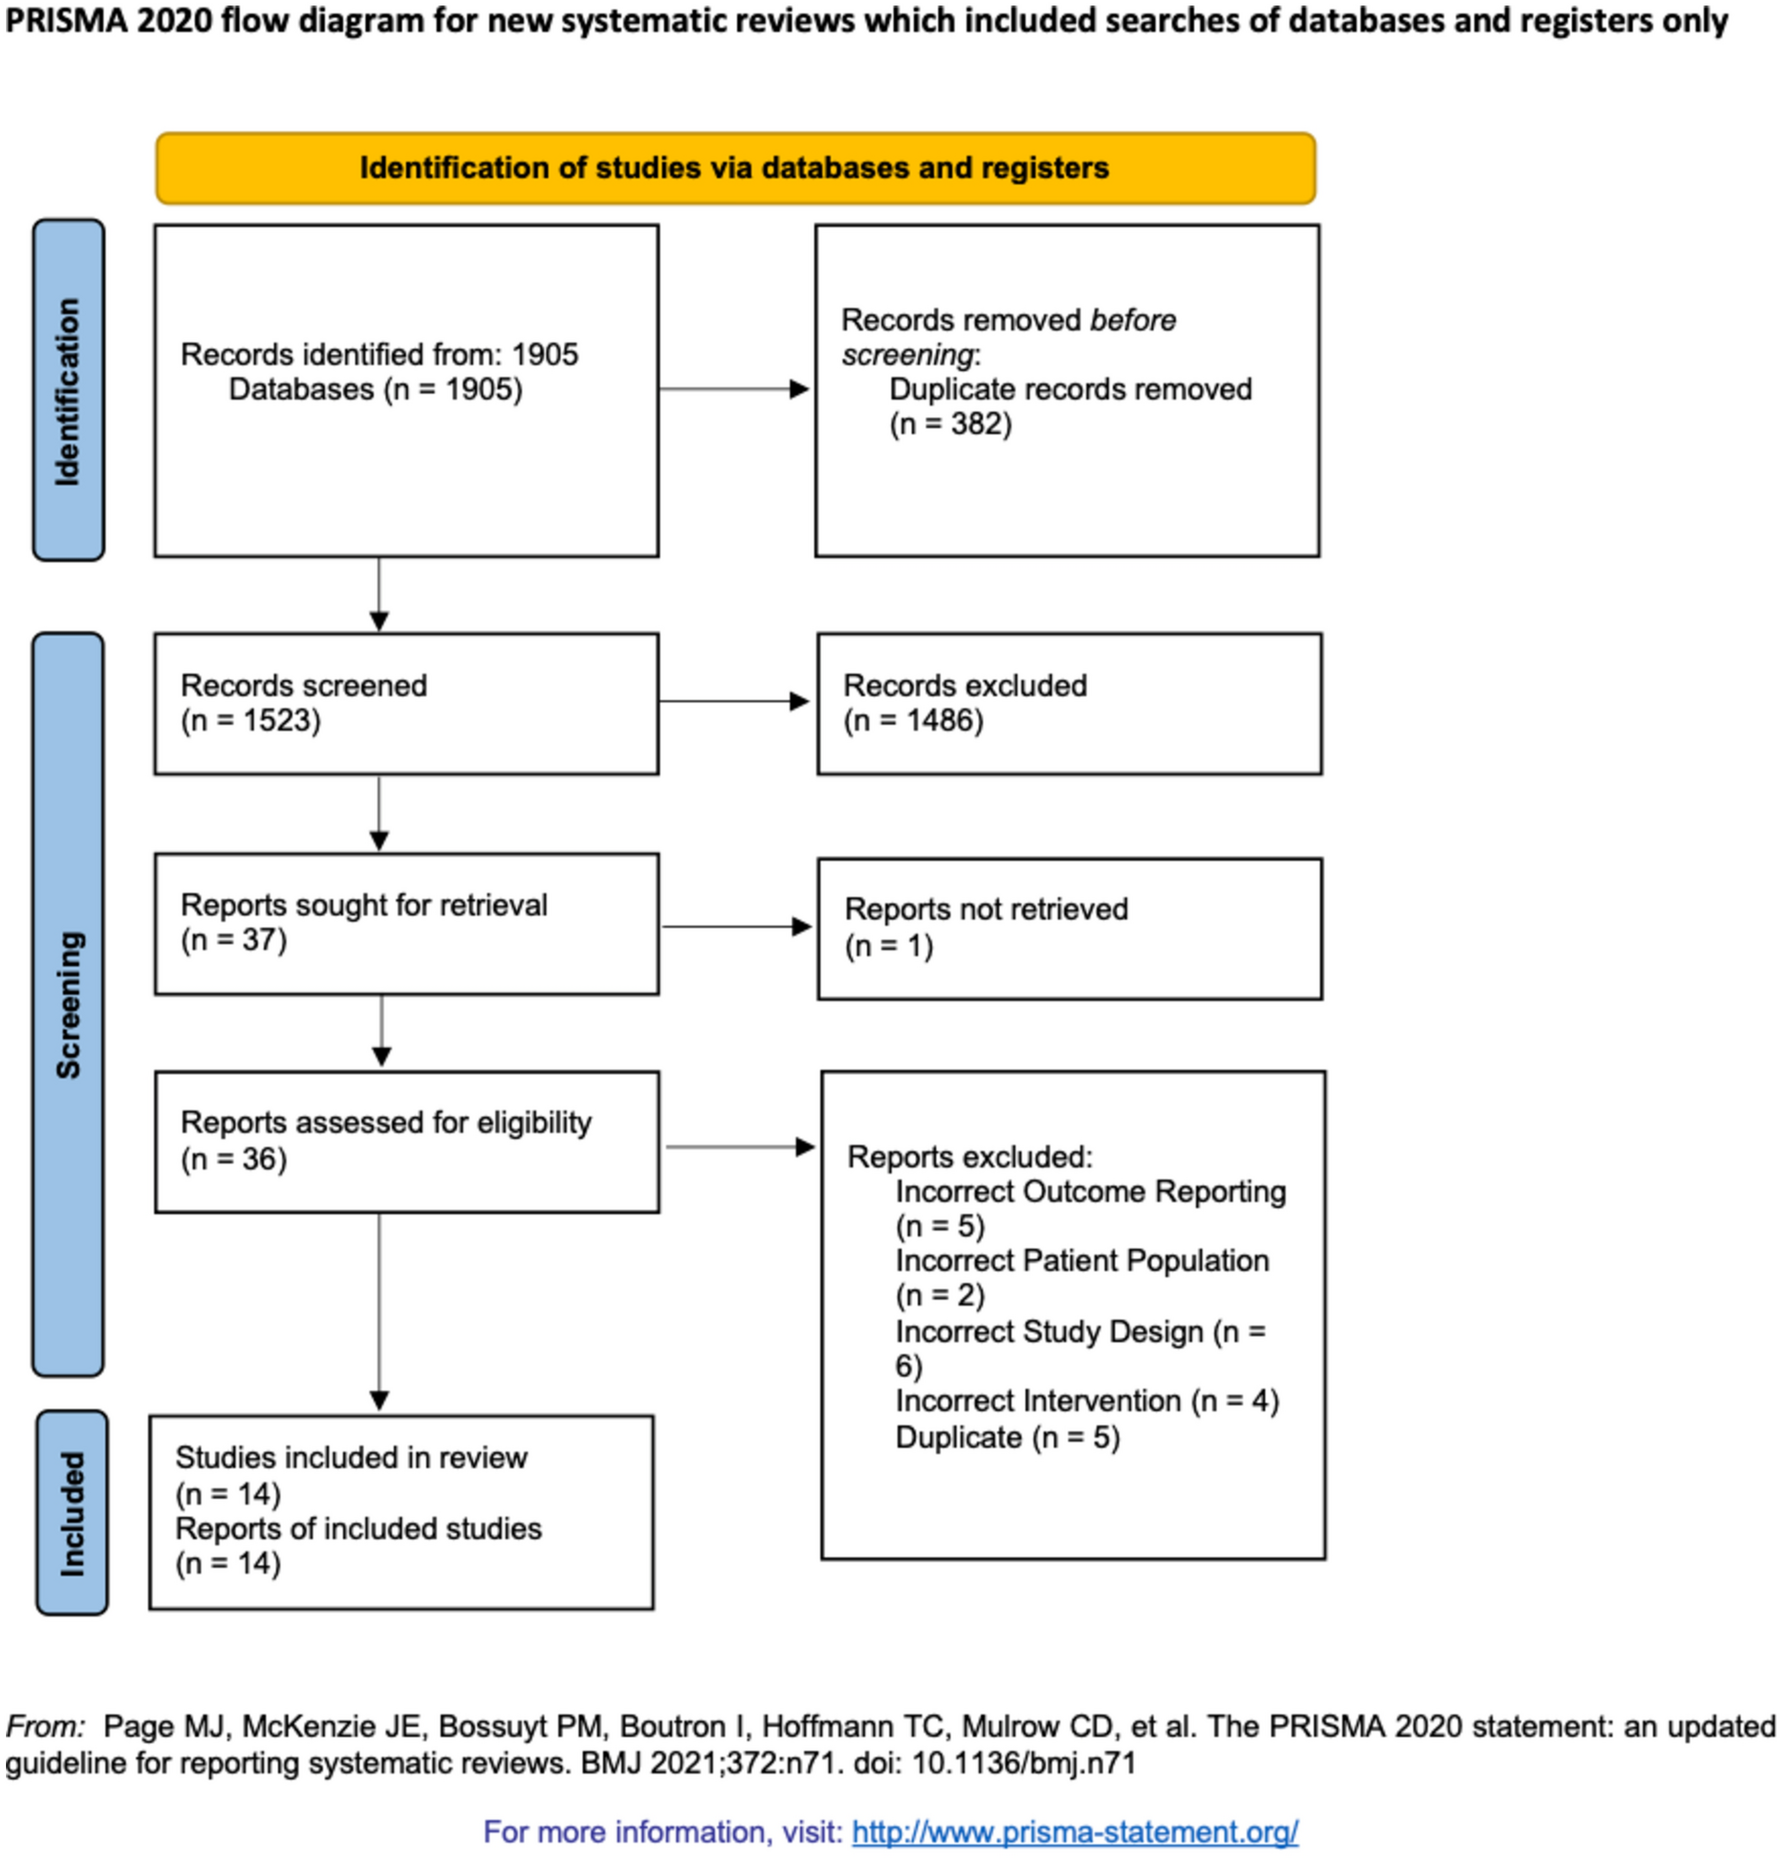
We followed the Preferred Reporting Items for Systematic Reviews and Meta-analysis (PRISMA) guidelines.
Eligibility criteria
We included randomized, double-blind, placebo-controlled clinical trials (RCTs) in men and nonpregnant women aged 18 years or older scheduled to undergo excisional hemorrhoidectomy. Patients were excluded if they received less than 133 mg LB (previous studies have not demonstrated efficacy with lower doses) [6, 7]. Additionally, we excluded patients who took analgesics (non-steroidal anti-inflammatory drugs, acetaminophen, or opioids), antidepressants, or glucocorticoids within the 3 days before surgery. Studies with fewer than 20 participants were excluded.
The primary outcome of interest was a pain score at 72 h. Secondary outcomes were time to first opioid, the dose of rescue medication over 72 h, and adverse effects (AE).
Data sources and searches
A comprehensive search of several databases was conducted from inception until August 2022. The databases included were Ovid MEDLINE and Epub Ahead of Print, CINAHL, Ovid EMBASE, Ovid Cochrane Central Register of Controlled Trials, Ovid Cochrane Database of Systematic Reviews, Scopus, and Web of Science—searched Science Citation Index (SCI), Conference Proceedings Citation Index (CPCI), and BIOSIS Citation Index (BCI). The search strategy was designed and conducted by an experienced librarian with input from the study’s principal investigator. Controlled vocabulary supplemented with keywords was used to search for studies of liposomal bupivacaine for hemorrhoidectomy (Supplementary eMethods https://github.com/NotLui5/liposomal-bupivacaine_others).
Study selection
Search records were uploaded into Covidence systematic review software, Veritas Health Innovation, Melbourne, Australia. All stages of the review (title and abstract screen, full-text screen, and data extraction) were duplicated by three independent reviewers (PS-P, KO, KL, LF). Before beginning each stage, pilots were performed to understand and accurately understand the eligibility criteria. Disagreements at each stage of the review were resolved by the senior author (YN). Full-text screening agreement was assessed using Cohen’s kappa (κ = 0.85).
Data collection
The following data were extracted: (1) general characteristics (first author, publication date, country, study design, data collection period); (2) setting (single-center, multicenter); (3) preoperative characteristics (age and sex); (4) primary outcomes (pain relief) was assessed by the cumulative pain score as reflected in the pain intensity at rest measured using a validated 10-point numeric rating scale (NRS; 0 = no pain and 10 = worst possible pain) area under the curve through 72 h after study drug administration (AUC 0–72).
Secondary outcomes were the total amount (milligrams) of opioid rescue medication consumed within 72 h after surgery, the time to first postsurgical use of opioid rescue medication, and adverse effects (AE). Adverse effects were defined as any AE occurring after administration of the study drug. All AEs were classified by system organ class and summarized by treatment group.
Risk of bias assessment
Study quality was assessed by three independent reviewers (PS-P, KO, KL). Disagreements were resolved through consensus by including two reviewers (YN, PS-P). To determine the risk of bias in RCTs, we used the RoB2 Cochrane tool. The domains of this tool are (1) the randomization process; (2) deviations from intended interventions; (3) missing outcome data; (4) measurement of the outcome; and (5) selection of the reported result. Each question had four possible responses: “yes,” “probably yes,” “probably no,” “no,” and “no information.” For a better understanding, “definitively yes” was interpreted as a low risk of bias, “probably yes” and “probably no” as unclear, and “definitively no” as a high risk of bias.
The overall risk of bias was calculated on the basis of the responses to each of the five domains. Studies with at least one domain considered as a “high risk of bias” or with multiple domains considered as “some concerns” in a way that substantially lowers confidence in the result were judged to be at a high overall risk of bias; studies with at least one domain at “some concerns” were considered to be at some concerns the overall risk of bias. Those studies with all domains classified as “low risk of bias” without any “some concerns” or “high risk of bias” domains were at a low overall risk of bias. This approach has been used before.
Certainty in the body of evidence
The quality or certainty of the evidence was assessed with the Grading of Recommendations Assessment, Development, and Evaluation (GRADE) approach [8]. This assessment reflects the confidence level that the effect sizes or estimates from this systematic review and meta-analysis are correct.
Working individually, one reviewer (PS-P) assessed the quality of evidence, and disagreements were resolved by consensus involving a second reviewer (YN). Overall, the quality of the evidence of each treatment-comparison-outcome triad can be graded as very low, low, moderate, and high. To assign these, we began by rating randomized trials as high-quality and observational studies as low-quality evidence. Then, on the basis of different factors, we either downgraded (risk of bias, inconsistency, indirectness, imprecision, and publication bias) or upgraded (large magnitude of effect, plausible confounding, and dose–response gradient) the initial rating.
Statistical analyses
We calculated each study’s odd ratio (OR) and 95% confidence interval (CI) using an intention-to-treat analysis approach for dichotomous outcomes. Continuous variables, such as pain score and opioid requirement, were expressed as mean and standard deviation. Fisher’s exact test was used to compare between-group differences.
We used RStudio, an integrated development environment for R [9], to perform the analyses and generate forest plots. Heterogeneity across studies was assessed with a study variance estimate (tau squared). The proportion of variability in effect size estimates attributed to between-study heterogeneity was assessed with the I2 statistic [10].


留言 (0)