
記住我


In 1989, the Extracorporeal Life Support Organization (ELSO) and its Registry were launched by pioneers of extracorporeal membrane oxygenation (ECMO). Since its creation, more than 200,000 patients have received ECMO for refractory respiratory failure, cardiac failure, or both, and more than 100,000 survivors have been discharged alive from ELSO centers.1 Those patients’ data have contributed to more than 300 peer-reviewed publications from the ELSO Registry.2,3
Over the years, scientific research has progressed in ECMO for respiratory failure,4–10 cardiogenic shock,11–14 and refractory cardiac arrest,15–18 and the registry has evolved in data collection and quality assurance. The 2022 ELSO Registry Report characterizes adjunctive therapy use, support mode, complications, and mortality for ECMO-supported patients submitted from 2009 through December 31, 2022. The previous Registry report reported data from inception through year-end of 2015. This report utilizes data from the start of 2009, which is a significant year both because it is when the 2009 Influenza A (H1N1) pandemic drove a dramatic increase in adult venovenous (VV) ECMO use,19 and also when new ECMO technology using oxygenators made with hollow fiber polymethylpentene (PMP) and centrifugal pumps came to market, which increased safety and efficacy of the ECMO circuit.
MethodsData are de-identified upon release, are not considered human subjects research, and are exempt from Institutional Review Board review. The data analyzed were obtained from the ELSO Registry, including the Cardiac Addendum and the ECPR Addendum. We included all ECMO runs that began on or after January 1, 2009, were completed by December 31, 2022, and were submitted to the ELSO registry by April 18, 2023. The ELSO Registry records unique ECMO runs and patients; patient-level outcomes are reported at the patient level, and ECMO run-level outcomes are reported at the ECMO run level. Patients are categorized both by age and by support type. The age categories are neonatal: birth–28 days, pediatric: 29 days–17 years, adult: ≥18 years. Support types are respiratory, cardiac, and extracorporeal cardiopulmonary resuscitation (ECPR).20 Support modes include venoarterial (VA), VV, and less commonly utilized modes, including venovenoarterial (VVA) and venopulmonary (VP). These terms are defined in detail previously.20,21
Data Quality AssuranceELSO site managers receive detailed instructions and definitions on data entry. Data definitions and entry instructions are publicly available.22 Since 2019, data managers must pass data entry examinations to submit data to the registry. Accuracy is checked through an assessment at point-of-entry into the database, including data value hard limits. Once data entry is completed, full record validation is performed to ensure mandatory data fields are complete.23
Original ELSO Registry data elements have been previously described1 and include patient demographics; patient hemodynamics on ECMO, ventilator settings, and blood gas values before ECMO and at 24 hours after ECMO initiation; pre-ECMO support including hemodynamic support devices and select medications; International Classification of Disease (ICD) coded diagnoses; Common Procedural Terminology (CPT) coded procedures; complications; hospital admission and discharge; intubation and extubation; vital status at hospital discharge; and disposition location.
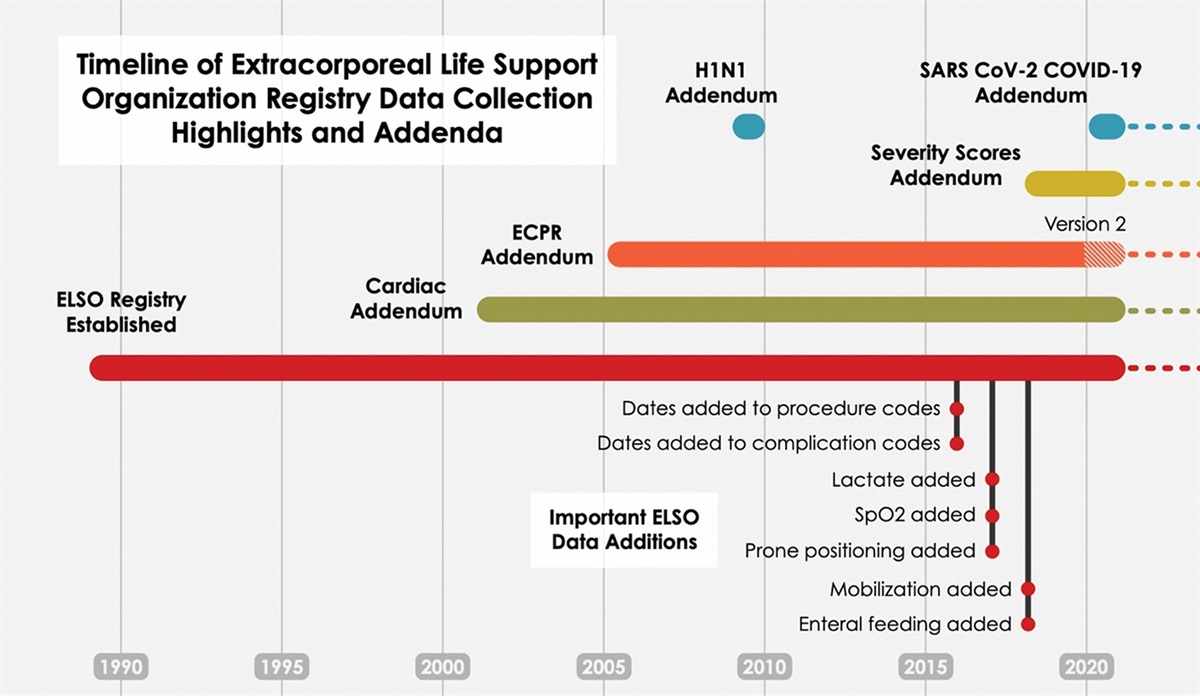
New data elements have been added to the main Registry with Addenda (Figure 1). These newer data elements include dates and times of procedures and complications, additional support measures, cannula sizes, postcannulation management, outcomes, and condition-specific addenda. Addenda were created or updated for patients with COVID-19, trauma, cardiac ECMO, and ECPR.30–32 Complications definitions can be found in the eMethods https://links.lww.com/ASAIO/B185.
 Figure 1.: Timeline of the Extracorporeal Life Support Organization registry data collection highlights and addenda. New data elements have been added to the main registry and with addenda. These newer data elements include dates and times of procedures and complications, level of mobilization during ECMO,24 the use of prone positioning before ECMO,25 and ICU type.26 Mobilization on ECMO was defined as score of >0 on the ICU mobility scale (IMS),24 which indicates active or active assisted exercise, such as rolling, bridging or cycle ergometry, or greater. A score of 0 is passive activity/movement. The cardiac addendum contains additional diagnostic, procedural, and echocardiographic data, as well as indications for support, postoperative and cardiac function.27 Version 1 was designed for neonates and children, a revised cardiac addendum (Version 2) appropriate for adults, will be released in 2023. The ECPR addendum (Version 1) began in 200527 and was revised in January 2020 (Version 2) and now contains precipitating and antecedent events, comorbid conditions, arrest and cannulation location, subsequent intra-arrest management, initial arrest rhythms, details on post arrest clinical management28,29 and neurologic outcomes. ELSO began collecting data specific to the ECMO care of patients with SARS-CoV-2 in early 2020.30–32 Dates and times of procedures and complications were added September 15, 2016. Lactate (worst value) was added January 1, 2017, and then transitioned to pre-ECMO value (as defined for other pre-ECMO variables) January 15, 2018. SpO2 was added January 15, 2017. Prone positioning was added December 1, 2017. Mobilization and enteral feeding data were added January 15, 2018.Statistical Analysis
Data are presented descriptively as counts and percent, median and interquartile range (IQR) stratified by year, group, or level. Missing values were excluded before calculating descriptive statistics (unless otherwise noted), and counts of missing values are provided, where applicable.
We report in-hospital mortality at the ELSO center and mortality within 24 hours of ECMO decannulation (eMethods, https://links.lww.com/ASAIO/B185). Complication rates were defined as the sum of all reported instances of each complication code across all runs divided by the sum of ECMO durations across all runs. These rates were calculated based only on runs completed on or after 2017, corresponding to the first full year in which multiple instances of a complication code per run could be reported in the ELSO registry. Some complication codes were combined to calculate a single rate, as detailed in the Supplement. Mobility on ECMO was defined as an ICU Mobility Score >0,24 and was only collected for patients ≥8 years of age, beginning in 2018. Functional outcomes after ECPR were recorded for pediatric patients using the Pediatric Cerebral Performance Category (PCPC) score (range: 1––normal; 6––brain death),33 and for adults using the Cerebral Performance Category (CPC) score (range: 1––normal; 5––brain death).34 Prone positioning data are reported from 2019 to 2022 to evaluate positioning before and after COVID.
Structure, Process, and OutcomesWe present our results within the framework of Registry Structure, Process Measures, and Clinical Outcomes.
Results Registry Structure Overall trendsFrom 2009 to 2022, 154,568 ECMO runs were entered into the ELSO Registry (108,265 adult, 25,739 pediatric, and 20,564 neonatal). These patients were distributed across centers that cared for neonatal, pediatric, and adult patients, or a combination. Since its inception in 1989, 780 unique centers have entered data at some point. The growth in ECMO utilization is predominantly adult, increasing from 851 (2009) to 17,975 (2021) (Figure 2). Pediatric ECMO runs have doubled from 1,154 (2009) to 2,394 (2021), and neonatal runs were relatively unchanged between 2009 and 2021 (1,258 and 1,527, respectively).
 Figure 2.:
 Runs over time by age group. Y2-axis shows the number of runs over time by age group (colors), using data from 2009 to 2022 (inclusive). Run counts are indicated in the figure for color (age group) for the first and last years of the chart for reference. Y1-axis shows the number of centers (orange line with box counts in 2009 and 2022). Run counts in 2009 for adult age group: 850. Run counts in 2021: neonatal: 1,527; pediatric: 2,394; adult: 17,975.
Center growthThe ELSO Registry is international, with 57 countries reporting data in 2022. The ELSO regions North America, Asia-Pacific, Latin American, and South and West Asian regions have grown in numbers of centers and runs (Figure 3). From 2009 to 2022, the median annual ELSO center adult patient volume has increased from 4 [IQR, 1–12] to 15 [6–36] patients (Figure 4). For neonates and pediatric patients, the median annual center volume has decreased from 12 [6–23] in 2009 and 7 [2–17] in 2022 over the same period. From 2009 to 2022, neonatal and pediatric ECMO cases have become more centralized, with the top 50% of centers (ranked by their annual volume) accounting for 90% of the cases in 2022 (Figure S1, https://links.lww.com/ASAIO/B185).
 Figure 3.:
 Run count by region over time. Number of runs over time by ELSO chapter (colors), using data from 2009 to 2022 (inclusive). Boxed numbers indicate runs counts for years 2009 and 2022 for visual reference according to color (ELSO Chapter). Run counts in 2009: North American: 2,300; European: 529; Asia-Pacific: 381; Latin American: 45; South and West Asian: 7. Run counts in 2021: North American: 15,430; European: 3,390; Asia-Pacific: 1,542; Latin American: 707; South and West Asian: 827. Run counts in 2022: North American: 12,587; European: 2,248; Asia-Pacific: 959; Latin American: 470; South and West Asian: 539. Center counts in 2009: North American: 124; European: 24; Asia-Pacific: 13; Latin American: 4; South and West Asian: 1. Center counts in 2021: North American: 350; European: 108; Asia-Pacific: 57; Latin American: 45; South and West Asian: 31. Center counts in 2022: North American: 352; European: 107; Asia-Pacific: 43; Latin American: 32; South and West Asian: 31.
 Figure 4.:
 Center-level volume over time, log scale. Distribution of annual center-level volume (log2-scale) over time by age group (colors). Boxes cover the middle 50% and whiskers cover the middle 80%. Center volume for neonatal/pediatric centers: 2009: median 12, interquartile range (IQR) 6, 23; 2021: 8 (2, 18.5); 2022: 7 (2, 17); Center volume for adult centers: 2009: 4 (1, 12); 2021: 20 (7, 48); 2022: 15 (6, 36).
Intensive care unit (ICU) patient distributionECMO in neonatal intensive care units is dominated by neonatal respiratory ECMO (79%, 2,205/2,797) (Table S1, https://links.lww.com/ASAIO/B185). Pediatric ICUs care for a diversity of ECMO support and age groups, including 80% (3,040/3,790) of pediatric respiratory ECMO, 38% (1,445/3,850) of neonatal respiratory ECMO, 86% (4,875/5,659) of pediatric cardiac ECMO, 79% (2,295/2,901) of neonatal cardiac ECMO, and 86% (2,310/2,694) of pediatric ECPR runs. Adult cardiovascular ICUs (including cardiac) care for a diversity of ECMO patients as well: 63% (18,936/30,021) of adult cardiac, 51% (4,727/9,327) of adult ECPR, and 42% (13,665/32,803) of adult respiratory ECMO.
TransfersSince 2018, approximately 50% of patients reported to the ELSO Registry were transported to the ECMO center (Table S2, https://links.lww.com/ASAIO/B185). In 2022, 49% (6,413/12,963) of adult patients, 52% (1,283/2,457) of pediatric patients, and 70% (912/1,383) of neonatal patients were transported to an ECMO center. In the same year, the percentage of patients who were transported on ECMO was fifteen percent (15%) (1,906/12,963) for adult patients, 9% (216/2,457) for pediatric patients, and 5% (73/1,383) for neonatal patients.
The percentage of patients who were transported did vary by ELSO Chapter (Table S3, https://links.lww.com/ASAIO/B185). In Europe in 2022 there was roughly equal distribution among the groups (“Transported on ECMO”/“Transported not on ECMO”/“Not Transported”) with (23% [359], 38% [598]/32% [505)]). In contrast, in the same year, more patients were not transported in North America and Latin America (44%–50%); this was more pronounced in the Asia-Pacific (AP) and the South West Asia and Africa Chapter (SWAAC), with approximately 65% of patients not transported.
COVID-19During the COVID-19 pandemic, adult respiratory ECMO support was dominated by COVID-19. Patients with confirmed or suspected COVID-19 accounted for 58% (5,123/8,786) in 2020 and 74% (7,521/10,219) in 2021. By 2022, COVID-19 had diminished considerably, and only 22% (961/4,348) of patients had confirmed or suspected COVID-19 (Figure 5). During the COVID-19 pandemic (2020 and 2021), adult cardiac support, adult ECPR, and pediatric respiratory support declined relative to 2019 numbers for the first time in the last 5 years (Figure S2, https://links.lww.com/ASAIO/B185). Further, beginning in 2020, fewer adults receiving ECPR were age 65 or older (2019: 29%; 2020: 25.8%; Figure S3, https://links.lww.com/ASAIO/B185). In contrast, in 2021, more adults without COVID-19 who were offered and received respiratory ECMO were age 65 or older (2019: 15%; 2020: 14%; 2021: 18%).
 Figure 5.:
 Distribution of COVID-19 status in adult receiving respiratory support ECMO in 2020 through 2022. COVID-19 test status is indicated by colors for each of three years. Bar height represents proportion from 0 to 1, shown on the Y-axes.
Process Measures ECMO support type and modeThe distribution of ECMO support types (respiratory, cardiac, ECPR) according to age group (neonatal, pediatric, adult) over time is depicted in Figure 6. In 2022, respiratory support accounted for the plurality of neonatal ECMO cases, comprising 49% of all cases. The use of the carotid artery for respiratory support remains ~50% each year (Figure S4, https://links.lww.com/ASAIO/B185). Conversely, cardiac was the primary pediatric ECMO support, representing 46% of all cases in the same year. Before 2020, adults primarily received ECMO for cardiac support (61% in 2019). However, during the COVID-19 pandemic, a transient shift to respiratory support was observed (51% in 2020, 57% in 2021), before, again, being superseded by cardiac support (50% in 2022). The newly defined VP ECMO support21 represents only a small fraction of ECMO support (1.4% [181/12,963] of adult ECMO in 2022).
 Figure 6.:
 Runs over time by age group and support type. Number of runs over time by support type (colors) and age group (panels), from 2009 to 2022 (inclusive). Boxed numbers indicate runs counts for years 2009 and 2022 for visual reference according to color (support type). Run counts: neonatal ECPR (2009): 112; neonatal ECPR (2021): 175; neonatal Cardiac (2021): 589; neonatal Respiratory (2021): 763: neonatal ECPR (2022): 168; pediatric ECPR (2009): 219; pediatric ECPR (2021): 501; pediatric Cardiac (2021): 1,162; pediatric Respiratory; adult ECPR (2009): 86; adult Cardiac (2009): 269; adult Respiratory (2009): 495; adult ECPR (2022): 2,069.
MobilityMobilization on ECMO21 was greatest among those receiving respiratory support. Among adults, 22% (5,426/24,684) were mobilized, and 20% (206/1,056) of pediatric patients 8 or older were mobilized. Mobilization was less in other forms of ECMO support: adult cardiac 14% (2,934/20,957), adult ECPR 8% (451/5,604), pediatric cardiac patients 8 years or older 11% (128/1,150), pediatric ECPR 8 years or older 5% (21/451). Overall, the majority of ECMO patients remain immobile and bed-bound during their ECMO run.
Prone positioning in respiratory ECMOFigure 7 shows the use of prone positioning before initiation of respiratory ECMO by age. The use of prone positioning has increased among adult patients and was found primarily among patients with COVID-19 (Table S4, https://links.lww.com/ASAIO/B185). Among patients without COVID-19, prone positioning use before ECMO remained relatively unchanged over the years 2019–2022 (2019 rate: 15.2% (784/5,156), 2020 rate: 13.7% (480/3,506), 2021 rate: 10.0% (270/2,698), 2022 (10.6% (358/3,387). Among patients with COVID-19, prone positioning increased compared to the baseline rate of 15% seen in adult respiratory ECMO in 2019 (COVID prone rate 2019: 0% (0/0); 2020 rate: 57.7% (2,956/5,123); 2021 rate: 55.7% (4,190/7,521); 2022 rate: 45.9% (441/961). Prone positioning in children remained unchanged over the years 2019–2022. In 2022, it was 14% (113/815) for pediatric and 1% (8/675) for neonatal respiratory support.
 Figure 7.:
 Proportion of prone positioning use before respiratory support ECMO by age group from 2019 through 2022. Age groups are indicated by colors for each of three years. Bar height represents proportion from 0 to 1, shown on the Y-axes.
Cardiac supportSince 2009, 60% (4,128/6,911) of neonatal cardiac runs, 50% (5,797/11,504) of pediatric cardiac runs, and 16% (7,133/45,830) of adult cardiac runs had a cardiac addendum reported. Low cardiac output was the most common indication for ECMO (Table S5, https://links.lww.com/ASAIO/B185). The median cardiopulmonary bypass (CPB) duration is listed in Table S6, https://links.lww.com/ASAIO/B185, and the cross-clamp duration in Table S7, https://links.lww.com/ASAIO/B185.
ECPRThere are ECPR Addendum data available for 8,050 adults, 4,176 pediatric patients, and 1,639 neonates. The distribution of arrest locations is shown in Table S8, https://links.lww.com/ASAIO/B185. Adult arrests were more evenly spread across hospital units: 23% (1,857/8,050) occurring in the ICU, 15% (1,190/8,050) occurring in the operating room or a procedural suite, 12% (995/8,050) occurring in the Emergency Department, and 12% (944/8,050) occurring prehospital. In contrast, 65% (2,727/4,176) of pediatric and 79% (1,302/1,639) of neonatal arrests occurred in the ICU. Cannulation location was most commonly ICU for pediatric (74% [3,098/4,176]) and neonatal groups (82% [1,342/1,484]), but adult cannulations were more evenly distributed across the ICU (25% [1,981/8,050]), operating room (24.0% [1,934/8,050]) and emergency department (23% [1,808/8,050]) (Table S9, https://links.lww.com/ASAIO/B185). The most common initial cardiac arrest rhythm was pulseless electrical activity (PEA) (20% (821/4,176]) for pediatrics, other for neonatal patients (25% [410/1,639]), and ventricular fibrillation (VF (31% [2,486/8,050]) for adults (Table S10, https://links.lww.com/ASAIO/B185).
Clinical Outcomes SurvivalSurvival to hospital discharge was 57% (27,701/48,338) for adult respiratory, 44% (20,264/45,830) for adult cardiac, 30% (4,162/14,097) for adult ECPR; 64% (5,423/8,495) for pediatric respiratory, 58% (6,636/11,504) pediatric cardiac, 41% (2,355/5,740) pediatric ECPR, 69% (7,888/11,511) neonatal respiratory, 48% (3,337/6,911) neonatal cardiac, and 44% (949/2,142) neonatal ECPR (Table 1). For respiratory support, absolute survival decreased by approximately 10% from 24 hours after ECMO decannulation until hospital discharge. In contrast, for cardiac and ECPR support, absolute survival decreased by approximately 20% over the same interval (Table 1).
Table 1. - ECMO Case Counts, Center Counts, and Survival, 2009–2022 Age Group Support Type Runs Centers Survival to 24 Hours*This excludes run records in which the patient was not reported as being discharged alive to home and for which the patient’s time of death/discharge was not recorded.
†This is the percentage of patients discharged alive and off ECMO.
There were differences in the discharge locations by age group in 2022 among patients discharged alive (Table 2). Forty-two percent of adults (2,750/6,623), 63% (938/1,481) of pediatric, and 71% (591/838) of neonates were discharged directly to home. For adults, 36% (2,373/6,623) of patients were discharged to a long-term acute care (LTAC) or rehabilitation facility, compared to 13% (191/1,481) of pediatric patients and 5% (41/838) of neonatal patients.
Table 2. - Discharge Location for Decannulated ECMO Patients Discharged Alive From the Hospital, 2022 Discharge Location Neonatal Pediatric Adult Other, unknown 1.7% (14) 3.6% (53) 1.8% (120) Home 70.5% (591) 63.3% (938) 41.5% (2,750) Transferred to another hospital 20.5% (172) 14.4% (214) 15.3% (1,012) LTAC or rehab 4.9% (41) 12.9% (191) 35.8% (2,373) Transfer to hospice 0.4% (3) 0.3% (5) 1.5% (98) (missing) 2.0% (17) 5.4% (80) 4.1% (270)LTAC, long-term acute care.
The median duration of an ECMO run (2009–2022) was longest for respiratory and shortest for ECPR, across all age groups (Table 3). Among adults, the median run duration for respiratory support was 233 hours [IQR 110, 484]) and shortest for ECPR (68 hours [22, 140]) (Table 3). The median duration of respiratory support declined with age for pediatrics, the median duration of respiratory support was (188 hours [97, 357]) and for neonates, the median duration of respiratory support was (159 hours [100, 276]).
Table 3. - Duration of ECMO Run, 2009–2022 Age Group Support Type Duration (Hours)* Missing Adult Respiratory 233 (110,484) 45 Cardiac 113 (53,196) 43 ECPR 68 (22,140) 12 Pediatric Respiratory 188 (97,357) 20 Cardiac 114 (65,190) 7 ECPR 84 (38,151) 3 Neonatal Respiratory 159 (100,276) 7 Cardiac 111 (65,189) 5 ECPR 95 (53,167) 1*Median (interquartile range).
ECPR, extracorporeal cardiopulmonary resuscitation.
The rates of complications and renal replacement therapy use on ECMO, per 1,000 ECMO hours are described in Tables 4–6, as well as Table S11, https://links.lww.com/ASAIO/B185, S12 https://links.lww.com/ASAIO/B185, and S13 https://links.lww.com/ASAIO/B185). The use of renal replacement therapy (RRT) was high across all age groups. Complication rates varied by age group and support type. The incidence of limb ischemia, fasciotomy, and amputation were highest among adult patients. Cannulation complications were most prevalent for pediatric and neonatal age groups. Circuit thromboses and hemolysis was highest in neonatal support, decreasing in pediatric patients and further in adult patients.
Table 4. - ECMO Rates of Select Complications (Per 1,000 ECMO Hours) by Support Type, Adults, 2017–2022 Complication Respiratory Cardiac ECPR Cannula problems 0.155 0.206 0.377 Air in circuit 0.025 0.051 0.083 Circuit change 0.258 0.177 0.180 Clots and air emboli 0.006 0.008 0.016 Thrombosis/clots in circuit component 0.103 0.225 0.282 Renal replacement therapy 0.574 1.655 1.924 Cannula site bleeding 0.123 0.751 1.059 Surgical site bleeding 0.156 0.871 0.643 GI hemorrhage 0.136 0.272 0.392 Tamponade (blood) 0.020 0.212 0.171 CNS hemorrhage by US/CT/MRI 0.107 0.154 0.272 CNS infarction by US/CT/MRI 0.031 0.208 0.365 Seizures (clinical or on EEG) 0.019 0.068 0.241 Brain death 0.024 0.072 0.433 Hemolysis (all types) 0.160 0.282 0.351 Limb Ischemia 0.021 0.241 0.410 Compartment syndrome 0.005 0.053 0.092 Fasciotomy 0.010 0.156 0.232 Amputation 0.004 0.042 0.052CNS, central nervous system; CT, computed tomography; dL, deciliter; ECPR, extracorporeal cardiopulmonary resuscitation; EEG, electroencephalogram; GI, gastrointestinal; mg, milligram; MRI, magnetic resonance imaging; US, ultrasound; WBC, white blood cell.
留言 (0)