Study protocol
Platelet analysis was planned in patients with alcoholic liver cirrhosis as well as in a control cohort (Group Contr) of participants without liver disease. The group of patients with cirrhosis was planned to be split in two subgroups with less advanced disease (Group Cirr1; defined as Child Pugh score ≤ 7) and with advanced disease (Group Cirr2; Child Pugh score > 10). A total of 18 participants, six in each of the three groups, were planned to be included. Exclusion criteria were as followed: (1) platelet count < 50.000, (2) diagnosis of thrombotic diseases, (3) use of antithrombotic medication in the last 4 weeks or scheduled to start of such medication and/or history of anticoagulation, (4) malignant disease – patients were as well excluded per protocol during a 12 month follow up period if there was a new cancer diagnosis, and (5) relapse in alcohol consumption in the last 4 months prior to enrolment – in order to exclude acute myelosuppressive changes of alcohol consumption. Patients treated at Department of Internal Medicine IV of University Hospital Heidelberg were screened for inclusion. Six healthy donors were paired by age and sex and were enrolled in the study as controls.
The study was previously approved by the ethics committee of the University of Heidelberg and all participants provided written informed consent prior to inclusion in the study.
Plasma collection, platelet separation and storage
The preparation of blood samples was primarily conducted in accordance with established protocols [14, 15], with minor modifications implemented for optimized processing.
In total five vials each containing 9 ml blood sample and 1 ml sodium citrate stock solution (equalling a final concentration of 10% (v/v) with anticoagulant) were drawn as usual for the control and patient group. Each blood sample was processed individually. One ml citrate dextrose solution (ACD) stock solution was added to each vial prior to centrifugation at 200×g (times gravity) for 20 min. The upper third of the platelet rich plasma (PRP) was transferred to a new tube to avoid contamination with leukocytes and Prostacyclin (2.5 mM) was added to avoid platelet activation. The sample was centrifuged at 1000×g for 10 min. The resulting pellet was washed with modified Tyrodes-HEPES-buffer ((134 mM NaCl, 0.34 mM Na2HPO4, 2.9 mM KCl, 12 mM NaHCO3, 20 mM HEPES, 5 mM glucose, 1 mM MgCl2, 1 mM EGTA, 10 M indomethacin, ACD (7%, v/v), pH 7.3) and again centrifuged at 1000 g for 10 minutes. Then, platelets were resuspended at a concentration of 2 × 10⁸ cells/ml with Tyrodes-HEPES buffer, incubated for 30 minutes at room temperature, and centrifuged at 10000×g for 2 minutes. Finally, protease and phosphatase inhibitor (Halt™ Protease and Phosphatase Inhibitor Cocktail, Thermo Fisher Scientific, Waltham, USA) were added and resulting pellets were stored at − 80 °C for further analysis.
Cell lysis and protein determination
Prior to further analysis each sample was thawed on iced. The pellets were then suspended in 100 μl 0.9% NaCl and spun for 2 minutes. Following, each pellet was added to 50 μl TCA and resuspended with 350 ml lysis buffer ((9.5 M Urea, 4% CHAPS, 65 mM DTT, 0.2% carrier ampholyte, and 20 μl/ml protease inhibitor cocktail). Subsequently, the lysed platelets were subjected to centrifugation at a speed of 14,000 rpm for 60 minutes. The supernatant, enriched in soluble proteins, was then employed for 2-dimensional gel electrophoresis. The protein concentration of each sample was quantified using the Bradford protein assay.
Isoelectric focusing
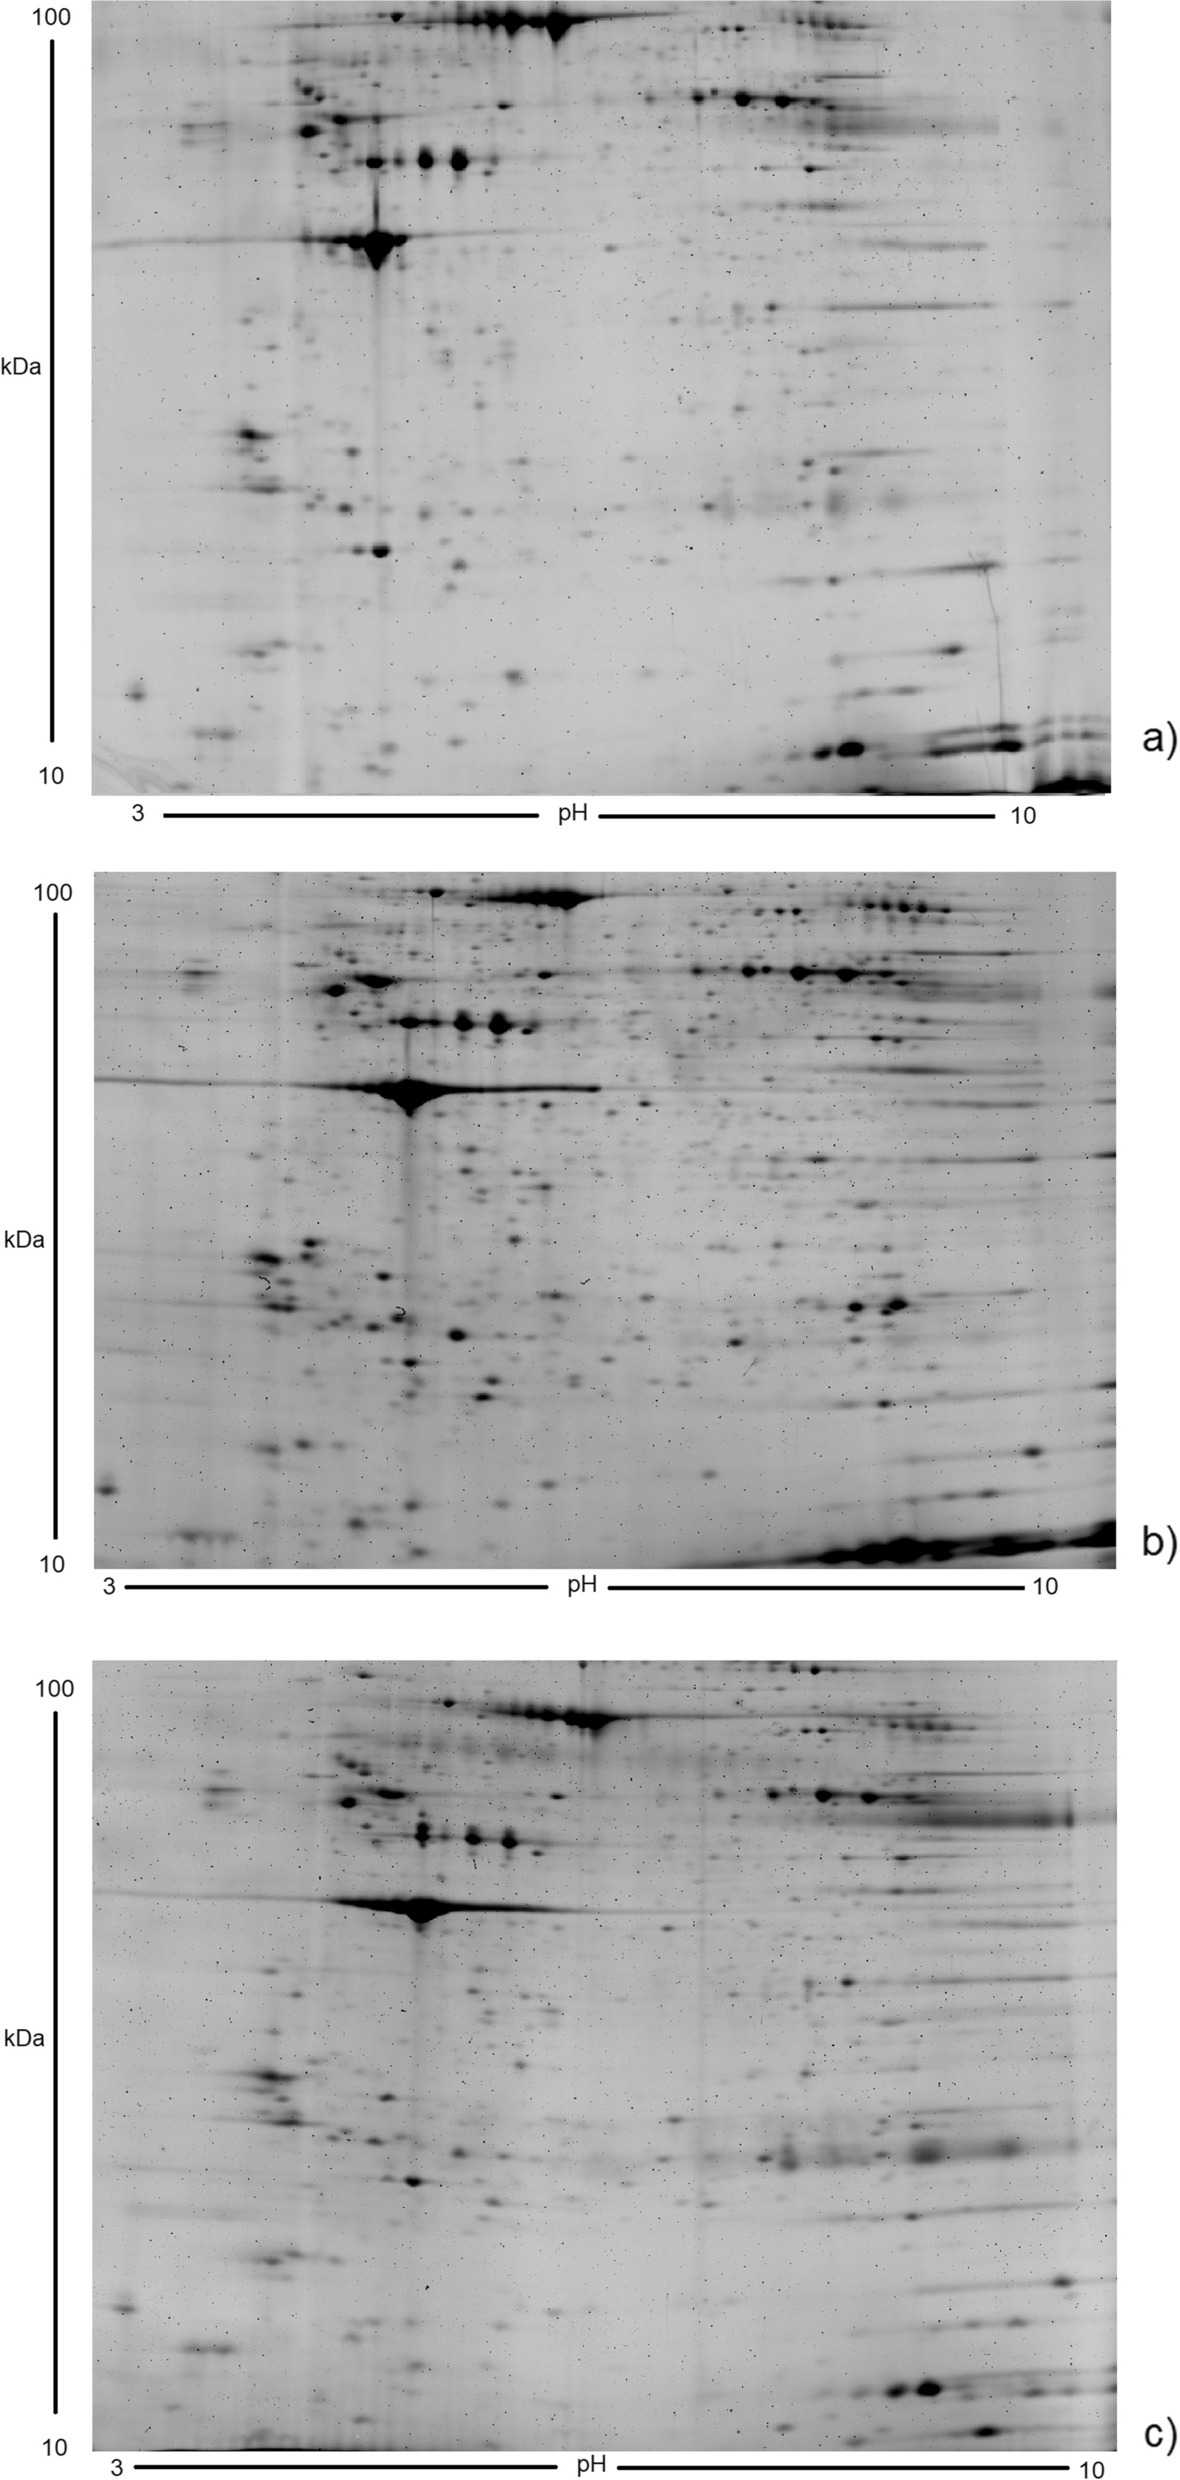
The first step of isoelectric focusing (IEF) was done using immobilized pH gradient (IPG) strips (non-linear gradient, 18 cm, pH 3–10, Thermo Fisher Scientific, Waltham, USA). Each strip was rehydrated for 5 h at 30 V, 6 h at 60 V and 2 h at 100 V. IEF was conducted at 200 V, 500 V and 1000 V for each 1,5 h followed by a gradient from 1000 V to 8000 V and focusing at 8000 V for 8 h to reach a total of approx. 60–80 kV. After completion of IEF, the IPG strips were immediately used for further analysis.
2-DE analysis
Equilibration was performed via incubation of the strips in equilibration buffer for 20 minutes with gentle shaking (1% w/v DTT, 50 mM, pH 6.8 Tris–HCl, 6 M Urea, 30% Glycerol, 2% SDS, bromophenol blue) followed by a second 20 min equilibration in (2.5% w/v IAA instead of DTT). The strips were then added for separation in the second dimension (molecular weight) to 12.5% acrylamide gels. Bromphenol blue was added to visualize the progress of the separation process. PageRuler Plus Prestain Protein (10 to 250 kDa) was used as a protein marker. The separation was done as soon as the blue front reached the bottom. Following two fixation steps of each 30 minutes by placing the gels in a 50% methanol and 7% acetic acid solution visualization was done by SYPRO™ Ruby (Thermo Fisher Scientific, Waltham, USA) protein gel stain following the staining method recommended by the manufacturer. Each sample was run in both a technical and biological duplicate to ensure reproducibility.
Scan of the 2-DE gels
The scanning of each gel was performed using a Molecular Imager® FX scanner (Bio-Rad Laboratories, California, USA). Following the manufacturer’s instructions, the light source was set to a wavelength of 488 nm for the analysis of the 2-DE gels, to optimally excite the fluorescent dyes or labeled proteins. The emission filter was calibrated to 640 ± 35 nm to precisely isolate the light emitted by the dyes. These specific settings ensure that only the desired emitted light is captured, thereby minimizing interference signals and enabling a clear and accurate representation of the protein spots on the gel. The resolution of each scan was 530 pixels per millimeter.
Image acquisition and data analysis
The image analysis was conducted with Image Master 2 (General Electric, Boston, USA). The resolution was 530 pixels per millimetre. Several parameters were fixed to ensure comparable data for quantitative analysis. Each subgroup (controls, mild and advanced liver cirrhosis) was grouped creating a reference gel for further analysis following the instructions of the developer. To generate the reference gels for further analysis, the digital data of the IPG strips within each subgroup was pooled using the Image Master software. This digital pooling process allowed us to create a representative representation of the overall protein patterns for each subgroup. Grouping was done according to the proprietary parameters pre-set in the program. Internal software filters excluded experimental artifacts. Furthermore, each gel was resized manually to ensure best possible comparability. Spots with a 2-fold abundance change and an ANOVA < 0.05 were accepted as statistically significant and selected for protein identification. Increased volume by 50% was defined as up-regulation and decreased volume by 50% was defined as down-regulation.
In-gel-digestion and peptide extraction
Protein digestion and LC-MS measurement were done as previously explained elsewhere [16]. In short, protein spots of interest were excised manually from the reference gels. Following a reduction with 40 mM dithiothreitol and alkylation with 50 mM iodoacetamide gel pieces were dehydrated. Trypsin solution (sequencing grade, Thermo-Fisher, Rockford, USA) was added to the dry gel pieces and incubated over night at 37 degrees Celsius. The reaction was quenched by addition of 20 μL of 0.1% trifluoroacetic acid (TFA; Biosolve, Valkenswaard, Netherlands). The supernatant was dried in a vacuum concentrator before LC-MS analysis.
LC-MS measurements
Nanoflow LC-MS analysis was performed with NanoAcquity UPLC liquid chromatography (Waters, Eschborn, Germany) system coupled to an Orbitrap XL (Thermo-Fischer, Bremen, Germany). Samples were loaded to a NanoAcquity Symmetry C18 Trap column (particle size 5 μm, inner diameter 180 μm × 20 mm, Waters) at a flow of 15 μL/min for 5 min of 0.5% solvent B. Peptides were separated using a NanoAcquity M-Class peptide BEH C18 analytical column (particle size 1.7 μm, inner diameter 75 μm × 250 mm, Waters) with a 1 h linear gradient (3–40% B) with a flow rate of 300 nL/min. Solvent A was 0.1% formic acid (FA; ProteoChem, Denver, CO, USA) in H2O (Biosolve) and solvent B was composed of 0.1% FA (ProteoChem), 10% H2O (Biosolve) and 89.9% ACN (Biosolve). The mass spectrometer was operated in data-dependent acquisition mode, automatically switching between MS and MS 2. MS spectra (m/z 400–1600) were acquired in the Orbitrap at 60,000 (m/z 400) resolution, with an automatic gain control (AGC) target value of 5 × 10 and maximal ion injection time (IT) 50 ms. Collision induced dissociation MS 2 spectra were generated for up to 10 precursors with normalized collision energy of 35% in the ion trap. The MS 2 AGC target value was set to 10 4 with a maximum IT of 100 ms.
Protein identification
Raw files were analyzed using Proteome Discoverer with the Sequest (Thermo Fisher Scientific, San Jose, USA; version 2.2). Sequest was set up to search against Uniprot human databases (June 2017, https://www.uniprot.org/) with trypsin as the digestion enzyme. A fragment ion mass tolerance was set to 0.50 Da and a parent ion mass tolerance to 10 ppm. Carbamidomethyl of cysteine was specified as a fixed modification. Deamidation of asparagine and glutamine, oxidation of methionine and acetyl of the N-terminus were specified as variable modifications. The peptide and protein identity were verified by Scaffold (version Scaffold_4.8.4, Proteome Software Inc., Portland, USA). Peptide identifications were accepted if they could be established at greater than 95.0% probability by the Peptide Prophet algorithm [17] with Scaffold delta-mass correction. Protein identifications were accepted if they could be established at greater than 95.0% probability and contained at least 2 identified peptides. Protein probabilities were assigned by the Protein Prophet algorithm [18]. Proteins that contained similar peptides and could not be differentiated based on MS/MS analysis alone were grouped to satisfy the principles of parsimony.
Statistical analysis
All data are expressed as mean with standard deviation (SD). Statistical analysis was conducted by SPSS Version 22 (IBM Corp., Armonk, USA) as well as Image Master 2 (General Electric, Boston, USA). A p-value less than 0.05 was defined as statistically significant.


留言 (0)