
記住我


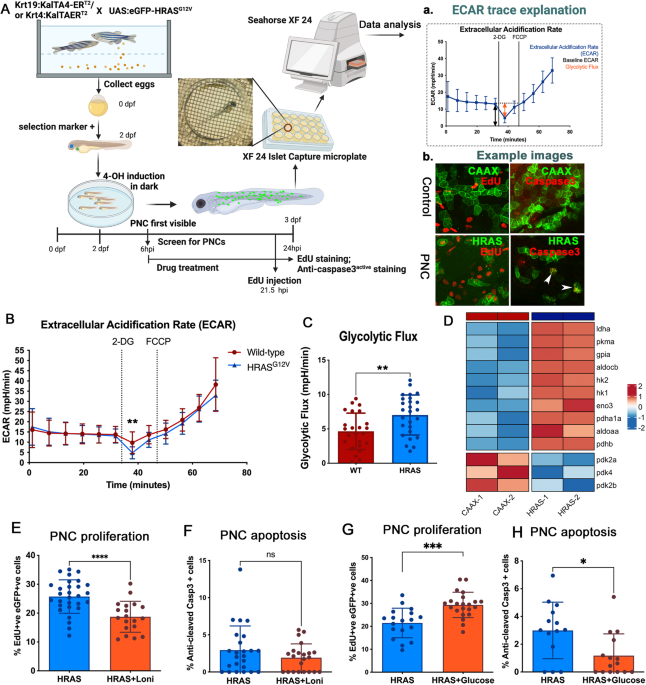
In our model of tumour initiation, human HRASG12V (thereafter HRAS) was induced in zebrafish larval keratinocytes to mimic the initial mutational event leading to PNC development (Fig. 1A Schematic). EGFP tagged PNCs can be identified from 8 h post induction (hpi) and analysing cell proliferation suggests that enhanced PNC growth is overt from 24hpi and the proliferation rate in PNCs remains high at later times [10, 11]. We therefore focused our analysis within the first 24 h of PNC emergence to establish the earliest metabolic changes following PNC induction.
Fig. 1: Glycolysis is important in boosting PNC proliferation and excess glucose promotes PNC survival and expansion.
A Schematic showing the inducible human HRASG12V mediated preneoplastic cell in zebrafish larval skin tissue. Seahorse® Metabolic Flux analyses were carried out at 24 h post induction (hpi). A a, explanation of ECAR trace b, representative confocal images of EdU staining (proliferation) and anti-cleaved-Caspase3 staining (apoptosis) that were carried out in this study. B Seahorse Analyser® ECAR readout over time, showing no difference in baseline ECAR (before cycle 6), glycolytic flux (after adding 2-DG) readout at cycle 7 showing enhanced glycolytic flux in HRAS PNCs. Note: 2-DG leads to a transient ECAR change which recovers from cycle 8, this is thought to be due to the whole organism response to 2-DG. FCCP was added (black line) to assess respiratory function using the complimentary OCR readout (data not shown, as similar OCR data were presented in Fig. 2). C Quantification (cycle 7 ECAR) showing PNC have enhanced glycolytic flux (mean +/− SD, From 4 experiments n ≥ 24, p = 0.0042). Hexokinase inhibitor lonidamine (2 nM) treatment leads to reduced EdU positive cells in PNCs (unpaired t test, mean +/− SD, 2 experiments, animal n ≥ 19, p = 0.0001). D Pseudobulk differential expression analysis of single-cell RNA sequencing data, showing significantly up- and down- regulated genes related to glycolysis in HRAS PNCs vs. Control CAAX keratinocytes at 24 hpi. Heatmap depicts log fold-change (EdgeR, n = 2, FDR < 0.05). E Hexokinase inhibitor lonidamine (2 nM) treatment did not change PNC apoptosis (unpaired t test, mean +/− SD, 3 experiments, animal n ≥ 22, p = 0.2042). F Glucose injected larvae show increased PNC proliferation (unpaired t test, mean +/− SD, 2 experiments, animal n ≥ 18, p = 0.0002). G Glucose injected larvae show decreased PNC apoptosis (unpaired t test, mean +/− SD, 2 experiments, animal n ≥ 14, p = 0.0119).
In order to assess glycolytic activity of PNCs in skin tissue, we established a protocol using intact zebrafish larvae and the Seahorse analyzer® to measure extracellular acidification rate (ECAR) (Fig. 1A schematic), which has generally been used as a proxy to evaluate aerobic glycolysis of cells and tissues (figure A a) [12]. In this assay, 2-Deoxy-d-glucose (2-DG) was used to block glycolysis generated ECAR and here we saw greater reduction of ECAR in PNC-bearing larvae compared with controls, indicating a higher rate of glycolysis in PNCs (Fig. 1A a, B, C). Furthermore, we analysed gene expression of enzymes involved in the glycolysis pathway using existing single cell RNA sequencing data of 24hpi HRAS expressing PNCs (Elliot et al in preparation [13]). We saw up-regulation of many key glycolytic enzymes including hexokinase 1 and 2 (hk1, hk2) and lactate dehydrogenase a (ldha) (Fig. 1D), thus further supporting enhanced glycolysis in PNCs.
To test whether enhanced glucose usage is required for PNC progression, we treated larvae with low doses of glycolysis inhibitor, Lonidamine (2 nM) [14], and this led to a significant reduction in PNC proliferation (Fig. 1E), while the same dose had no impact on control EGFP-CAAX (CAAX thereafter) expressing keratinocyte proliferation (Supplement Fig. 1). We saw no significant increase in apoptotic cell death (Fig. 1F), suggesting that glycolysis in PNCs was important for their enhanced proliferation but not their survival.
To further test the impact of altered energy availability, we mimicked the condition of surplus sugar availability by injecting glucose into the yolk (the energy storage tissue for fish larvae). This led to a marked enhancement of PNC proliferation (Fig. 1G). Interestingly, apoptosis was also reduced in PNCs from larvae receiving a glucose supplement (Fig. 1H). These data established a promotional role for glycolysis in PNC growth and provided direct evidence that increased energy supply in the form of glucose promotes cells with oncogenic potential to survive and expand in vivo.
OXPHOS Respiration is also altered in PNCs and targeting complex I can specifically suppress PNCs in vivoIt is believed that enhanced glycolysis in cancer cells promotes the generation of building blocks required for the increased demands of cell mass growth, while in parallel OXPHOS is still required or may even be up-regulated to provide sufficient energy supply [15,16,17,18]. To assess mitochondrial respiratory activity of PNCs, we developed a protocol similar to the ECAR measurement, using the Seahorse Analyzer® to measure Oxygen Consumption Rate (OCR) from intact larvae (Supplementary Fig. 2). Mitochondrial un-coupler FCCP (Carbonyl cyanide-p-trifluoromethoxyphenylhydrazone) was used to allow us to measure mitochondrial maximum respiration rate (Fig. 2A). These data showed that whilst baseline respiratory capacity was not altered in larvae with PNCs, their maximum respiratory capacity was significantly decreased compared to CAAX controls (Fig. 2A, B, C), indicating impaired mitochondrial function. Previous studies have suggested that cells with HRAS mutations in vitro develop complex I deficiency through rapid accumulation of mutations in complex I components, leading to reduced mitochondrial respiratory function [19]. Whilst we were unable to perform analyses to determine whether there were mutations or not in Complex I components of PNCs in vivo, we did observe a reduced capacity for respiratory function. Additionally, gene expression analysis revealed that OXPHOS genes were enriched in PNCs compared with CAAX controls (Fig. 2D). We speculate that this could be a compensatory up-regulation of mitochondrial gene expression due to damaged mitochondria, which again might explain impaired mitochondrial function. We reasoned that cells with complex I deficiency would be more vulnerable to complex I perturbation, as this has been shown previously in a detailed analysis using tissue cultured cell lines [20], and therefore targeting complex I by biguanides could specifically eliminate PNCs versus healthy epithelia [21, 22]. Biguanides are widely used as anti-hyperglycaemic agents that target complex I [23] and have previously been used to target cancer cells carrying complex I deficiency [20]. Metformin is one of the most frequently used biguanides for diabetes mellitus and prediabetes treatment [23]. Interestingly, previous reports have suggested that metformin leads to reduced risk of Oesophageal Squamous Cell Carcinoma [24] and metformin was shown to reduce tumourigenesis through inhibiting complex I in xenograft models [25]. Due to established correlation that metformin medication reduced cancer in diabetic patients and positive outcome from pre-clinical studies of anti-cancer function of biguanides, there is an interest in repurposing metformin for cancer therapy with multiple clinical trials ongoing [26, 27]. We treated PNC bearing larvae with metformin for 4 h and this lead to increased activated-caspase-3 staining in PNCs in the superficial skin cell layer (Fig. 2E). A longer treatment of 8 h also led to a significant increase of activated caspase-3 signal in basal PNCs (Fig. 2F). Furthermore, we detected reduced EdU incorporation in PNCs compared with untreated controls (Fig. 2G) indicating that OXPHOS is important for PNC proliferation and that targeting complex I with metformin can induce PNC apoptosis and reduce PNC proliferation. Within a longer time frame, metformin treatment leads to reduction in PNC number compared with control group (Fig. 2H). Importantly, metformin treatment had no effect on healthy skin cells (Supplementary Fig. 2) and there were also no visible adverse effects on larval survival. To confirm the importance of complex I function to support PNC progression, we further tested another more specific and potent complex I inhibitor IACS-010759 [28]. We found a stronger reduction of PNC proliferation by IACS-010759 treatment (Fig. 2I) and a significant reduction of PNC numbers in treated group after 48 h treatment (Fig. 2J). Interestingly, we could not detect changes in apoptotic cell death in IACS-010759 treated larvae (data not shown). This suggests that metformin might be inducing PNC apoptotic cell death through other pathways, however this is beyond the scope of current study and should be further investigated in follow up research. Therefore, we have established that targeting complex I, can suppress HRAS mediated PNCs expansion in vivo at inception and provide further evidence for potent cancer preventive efficacy of metformin.
Fig. 2: OXPHOS is impaired in PNCs and complex I inhibitor metformin suppresses PNC proliferation and induces PNC apoptosis in vivo.
A Seahorse Analyser® Oxygen Consumption Rate (OCR) measurement comparing control larvae with PNC bearing larvae, graph showing OCR readout over time. Cycle 4 showing similar baseline respiration. Uncoupler FCCP was added after cycle 4 (black line) which assesses the reserve OCR. Cycle 7 showing significantly reduced maximum OCR in PNC bearing larvae, indicating reduced reserved respiration capacity. After cycle 8, treatment with the complex III inhibitor antimycin and the complex I inhibitor rotenone (black line) allowed the non-respiratory contribution to OCR to be determined, and there was no difference detected. (p < Mean +/− SD, 4 experiments, animal n ≥ 20 embryos, Two-way ANOVA followed by Sidak’s multiple comparisons test). B Quantification showing maximum respiratory capacity is reduced in HRAS expressing PNCs (cycle 6 OCR, unpaired t test, mean +/− SD, n ≥ 20, p = 0.0326). C Quantification showing maximum respiratory capacity is reduced in HRAS expressing PNCs (cycle 7 OCR, mean +/− SD unpaired t test, n ≥ 20, *p = 0.0193) D Gene-set enrichment analysis of single-cell RNA sequencing data shows that oxidative phosphorylation is enriched in HRAS expressing PNCs vs. CAAX expressing control keratinocytes (NES = 1.4401, p = 0.0409, FDR = 0.1308). E Quantification showing metformin treatment induces superficial skin PNC apoptosis within 4hpt (Mean +/− SEM, Mann-Whitney test, 2 experiments, animal n ≥ 12, p = 0.0001). F Quantification showing metformin treatment induces basal skin PNC apoptosis (Mean +/− SD, unpaired t test, 2 experiments, animal n ≥ 10, p = 0.0185). G quantification showing reduced proliferation of basal PNCs upon metformin treatment (Mean +/− SD, unpaired t test, 3 experiments, animal n ≥ 28, p = 0.0072). H Quantification showing metformin treatment leads to reduced PNC burden at 48 hpi (PNC fluorescent volume in defined area per animal; Mean +/− SD, unpaired t test, n ≥ 11, p = 0.0102). I quantification showing reduced proliferation of basal PNCs upon IACS treatment (%EdU incorporation in PNCs; Mean +/− SD, unpaired t test, n ≥ 9, p < 0.0001). J Quantification showing reduced PNC burden at 48 hpi upon IACS treatment (PNC number per animal; Mean +/− SD, unpaired t test, 2 experiments n ≥ 6, p = 0.0016).
Mitochondrial fission is an early event in oncogenic HRAS driven preneoplastic cell (PNC) expansion in vivoAlteration in mitochondrial morphology dynamics was linked to changes of mitochondrial metabolism and was required for transformed cells to drive tumourigenesis in xenograft models [19, 29]. To establish whether mitochondrial morphology is changed in PNCs, which might explain altered OXPHOS, we performed in vivo live imaging to assess mitochondrial morphology. The vital Mito-Tracker dye revealed that mitochondria became more fragmented in PNCs by 8hpi, the earliest time at which PNCs can be detected by fluorescence and mitochondria remain more fragmented at 24hpi (Fig. 3A). Compared with stage matched CAAX-EGFP expressing keratinocytes there was a greatly increased number of mitochondria and the average fragment size was smaller in the PNCs (Fig. 3A, D, E). The increased fragmentation of mitochondria was also confirmed by electron-microscopy, in which smaller mitochondria could be seen in the PNCs although we saw no obvious changes to mitochondrial membranes or cristae structure (Fig. 3B, C arrowheads).
Fig. 3: Mitochondria in PNCs are fragmented and have reduced membrane potential.
A Confocal images of mito-trackers CMXRos and Deep-Red stained zebrafish larval skin cells. a, b, c, indicate “Zoom in” area of mito-tracker deep-red image to show details of mitochondrial fragmentation phenotype in HRAS expressing skin PNCs. Scale bar = 10 µm. B Electron microscope image of a mitochondrion in normal skin cells of zebrafish larva. C Electron microscope image of mitochondria in HRAS expressing skin PNC of zebrafish larva. D Quantification showing increased number of mitochondrial fragments in PNCs (Mann-Whitney test, p = 0.0087, 3 experiments, animal n ≥ 8) E Quantification showing decreased mitochondrial fragment size in PNCs (Mann Whitney test, median, p < 0.0001) F Quantification showing decreased mitochondrial membrane potential in PNCs (unpaired t tests, 24 hpi; 2 experiments, animal n ≥ 6, p = 0.004; 8 hpi n ≥ 3, p = 0.0099).
Increased mitochondrial fission has been linked to mitochondrial damage repair and reduced membrane potential and this could explain the reduced mitochondrial respiratory reserve that we detected [30, 31]. We took advantage of two MitoTracker dyes with different sensitivities to mitochondrial membrane potential [32]. While the MitoTracker-DeepRedFM is insensitive to mitochondrial membrane potential and labelled each mitochondrion in its entirety (Fig. 3A, a, b, c), the mitochondrial membrane potential dependent dye, MitoTracker Red CMXRos, was much fainter and occasionally missing from mitochondria in PNCs compared to MitoTracker-DeepRedFM (Fig. 3A). Co-localization analysis of the two MitoTrackers showed a reduced membrane potential in PNCs as early as 8 hpi (Fig. 3A, F) and this reduction was maintained at 24 hpi (Fig. 3A, F) corroborating reduced mitochondrial maximum respiration that we observed.
Drp1/Dnml1 inhibitor mdivi blocks mitochondrial fragmentation and induces PNC apoptosisIt has been reported previously that the small GTPase Drp1 (called dnml1 in zebrafish) drives mitochondrial fragmentation in cancer cells carrying oncogenic RAS mutations in vitro [19, 31]. Using previously generated single-cell RNA sequencing data (Elliot et al. unpublished) we found that dnml1 was indeed up-regulated in PNCs at 24hpi (Fig. 4A). Alongside dnml1 we also saw upregulation of other mitochondrial fission proteins such as fis1, mtfr1, mtfr1l, mtfr2 [33, 34] (Fig. 4B). Conversely, one of the key mitochondrial outer membrane fusion proteins mfn1b is down regulated [18] (Fig. 4B). Thus, gene expression changes amongst mitochondrial dynamic regulators support enhanced mitochondrial fission that we saw. The increased mitochondrial fission has been shown to be required for RAS mutant tumour formation in a xenograft model [19, 31]. Therefore, we speculated that mitochondrial fission might be necessary for PNC initial development. To test whether reversing the mitochondrial fission phenotype might negatively impact on PNC development, we utilized a Drp1/Dnml1 inhibitor mdivi, which has been used in multiple models to reverse Drp1/Dnml1 mediated mitochondrial fission phenotype [35, 36]. Due to its ability of reduce pathological mitochondrial fission and protection from cell death in degenerative diseases, mdivi holds promise in the treatment of neuro-degenerative diseases and is safe for human use [36]. Mdivi has also been shown to enhance cancer cell death through inhibiting Drp1 [37]. In zebrafish, mdivi has previously been show to protect hair cells from cisplatin induced death [38]. When we treated PNC bearing larvae with mdivi, we could reduce the mitochondrial fragmentation of PNC in vivo within 2 h of treatment (Fig. 4B, C, D).
Fig. 4: mdivi suppression of Drp1/Dnml1 blocks mitochondrial fission and induces PNC apoptosis.
A Violin plot, depicting normalized expression of dnml1 in single-cell RNA sequencing dataset, shows that dnml1 is up-regulated in PNCs vs. CAAX control keratinocytes. B Pseudobulk differential expression analysis of single-cell RNA sequencing data, showing genes related to mitochondrial fission and fusion in HRAS PNCs vs. control keratinocytes at 24 hpi. Heatmap depicts log fold-change (EdgeR, n = 2, FDR < 0.05). C Quantification showing increased mitochondrial fragmentation can be reversed by mdivi treatment (Kruskal-Wallis test with Dunn’s multiple comparisons, p = 0.001, 3 experiments, animal n ≥ 8) D Quantification showing reduced size of mitochondrial fragments can be reversed by mdivi treatment (Kruskal-Wallis test with Dunn’s multiple comparisons, p < 0.0001) E Quantification showing mdivi does not alter PNC proliferation (unpaired t test, p = 0.1889, n ≥ 22). F quantification showing mdivi induced PNC apoptosis (mean +/− SD, Mann-Whitney test, p = 0.001, 2 experiments, animal n = 11).
Using mdivi treatment to reverse mitochondrial fragmentation, we found that PNC proliferation remained unaltered (Fig. 4E), but we did detect significantly increased apoptotic cell death of PNCs (Fig. 4F). These data suggest that oncogenic RAS expressing PNCs undergo metabolic adaption through Dnml1 mediated mitochondrial fission and that this is required for PNC survival. Moreover, we show how this could be efficiently targeted by small molecule mdivi for therapeutic PNC elimination.
In summary, our studies have established an enabling role for rapid metabolic adaption in cells that switch on RAS mediated oncogenic pathways, by promoting their survival and expansion in vivo at the preneoplastic stage. We show that “Warburg metabolism” is required for PNC hyper-proliferation, oncogenic RAS driven PNCs appear to have an enhanced ability in using glucose, reducing their ability to use glucose through hk inhibition could limit their rapid expansion. Although much higher doses of hk inhitor can block PNC proliferation, similar doses started to affect normal cell growth, which indicate a complete block of glucose usage is not a viable approach for PNC elimination. However, increased availability of glucose in vivo further promotes PNC proliferation, and which in turn maximises their expansion. The excess glucose resource mediated PNC hyper-proliferation might provide a mechanism linking dietary high sugar intake to cancer incidence that has been observed in humans [39, 40]. We also find that a rapid change in mitochondrial dynamics and function, is required for PNC survival during their rapid proliferative expansion. These mitochondrial dynamics change was previously linked to altered OXPHOS capacity in RAS expressing tissue cultured cells, in which oncogenic RAS expression leads to reduced OCR in Primary mouse embryonic fibroblasts (MEFs) [19]. Although, due to technical limitations, we cannot isolate keratinocytes and culture them in vitro to confirm that RAS-expressing PNCs are the source of OCR and ECAR changes detected from a whole larva, similar metabolic changes were previously reported to be included in tissue-cultured cells upon oncogenic RAS expression [19]. Our data suggest that within a normal physiological tissue environment, the activation of oncogenic RAS-driven PNC exhibits similar metabolic adaptation through mitochondrial fission. This is futher supported by gene expression analysis, showing changes in the expression of Oxidative Phosphorylation and glycolytic genes in PNCs. Although it remains to be determined as to how oncogenic RAS drives a rapid complex I deficiency. We confirmed that the reduced complex I function in RAS driven PNCs can be exploited for their suppression, similar to previous reports that cells with complex I deficiency are more sensitive to complex I inhibition treatment [19,20,21]. Importantly, we provide evidence that the metabolic adaptation pathways might be targeted to selectively eliminate PNC through re-purposing currently available drugs, thus providing possible effective tumour prevention strategies for humans with RAS driven cancer predisposition syndromes [41].
留言 (0)