DNA Constructs
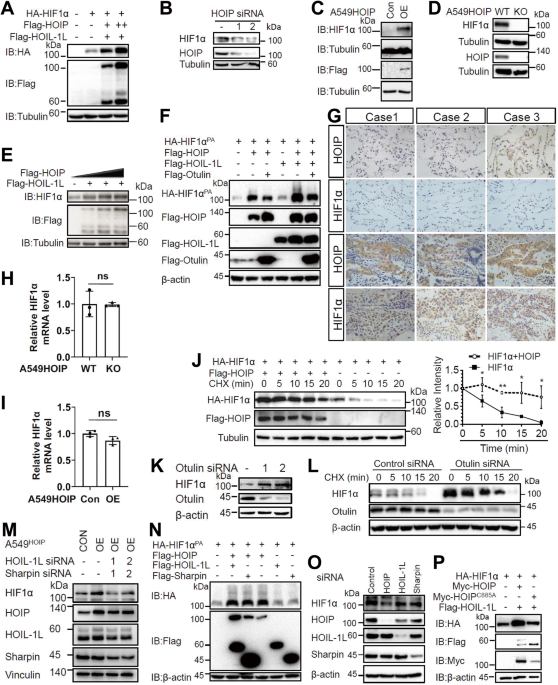
To make vectors expressing full-length or different fragments of HIF1α with Flag, myc, GFP, or glutathione S-transferase (GST) tags, PCR amplification was performed using pfu polymerase (Yeasen) and the amplicons were inserted into p3xflag-CMV-13, pCDNA3-myc, pEGFP-C1, or pEBG. The constructs harboring EGFP-tagged HOIP and mCherry-tagged HIF1α were generated by cloning the DNA fragments encoding HOIP-EGFP and HIF1α-mCherry into p3xflag-CMV-13. Lamin B1 cDNA was subcloned into pTagBFP-C1 to construct plasmid expressing Lamin B1-BFP. The lentivirus expressing HOIP was engineered by cloning HOIP cDNA into pLvx-t2a-mCherry. The constructs harboring HA-tagged Otulin, CYLD or A20 were obtained by subcloning the PCR products into pCDNA3.1. The plasmid expressing GST-specific tandem Ub-binding entity (TUBE) was constructed by subcloning the cDNA encoding UBAN domain of IκB kinase (IKK) γ into pGEX-4T-1. Site-directed mutagenesis of HIF1α mutants was conducted to generate different point mutants using site-directed mutagenesis kit (Yeasen) as described previously [31, 32]. Other plasmids were described in the previous publications [6, 31,32,33,34,35,36,37,38,39]. All constructs were verified by DNA sequencing.
RNA interference
LAMP2A small interfering RNAs (siRNAs) (5’-CGCUAUGAAACUACAAAUATT-3’; 5’-GCUCUACUUAGACUCAAUATT-3’), HIF1α siRNAs (5’-GCUAUUCACCAAAGUUGAATT-3’; 5’-CAUGAAAGCACAGAUGAAUTT-3’), HOIP siRNAs (5’-CGUGGUGUAAAGUUUAAUATT-3’; 5’-GGCGUGGUGUCAAGUUUAATT-3’), HOIL-1L siRNAs (5’CACACCUUCUGCAGGGAGUTT-3’; 5’-ACUCCCUGCAGAAGGUGUGTT-3’), Sharpin siRNAs (5’-CCUGGAAACUUGACGGAGATT-3’; 5’-CUGCUUUCCUCUACUUGCUTT-3’) and Otulin siRNAs (5’-GACUGAAAUUUGAUGGGAATT-3’; 5’-CAAAUGAGGCGGAGGAAUATT-3’), and control siRNAs were purchased from RIBOBIO (Guangzhou, China). HOIP siRNA was also purchased from Santa Cruz Biotechnology (sc-92101). The siRNAs were transfected into cells using Lipofectamine 2000 reagent (Invitrogen) as described previously [32, 38].
Antibodies
anti-FLAG M2 (Sigma, F1804), anti-HA.11 (BioLegend, 901501), anti-myc (Santa Cruz Biotechnology, sc-40), anti-GST (Yeasen, 30902ES60), anti-α-tubulin (Yeasen, 30304ES60), anti-β-actin (Yeasen, 30101ES60), anti-GAPDH (Immunoway, YM3029), anti-CD31 (Abcam, ab28364), anti-VEGF (Novus Biologicals, NB100-664), anti-PCNA (Servicebrio, GB11010), anti-ubiquitin (Santa Cruz Biotechnology, sc-8017), anti-GFP (Yeasen, 31002ES60), anti-LUB9 (Lifesensors, AB130), anti-HIF1α (Novus, NB100-479; Abcam, ab228649), anti-HIF1β (Cell Signaling technology, #5537), anti-Otulin (Abcam, ab211328), anti-HOIP (Abcam, ab46322; R&D systems, MAB8039), anti-HOIL-1L (Millipore, MABC576), anti-Sharpin (Proteintech, 14626-1-AP), anti-LAMP2 (Santa Cruz Biotechnology, sc-18822), anti-Lamin B1 (Zenbio, R24825), normal mouse immunoglobulin (IgG) 1 (Santa Cruz Biotechnology, sc-3877), anti-mouse IgG(H + L) (Jackson ImmunoResearch, 151383), and anti-rabbit IgG(H + L) (Jackson ImmunoResearch, 145472).
Cell culture and transfection
Human embryonic kidney (HEK) 293, HEK293T, A549, NCI-H460, and J774A cells were obtained from ATCC (Manassas, VA). HEK293, HEK293T, A549 and J774A cells were maintained in Dulbecco’s Modified Eagle’s Medium (DMEM) supplemented with 10% heat-inactivated fetal bovine serum (FBS). NCI-H460 cells were maintained in RPMI 1640 medium supplemented with 10% FBS. Hypoxic culture of cells was conducted as described previously [31, 37]. All cell lines were verified to be mycoplasma-free. Cells were transfected as described previously [40].
Preparation of bone marrow-derived macrophages (BMDMs)
Mouse BMDMs were prepared from hoipfl/fl mice and differentiated into macrophages as described previously [40, 41]. Hoipfl/fl mouse strain [42] was kindly provided by Prof. X. Lin.
Luciferase reporter assay
Luciferase expression in cells transfected was measured using a Dual-Luciferase reporter assay system (Yeasen) following the manufacturer’s instructions. The expression of firefly luciferase driven by the HIF1-HRE was used as a reporter. pRL-tk (renilla luciferase) was cotransfected to normalize for the transfection efficiency. Luciferase activity was expressed as a ratio of firefly luciferase activity to renilla luciferase activity. Normalized values are reported as the means ± SEM (standard error of the mean) of the results of triplicate transfection. Student’s t-test for paired samples was used to determine statistical significance.
Establishment of stable A549 overexpressing HOIP cell line
HEK293T cells were co-transfected using Lipofectamine 2000 with lentiviral vector (plvx-Flag-HOIP) and packaging plasmids (plp1, plp2 and vsvg). After 24 h and 48 h posttransfection, the supernatants containing lentiviral particles were harvested and filtered through 0.45-μm filters. A549 cells were infected by the letivirus particles and then selected with puromycin (Invivogen). The single cell-derived colonies were isolated, expanded and analyzed by IB.
Establishment of A549 HOIP knockout cell lines
A549 HOIP knockout (A549HOIPKO) cell lines were established using CRISPR/Cas9 technology. Sequences of three guide RNAs used were: sgRNA1-F (CACCGTGACTCCTGCCTCAGGATGC); sgRNA2-F (CACCGTGACTCCTGCCTCAGGATGC); sgRNA3-F (CACCGTTGACACCACGCCAGTACCG). gRNA oligonucleotides were cloned into lentiCRISPRv2. A549 cells were infected by the letivirus particles from HEK293T cells transfected with the constructs containing sgRNAs, psPAX2 and pMD2.G. The cells were selected using puromycin. The single colonies were isolated, expanded and analyzed by IB.
Real-time quantitative PCR (qPCR)
Total RNA was extracted from the cells using Trizol reagent (Yeasen) per the manufacturer’s instructions. Reverse transcription of template RNA into cDNA was performed using a RevertAid First Strand cDNA Synthesis Kit (Thermo Scientific). For quantitative PCR (qPCR) analysis of gene expression, amplification was conducted using a FastStart Universal SYBR Green Master (Roch) and run on a Real‐time PCR System (ABI‐7000). All samples were run in triplicate. The Ct values for target genes and the reference gene were recorded. The expression level of GAPDH was used for normalization. Primer sequences are available upon request.
Immunoblotting (IB)
IB was carried out as previously described [31, 36,37,38,39]. Cellular proteins were quantified, resolved on SDS-PAGE and electroblotted onto a polyvinylidene difluoride membrane. Following blocking, the membrane was incubated with an appropriate primary antibody and then incubated with a corresponding anti-mouse IgG or anti-rabbit IgG conjugated to horse radish peroxidase. The blots were developed by ECL (Yeasen) or ECL Plus (Yeasen) method.
Immunoprecipitation (IP)
IP was conducted as previously described [31]. The precleared lysates were incubated with the corresponding antibody (about 1–1.5 μg each) in the presence of 20 μl of Protein A/G Agarose (Thermo Scientific) overnight with constant agitation. After extensive washing, the immunoprecipitates were subjected to IB. For in vivo ubiquitination assays [38], denatured IP was conducted. In brief, cells were first solubilized in lysis buffer supplemented with 1% SDS and boiled for 10 min. The denatured lysates were diluted with lysis buffer (without SDS) followed by IP/IB as described above.
GST pulldown assay
GST pulldown assay was performed as previously described [31, 32]. Cells were extracted in NETN buffer [31, 32]. About 500-700 μg of cell lysates were mixed with 20 μl of glutathione agarose resin in NETN buffer with protease inhibitors. After extensive washing, the complexes were eluted with SDS sample buffer and detected by IB.
Expression and purification of GST-TUBE
Cultures of Escherichia coli BL21 (DE3) pLysS transformed with pGEX4T-1 or pGEX4T-1 containing GST-TUBE were grown at room temperature (RT) with shaking to an OD600 of 0.6. Isopropyl-D-thiogalactopyranoside (Beyotime) was then added to reach a final concentration of 0.5 mM. After an additional 12 h of growth, cells were harvested in GST binding buffer [38]. After sonication, Triton X-100 was added to reach a final concentration of 1%. The GST fusion proteins were adsorbed to glutathione agarose resin.
GST-TUBE assay
Linear Ub conjugates were purified from cell lysates using purified GST-TUBE [43]. Cells were harvested in NETN buffer supplemented with 5 mM N-ethylmaleimide and protease inhibitors. GST-TUBE (100 μg/ml) pre-bound to glutathione agarose beads were incubated with cell lysates. After extensive washing, the bound material was eluted with sample loading buffer.
Purification of HA-HIF1α and its mutants
HA-HIF1α and HA-HIF1αK362R were transiently expressed in HEK293T cells. HEK293 cells stably expressing HA-HIF1αPA and HA-HIF1αPAK362R were generated. Cells were extracted in buffer A (20 mM Tris [pH 7.5], 100 mM NaCl, 1 mM EDTA, and protease inhibitors). Cleared lysates were immunoprecipitated with anti-HA. The immunoprecipitates were washed sequentially with buffer B (20 mM Tris [pH7.5], 420 mM NaCl, 1.5 mM MgCl2, 0.2 mM EDTA, 25% glycerol, and protease inhibitors), buffer C (20 mM Tris [pH 7.5], 300 mM NaCl, 0.2 mM EDTA, 0.1% Igepal CA630, 20% glycerol, and protease inhibitors), and buffer D (50 mM Tris [pH7.5], 150 mM NaCl, and protease inhibitors). Samples were eluted with HA peptide (MCE) and the eluates concentrated by Amicon Ultra Centrifugal Filters.
in vitro linear ubiquitination assay
The purified HA-HIF1α, HA-HIF1αK362R, HA-HIF1αPA or HA-HIF1αPAK362R (1 μg each) protein was incubated at 37 °C for 2 h with 30 μl of a Ub conjugation reaction buffer supplemented with 500 ng of Ub, 200 ng of E1, 500 ng of E2 and 1 μg of E3. The HOIP RING-in-between-RING (RBR) and linear Ub chain determining region (LDD) region of HOIP (HOIP-RBR-LDD) was used as the E3 ligase [44]. All reagents were purchased from BostonBiochem. The reaction was stopped by adding 2 x loading buffer, followed by boiling. The level of linear ubiquitination was monitored by IB with anti-LUB9.
Chromatin immunoprecipitation (ChIP) assay
ChIP assay was conducted using the ChIP Kit (Beyotime) per the manufacturer’s protocol. Briefly, 1 × 10⁷ cells were cross-linked using 1% formaldehyde, quenched with glycine, lysed and sonicated to achieve a DNA shear length of 500 bp or so. Solubilized chromatin was diluted ten times in dilution buffer. Twenty microliters of the lysate were saved as the input control, and the remaining supernatant was incubated with anti-HIF1α or normal IgG as control overnight at 4 °C in the presence of protein A/G beads. After elution and reverse cross-linking, the eluted chromatin was treated with ribonuclease and proteinase K. Precipitated chromatin DNA was analyzed by qPCR. ChIP-qPCR primers were available upon request. All ChIP-qPCR data were normalized to those of IgG control, presented as fold enrichment and expressed as mean ± SEM. Student’s t-test for paired samples was used to determine statistical significance.
Enzyme linked immunosorbent assay (ELISA)
The levels of VEGF in cell culture medium were determined using the ELISA kit (Neobioscience) according to the manufacturer’s instructions. Culture media was collected from cells, cleared by centrifugation at 12,000 g for 5–10 min and analyzed.
Subcellular fractionation
Subcellular fractionation was performed using a Nuclear and Cytoplasmic Protein Extraction Kit (Beyotime) according to the manufacturer’s protocol with minor modifications. Cells were harvested, washed with PBS, and resuspended in Buffer A with protease inhibitors. After incubation for 15 min on ice, Buffer B was added and incubated on ice for an additional 1 min. The nuclei were separated by centrifugation at 14,000 g for 5 min at 4 °C. The supernatant was collected as cytosolic fraction. The pellet, containing the nuclei, was washed with PBS twice and then resuspended in radioimmune precipitation assay buffer (Millipore) containing 1 mM phenylmethylsulfonyl fluoride and protease inhibitor mixture for 10 min on ice. After centrifugation, the supernatant was collected as nuclear fraction. The cytosolic and nuclear fractions were analyzed by IB.
Immunofluorescence staining
Immunostaining was conducted as previously described [31, 37]. Cells were fixed in 4% paraformaldehyde for 10 min at RT, permeabilized in PBST (PBS containing 0.1% Triton X-100) for 5–10 min at RT, and blocked in PBS with 1% bovine serum albumin. Cells were incubated with an anti-HOIP (R&D systems, MAB8039) at 4 °C overnight, followed by incubation with fluorescein isothiocyanate conjugated anti-mouse IgG for 45 min at RT. Following extensive washing with PBST, cells were probed with rabbit anti-HIF1α overnight at 4 °C, followed by incubation with Texas Red-conjugated anti-rabbit IgG for 45 min at RT. Cells were visualized by a fluorescent microscope.
Confocal microscopy
For confocal microscopy, cells were co-transfected with plasmids expressing HOIP-EGFP, HIF1α-mCherry and Lamin B1-BFP. At 24 h of transfection, the cells were incubated in a cell culture environmental chamber (Tokai Hit, Japan) at 37 °C with 5% CO2. Images were acquired on an FV1000 confocal microscope (Olympus, Japan).
Cycloheximide chase experiment
Cycloheximide (CHX) chase experiment was conducted as previously described [31]. Briefly, cells were treated with 100 μM of CHX (Yeasen) for the indicated time points, when the cells were harvested and analyzed by IB.
Cell proliferation assay
Cell viability was determined by CCK8 assay using a commercial kit (Yeasen). Briefly, cells were seeded in 96-well plates (1×10³ cells/well) and treated as indicated in the figures. CCK8 was added into the wells for 3 h at indicated times. The absorbance in each well at wavelength of 450 nm (OD450) was measured with a Thermomax microplate reader.
Transwell migration and invasion assays
For the migration assay, a total of 5 × 10⁵ cells in 100 μl of serum free medium per well were plated in the chamber inserts of 24-well Transwell plates (8-μm pore size, Corning), with medium containing 10% FBS at the bottom of the insert. For invasion assay, the inserts were matrigel-coated prior to seeding cells (5 × 10⁵ cells in 100 μl of serum free medium per well). Cells were incubated for 16 h (for migration assay) or 20 h (for invasion assay) at 37 °C. The cells were fixed with 4% paraformaldehyde and stained with 0.1% crystal violet. Cells on the upper surface of the insert were removed with a cotton swab. The migrated or invaded cells were counted under the microscope and statistically analyzed.
Colony formation assay
Cancer cells were seeded in 6-well plates. Two weeks later, the cells were fixed with 4% paraformaldehyde and stained with 0.5% crystal violet solution. The cell colonies were counted and imaged.
Endothelial cell (EC) tube formation assay
Human umbilical vein endothelial cells (HUVECs) were seeded into 24-well plate at 1×10⁴ per well pre-coated with matrigel (Corning). HUVECs were exposed to the conditioned medium of cells in Medium 200 (Gibco) supplemented with 1% FBS and low-serum growth supplement (LSGS)(Gibco). The plate was then incubated at 37 °C for 6 h and examined under an inverted microscope (Leica, Germany). The total branching points were calculated using NIH ImageJ software. Cells between passages 3 and 7 were used in this study.
In vivo matrigel plug angiogenesis assay
All mouse procedures and experiments for this study were approved by the Institutional Animal Care and Use Committee of Renmin Hospital at the Hubei University of Medicine. Around 400 μl of matrigel in liquid form at 4 °C was mixed with equal volume of cells (1 × 10⁷ cells in PBS, and injected subcutaneously into of 6-week-old athymic nude mice). After 10 days, the mice were anesthetized by isoflurane and sacrificed. The plugs were removed and fixed with 10% formalin, embedded in paraffin, sectioned, and subjected to Masson’s trichrome staining or immune- staining with anti-CD31. Blood vessels were quantitated and statistically analyzed.
Immunohistochemistry
Formalin-fixed paraffin-embedded tissues of human lung cancers were obtained from the Department of Pathology, Hubei University of Medicine Renmin Hospital, with an informed consent from the patients. The study was approved by the Institutional Health Research Ethics Board of Hubei University of Medicine Renmin Hospital. Mouse tissues were fixed in 60% methanol and 10% acetic acid in H2O (vol/vol) and embedded in paraffin. Tissue sections (5 μm) were subjected to immunohistochemical staining as previously described [32]. The positive staining of VEGF in tumor tissues were expressed as the mean of integrated optical density (IOD). IOD was acquired by calculation of the ratio of medium pixel intensity to the positive staining area using Image-Pro Plus software. At least 20 random 40x fields per mouse and 4–5 mice per group were analyzed. Data in graphs were presented as mean ± SEM. For quantification of PCNA and CD31 immunostaining, we counted the PCNA-positive cells or vessel numbers based on CD31 staining of at least ten random 40x fields per mouse and 4–5 mice per group were analyzed, which were conducted manually or using the Cell Counter function in NIH ImageJ. We averaged the results over the number of counted fields. Data in graphs were presented as the mean ± SEM. To minimize artificial effects, cells in necrotic areas, with poor morphology, and in the margins of sections were not taken into account in our study. The immunostaining results were assessed independently by 2 individuals in a blinded fashion.
Tumor xenografts and tumor volume measurement
Six- to eight-week-old (18–20 g) female nude mice were purchased from Beijing Vital River Laboratory Animal Technology Co., Ltd (Beijing, China). Mice were randomly divided into two or three groups for each animal experiment. A total of 70 nude mice were used in our animal studies. The investigators were blinded to the group allocation during the experiment and/or when assessing the outcome. The animals that were injured, free of tumor, or died during the course of experiments were excluded from the analysis.
Xenograft transplantations were performed in a blind manner in nude mice according to the institutional guidelines and permissions for animal experiments, obtained from the regional authorities of the Hubei University of Medicine. 5 × 10⁵ cancer cells in 0.1 ml PBS were injected subcutaneously into the flanks of mice. Tumor dimensions were measured once when tumors were palpable. The tumor size was measured and the tumor volume was calculated using the formula: tumor volume = 0.5 × a2 × b (where a is the short tumor diameter and b is the long tumor diameter). At the end of the experiment, mice were anesthetized by isoflurane. The mice were perfused via the left ventricle with 0.9% saline supplemented with heparin (50 U/mL), followed by another perfusion with 4% paraformaldehyde solution. The tumors were harvested and embedded in paraffin or optimal cutting temperature compound (OCT) (Sakura) and frozen in −80 °C for cryostats tissue sectioning. Tumors dissociated were subjected to immunohistochemical and IB analyses.
Statistical analysis
Data analyses were conducted using GraphPad Prism 8.0 (GraphPad Software). Normal distribution was evaluated using the Shapiro-Wilk test. The variance was similar between the groups. Two-tailed Student’s t-test was applied to assess statistical differences between the 2 groups. Data are expressed as the mean ± SEM. The values of *p < 0.05 **p < 0.01 ***p < 0.001, and ****p < 0.0001 were considered statistically significant.


留言 (0)