
記住我


Inadvertent perioperative hypothermia (IPH) remains a clinical challenge for nurses caring for patients undergoing surgery (Russell et al., 2022). IPH is an identifiable and preventable condition (Ralph et al., 2020). All members of the surgical team, especially surgical nurses, have important roles with regard to preventing IPH throughout the perioperative period. The primary priority of nurses in preventing IPH is to treat symptoms; warm patients appropriately; and monitor patients before, during, and after surgery (De Mattia et al., 2013). Studies in the literature (Giuliano & Hendricks, 2017; Munday et al., 2019; Tamer & Karadağ, 2020) have reported insufficient awareness of IPH, lack of clarity regarding the definitions of hypothermia and normothermia, and a need to increase knowledge related to IPH management among nurses.
To effectively lead the perioperative team in interventions to prevent IPH, nurses should be aware of the demographic (e.g., age, gender) and operative (e.g., type of surgery, duration) factors that elevate the risk of IPH in patients. Identifying at-risk patients facilitates informed decision making regarding the frequency and method of temperature monitoring and determines what interventions (e.g., warm blankets, heating devices) should be used to help these patients maintain normothermia (Akers et al., 2019). Patients have the right to receive the highest possible quality of care, and nurses have a professional responsibility to ensure that patients receive this care (Healy et al., 2019).
Appropriate guidelines may be used to help prevent IPH and maintain normothermia. Clinical practice guidelines are systematically developed recommendations or statements designed to assist the practitioner and/or patient to make appropriate health decisions in specific clinical situations. Care based on evidence-based clinical practice guidelines has been recognized as a key component in improving the quality, safety, efficacy, and effectiveness of healthcare and has been reported to positively impact patient outcomes (Yang et al., 2022). Many guidelines have been developed in Turkey and around the world to prevent IPH in surgical patients. The American Society of PeriAnesthesia Nurses (2021), the National Institute of Clinical Evidence (2021), and the Association of periOperative Registered Nurses (2016) have published material that outlines various practices for maintaining normothermia throughout the perioperative period. In Turkey, the “Guidelines for the Prevention of Inadvertent Perioperative Hypothermia” was published in 2013 by the Turkish Society of Anesthesiology and Reanimation (2013), providing evidence on the subject and including application recommendations similar to other guidelines. However, this evidence is not currently used in healthcare institutions. Therefore, to prevent complications, it is important to establish and implement applicable protocols with proven effectiveness to guide healthcare professionals to prevent IPH. Therefore, this study was carried out to determine the effect of using the normothermia checklist (NC) developed for the prevention of IPH in surgical patients on time of awakening from anesthesia and coagulation disorder. This research was conducted to support the principle that the standardization of surgical nursing care increases quality of care. This is the only study known to the authors designed to evaluate recovery time from anesthesia in the nursing field in Turkey.
Methods Design, Participant, and SettingIn this randomized, controlled, prospective, experimental case–control study, data were collected in the general surgery clinic and operating room of Sivas Cumhuriyet University Research and Practice Hospital between October 10, 2019, and August 10, 2020. Patients who had undergone surgical intervention in the General Surgery Clinic of Sivas Cumhuriyet University Research and Practice Hospital, who met the inclusion criteria, and who agreed to participate were included in the study. The inclusion criteria were as follows: (a) elective surgery patients aged 18–65 years, (b) having an American Society of Anesthesiologists (ASA) score of I–II, and (c) being hospitalized for at least 24 hours after surgery. The exclusion criteria were as follows: (a) having a neurological, psychiatric, or neuromuscular disease; (b) being addicted to alcohol and/or drugs; (c) using medications that affect thermoregulation such as vasodilators; (d) having a history of thyroid disease; (e) having a cancer diagnosis; (f) being or suspected of being pregnant; and (g) having a fever and infection.
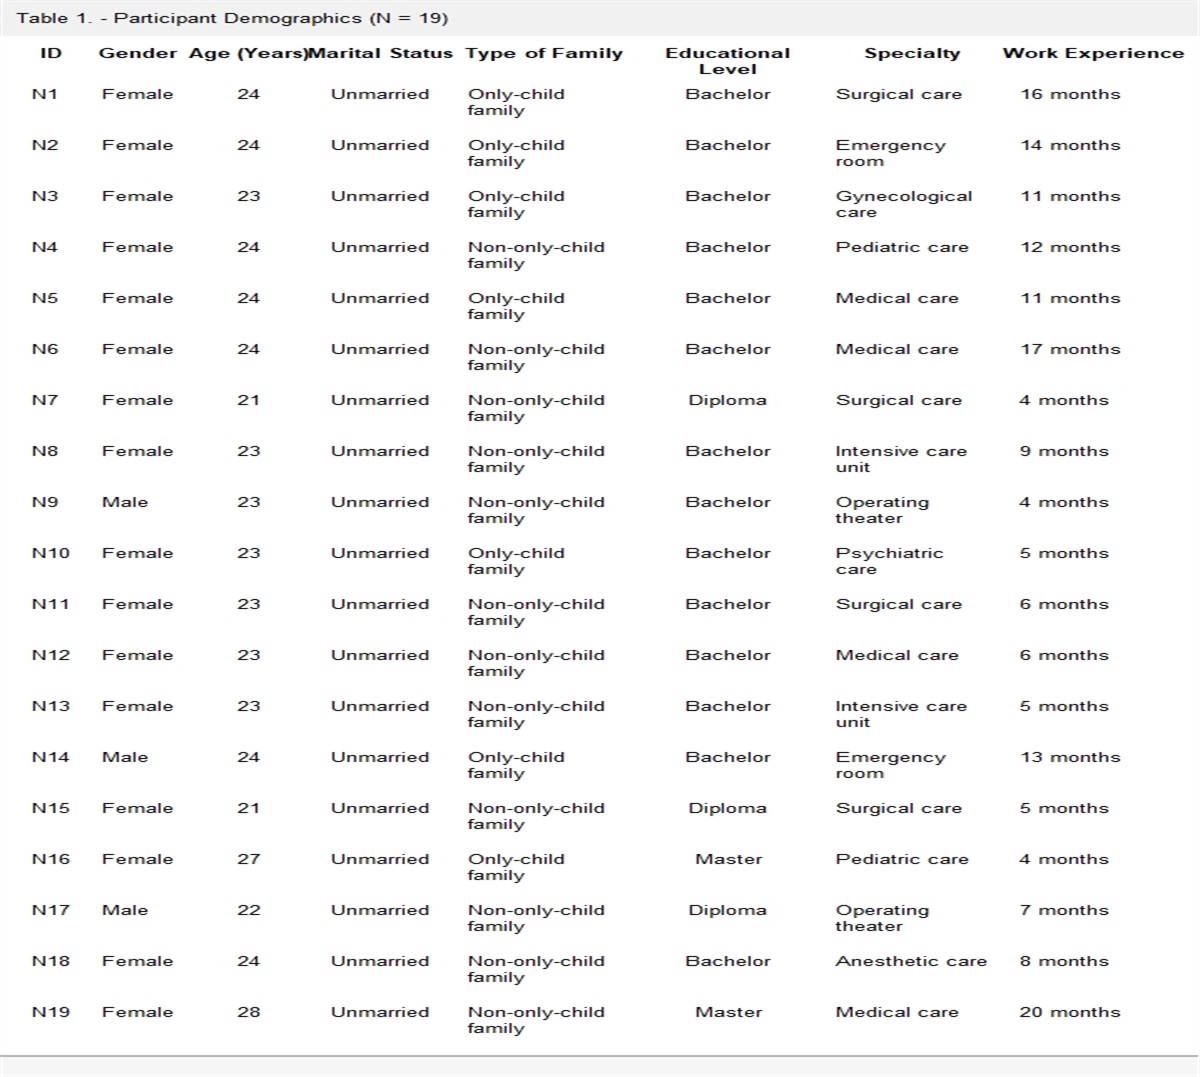
The sample size of the study was determined using the G*Power 3.1.9.7 program. In the power analysis, with α = .05, β = 0.10, 1 − β = 0.90, and effect size = 0.8, 30 individuals were respectively required for the experimental and control groups, with a power of 0.91 achieved. During the study period, patients who met the sampling inclusion criteria and were admitted to the clinic for elective surgery were stratified by gender and type of surgery and then randomized into blocks. Using a random-number table, the first patient was assigned to the experimental group, and subsequent patients were sampled until the layers and blocks were equalized in both groups. The study was completed with 60 patients, including 30 in the experimental group and 30 in the control group. To confirm the intergroup homogeneity after randomization, the two groups were compared using a chi-square test, with the results showing no statistically significant between-group difference (Table 1).
Table 1. - Comparison of Experimental and Control Groups in Terms of Demographic and Surgical Characteristics (N = 60) Descriptive Characteristic Experimental Group Control Group χ2 p n % n % Age (years) 0.30 .584 18–40 9 30.0 11 36.7 41–65 21 70.0 19 63.3 Body mass index (kg/m2) 0.07 .787 ≤ 25 11 36.7 10 33.3 > 25 19 63.3 20 66.7 Gender 1.09 .297 Female 15 50.0 19 63.3 Male 15 50.0 11 36.7 Diagnosis 0.00 1.000 Laparoscopic cholecystectomy 21 70.0 21 70.0 Bariatric surgery (sleeve gastrectomy) 3 10.0 3 10.0 Right inguinal hernia 3 10.0 3 10.0 Bilateral inguinal hernia 1 3.3 1 3.3 Hiatal hernia 1 3.3 1 3.3 Laparoscopic cholecystectomy + umbilical hernia 1 3.3 1 3.3 Chronic disease 0.08 .774 Yes 9 30.0 8 26.7 No 21 70.0 22 73.3 Type of chronic disease 4.94 .176 Diabetes mellitus 1 11.1 1 14.3 Hypertension 5 55.6 4 57.1 Asthma/chronic obstructive pulmonary disease 0 0.0 2 28.6 Diabetes mellitus + Hypertension 3 33.3 0 0.0 ASA score 0.34 .559 ASA I 21 70.0 23 76.7 ASA II 9 30.0 7 23.3 Premedication 0.00 1.000 Yes 1 3.3 1 3.3 No 29 96.7 29 96.7 Surgery time (minutes) 0.16 .921 30–60 3 10.0 3 10.0 61–120 23 76.7 24 80.0 > 120 4 13.3 3 10.0 Development of hypothermia 6.00 < .001** Yes 0 0.0 30 100.0 No 30 100.0 0 0.0 Hypothermia level Mild (34°C–36°C) 0 0.0 30 100.0 M SD M SD t p Age (years) 43.73 11.18 44.60 8.78 0.33 .740 Body mass index 30.07 8.36 30.16 6.27 0.08 .963Note. ASA = American Society of Anesthesiologists.
**p < .001.
Two data collection tools were used in the study.
Questionnaire formThe two-part questionnaire was prepared after referencing the hypothermia risk factors cited in the literature (Collins et al., 2019; Healy et al., 2019). The first part included nine questions gathering information on the respondent's age, gender, diagnosis, body mass index (BMI), chronic disease history, ASA score, premedication status, and operation time. The second part collected data on time of awakening from anesthesia and presurgery and postsurgery laboratory findings related to coagulation status.
Normothermia checklistThe NC, comprising five parts, was created in line with guidelines developed by the Association of periOperative Registered Nurses, American Society of PeriAnesthesia Nurses, National Institute of Clinical Evidence, and Turkish Society of Anesthesiology and Reanimation. The NC included nursing interventions used to prevent IPH and maintain normothermia that should be applied for 24 hours during the preoperative clinic, preparation unit, operating room, postoperative anesthesia care unit (PACU), and postoperative clinic periods. The original version of the checklist may be obtained from the corresponding author. The interventions included in the NC are detailed below:
1. In the preoperative clinicThe temperature of the patient's room is measured with a thermometer. The patient's body temperature (BT) is measured temporarily. If the BT is below 36°C, active heating is provided, and if it is above 36°C, passive isolation methods are used to maintain normothermia. Patients with BT below 36°C are monitored at 15-minute intervals, whereas those with BT above 36°C are monitored at 4-hour intervals. After achieving normothermia, patients are sent to the operating room.
2. In the preparation roomPatients are sent from the clinic to the preparation room at least 20 minutes before surgery. The temperature of the preparation room is measured with a thermometer, and the patient's BT is measured temporarily. If the BT is below 36°C, active heating is provided, and if it is above 36°C, passive isolation methods are used to maintain normothermia. Patients with BT above 36°C are taken to the operating room.
3. In the operating roomThe operating room temperature is measured with a thermometer. The patient's BT is measured temporarily. If it is above 36°C, anesthesia induction is started, and if it is below 36°C, anesthesia induction is delayed until normothermia is achieved. If the intravenous (IV) fluids, blood, and blood products to be administered to the patient exceeds 1,000 ml, all irrigation fluids are heated to 38°C–40°C. At-risk patients are actively warmed, even if the intervention takes less than 30 minutes. The BT of the patient is measured from the lower end of the esophagus in the operating room and is monitored temporarily at 15-minute intervals.
4. In the postoperative anesthesia care unitPACU temperature is measured with a thermometer, and the patient's BT is measured temporarily. If the BT is above 36°C and other transfer conditions are met (e.g., conscious, other vital signs are normal), they are transferred to the clinic. If the BT is below 36°C, patients are transferred to the clinic after achieving normothermia with an active warming method.
5. In the postoperative clinic (within the first 24 hours)The temperature of the patient's room is measured with a thermometer, and BT is measured temporarily. When the patient comes to the clinic, their clothes are put on. The BT of the patient is measured every 15 minutes in the first hour, every 30 minutes in the second hour, and at 1-hour intervals thereafter. If the BT is below 36°C, active heating is provided, and if it is above 36°C, passive isolation methods are used to maintain normothermia. Patients with BT below 36°C are monitored at 15-minute intervals, whereas those with BT above 36°C are monitored at 4-hour intervals.
The details of this study were explained to the participants, and written consent was obtained. The patients in the experimental and control groups were composed of individuals with similar characteristics in terms of medical diagnosis and gender. After applying interventions in line with the checklist, the participants were evaluated in terms of coagulation disorder status and degree of difficulty experienced in awakening from anesthesia. The NC form was applied only to the experimental group. The experimental group having a lower rate of coagulation disorders and less difficulty in awakening from anesthesia was defined as the indicator of NC effectiveness. The suitability of NC applied by the researcher for surgical patients and its applicability to institutions were also evaluated. In this study, blood was only taken from the patients in line with routine practice, and test results available in the patient's file (prothrombin time [PT], activated partial thromboplastin time [aPTT], international normalized ratio [INR], platelet [PLT], hematocrit [HCT], hemoglobin [Hg], serum calcium [Ca+2]) were evaluated and recorded. Time of awakening from anesthesia was measured in minutes after administering Bridion 200 mg/2 ml (active ingredient: sugammadex) IV to ensure standardization, terminate the anesthetic gas given to the patient, and restore the patient's muscle functions. A temporal temperature-measuring device was used to monitor the patient's BT during data collection. The literature lacks consensus regarding the optimal temperature-measuring device for patients (Erdling & Johansson, 2015; Gabriel et al., 2019). The usability and accuracy of the device are important for its suitability for regular use. In addition, it should be possible to use it for the entire perioperative period, which covers before, during, and after surgery (Gabriel et al., 2019). Therefore, in this study, a temporal thermometer device was used because it is portable, has no calibration problems, and does not pose a problem in terms of patient comfort.
Experimental group participants were warmed using the active heating technique with a forced-air warming system and a forced-air warming blanket. A heating device was used concurrently to heat IV fluids and irrigation fluids. In this study, IPH prevention standards were not implemented because of a lack of sufficient materials and health workers in the study hospital. Participants in the control group received standard care involving passive isolation methods; these methods encompass the patient being covered with blankets in the PACU, being allowed to dress in their own clothes and socks after transfer to the patient room, and being covered with a blanket. A portable room thermometer was used to measure the ambient temperature for both groups. All of the patients were anesthetized intravenously and administered the same drugs based on their weight as measured in kilograms. The drugs that were administered to the patients included a Pentothal vial (active ingredient: sodium thiopental) 4 mg/kg, a fentanyl citrate ampoule (active ingredient: fentanyl) 2 mcg/kg, and a brown vial (active ingredient: rocuronium bromide) 0.1 mg/kg. All of the procedures on the NC checklist were made by the first author of the study. To ensure that measurements were unbiased, the records were taken by the anesthesia technician, who was a member of the surgical team.
Ethical ConsiderationsBefore starting the study, permission was obtained from the Sivas Cumhuriyet University Clinical Research Ethics Committee (93596471-010.99-E.30220).
Statistical AnalysisStatistical analysis was performed using SPSS for Windows 22.0 (IBM Inc., Armonk, NY, USA). The descriptive statistics were analyzed, and the number and percentage distribution were determined. In terms of skewness and kurtosis, the scores for all of the variables except for the minimum intraoperative BT variable were found to be insignificant, with p > .05. As a result, parametric analysis was applied to the data. Chi-square test and t test were used on numerical data to assess differences between the experimental and control groups in terms of descriptive properties. The chi-square test and Mann–Whitney U test were used to determine the developmental status of IPH between the groups and the risk factors for IPH in the control group. Logistic regression analysis was used to determine the probabilities (risk coefficients) of risk factors in the development of IPH, with the level of significance defined as p < .05.
Research HypothesesThe following are this study's hypotheses:
H0a: Interventions following the NC do not positively affect time of awakening from anesthesia. H0b: Interventions following the NC do not positively affect risk of coagulation disorder. H1a: Interventions following the NC positively affect time of awakening from anesthesia. H1b: Interventions following the NC positively affect risk of coagulation disorder. Results Participant DemographicsDemographic and surgical characteristics in the experimental and control groups are compared in Table 1. Seventy percent of the experimental group and 63.3% of the control group were aged 41–65 years. The mean age was 43.73 (SD = 11.18) years in the experimental group and 44.60 (SD = 8.78) years in the control group, with a statistically insignificant difference (t = .33, p = .740). Half (50%) of the experimental group and 63.3% of the control group were female. Between-group differences in demographic data were insignificant with the exception of hypothermia development (p > .05). None in the experimental group developed IPH, and 100% of the controls developed IPH, which was a statistically significant difference (χ2 = 6.00, p < .001). These findings indicate a difference between the experimental and control groups in terms of developing hypothermia, with all in the control group developing mild hypothermia (34°C–36°C).
Time of Awakening From AnesthesiaIn terms of mean time of awakening from anesthesia, the experimental group took 3.77 (SD = 1.10) minutes and the control group took 11.03 (SD = 2.51) minutes, indicating a statistically significant difference (t = 14.51, p < .001) in favor of the experimental group.
Laboratory Test InformationChanges in blood values before and after the operation for both groups are compared in Table 2. No significant between-group difference was found in terms of PT, aPTT, INR, PLT, HCT, Hg, and Ca+2 values during the preoperative period. In the postoperative period, no significant between-group difference was found in terms of PT, aPTT, PLT, and HCT, and a significant between-group difference (p < .05) was found in terms of INR, Hg, and Ca+2. Thus, a difference in favor of the experimental group in terms of INR, Hg, and Ca+2 was found after surgery. The differences between preoperative and postoperative PT and aPTT values in the experimental group were statistically insignificant (p > .05). However, the differences between preoperative and postoperative INR, PLT, HCT, Hg, and Ca+2 values in the experimental group were statistically significant (p < .05), showing a difference in favor of the posttest based on the PLT values and against the posttest based on the preoperative and postoperative INR, HCT, Hg, and Ca+2 values in the experimental group. The differences between preoperative and postoperative PT, aPTT, INR, PLT, HCT, Hg, and Ca+2 values in the control group were statistically significant (p < .05). These findings show that the control group differed from the posttest in terms of preoperative and postoperative PT, aPTT, INR, PLT, HCT, Hg, and Ca+2 values.
Table 2. - The Comparison of Experimental and Control Groups in Terms of Changes in Laboratory Findings Related to Preoperative and Postoperative Coagulation (N = 60) Laboratory Tests Related to Coagulation Pre-op Post-op EG CG EG CG t p EG CG t p Pretest–Posttest Pretest–Posttest M SD M SD M SD M SD t p t p PT (sec.) 12.20 0.72 11.97 0.79 1.20 .235 12.40 0.93 12.50 0.95 −0.43 .672 −1.74 .092 −3.36 .002* aPTT (sec.) 25.57 4.44 27.47 5.07 −1.55 .127 26.52 3.86 28.29 5.47 −1.45 .153 −1.49 .147 −2.27 .031* INR 1.05 0.06 1.04 0.06 0.67 .504 1.13 0.07 1.26 0.08 6.60 < .001** −6.20 < .001** −13.03 < .001** PLT (1000/μL) 268.81 54.26 290.17 86.26 −1.15 .255 249.30 55.57 242.17 66.23 0.45 .653 7.58 < .001** 5.44 < .001* HCT (%) 43.28 4.90 42.69 4.47 0.48 .632 40.52 4.65 38.04 5.86 1.82 .074 6.81 < .001** 7.35 < .001** Hg (g/dL) 14.38 1.71 14.03 1.85 0.78 .441 13.85 2.08 12.29 1.93 3.01 .004* 2.38 .024* 14.16 < .001** Ca+2 (mg/dL) 9.31 0.40 9.11 0.49 1.66 .103 8.90 0.40 8.15 0.53 6.12 < .001** 5.93 < .001** 12.16 < .001**Note. Pre-op = preoperative laboratory findings; Post-op = postoperative laboratory findings; EG = experimental group; CG = control group; PT = prothrombin time; aPTT = activated partial thromboplastin time; INR = international normalized ratio; PLT = platelet; HCT = hematocrit; Hg = hemoglobin; Ca+2 = serum calcium.
*p < .05. **p < .001.
Hypothermia development status is compared based on participant introductory characteristics in Table 3. Two thirds (63.3%) of the participants who developed IPH and 70% of those who did not develop IPH were 41–65 years old. The difference between the groups (χ2 = 0.30, p = .584) was found to be statistically insignificant. According to the risk ratio, the rate of IPH development was 1.2 times higher in those aged 18–40 years. The BMI of 66.7% of the participants who developed IPH and 63.3% of those who did not develop IPH was > 25 kg/m2. The difference between the groups was found to be statistically insignificant (χ2 = 0.07, p = .787). These findings indicate that BMI is not a predictor of IPH development risk, with the risk of IPH development 1.1 times higher in the participants with BMI > 25 kg/m2. Two thirds (63.3%) of the participants who developed IPH and 50% of those who did not develop IPH were women. The gender characteristic was found to be statistically insignificant in between-group differences (χ2 = 1.09, p = .297), with the risk of IPH development in women 1.3 times higher than in men. The difference between the diagnoses of participants with and without IPH was statistically insignificant (χ2 = 0.00, p = 1.000). Three quarters (73.3%) of the participants who developed IPH and 70% of those who did not develop IPH had no chronic disease, which is a statistically insignificant difference (χ2 = 0.08, p = .774). The risk of developing IPH in individuals with chronic disease was 1 time higher compared with those without. Thus, the difference between the participants who developed IPH and those who did not develop IPH in terms of chronic disease types was statistically insignificant (χ2 = 4.94, p = .176). Three quarters (76.7%) of the participants who developed IPH and 70% of those who did not develop IPH were in the ASA I class, indicating a statistically insignificant between-group difference (χ2 = 0.34, p = .559). Thus, the risk of IPH development was 1.1 times higher in those with ASA I. The difference between patients who developed IPH and those who did not develop IPH in terms of premedication status was found to be statistically (χ2 = 0.00, p = 1.000) insignificant. These findings indicate that premedication status is not a predictor of IPH development risk.
Table 3. - Comparison of Patients in Terms of Development of Hypothermia, by Descriptive Characteristics (N = 60) Descriptive Characteristic Hypothermia Development Status χ2 p Odds Ratio Developed Not Developed n % n % Age (years) 0.30 .584 1.22 18–40 11 36.7
留言 (0)