
記住我

Primary liver cancer is the sixth most prevalent cancer worldwide (World Health Organization, 2020) and the fourth and sixth most prevalent cancer in men and women, respectively, in Taiwan. Hepatocellular carcinoma (HCC) accounts for 85% of primary liver cancers in Taiwan and is highly associated with chronic liver disease (Health Promotion Administration, Ministry of Health and Welfare, Taiwan, 2022). Although surgical resection provides the best chance for survival, most patients are not eligible because of the extent of their tumor or underlying liver dysfunction (Abdalla et al., 2023).
Radiation therapy (RT) has emerged as an alternative treatment approach and as part of combination therapy for patients with incurable HCC (Yoo et al., 2018). As a palliative treatment, RT has been shown to be more therapeutically beneficial than other palliative options (Hammad et al., 2017). Furthermore, RT has shown significant potential to become the main treatment for HCC (Chen et al., 2021).
Although advances in RT technology have improved the survival rate for patients with advanced HCC, the side effects associated with related treatments have not been widely examined. Fatigue is one of the most common and distressful side effects of RT (Körner et al., 2017; Patel et al., 2022), with up to 65.7% of patients treated with palliative radiotherapy experiencing fatigue (Körner et al., 2017). Fatigue has been clinically underestimated, underdiagnosed, and undertreated (National Comprehensive Cancer Network [NCCN], 2023). Unresolved fatigue may negatively impact the work (Wolvers et al., 2018), mood, and daily activities of sufferers, leading to decreased quality of life (Abrahams et al., 2018). The results of a systematic review identified poor performance status, female gender, neuroticism, pain, depression, and insomnia as risk factors of cancer-related fatigue (Ma et al., 2020). However, these findings were mainly based on the experiences of patients with breast and prostate cancers. For patients with HCC or liver cancer in general, significant predictors of fatigue intensity have been reported in only one study. These included educational level, sleep disturbance, depressive status, and symptom distress (Lai et al., 2007).
Fatigue is a dynamic phenomenon that changes over time (NCCN, 2023). Qualitative research has found that some participants lack understanding of fatigue and believe their only option is to accept fatigue and that they should work to avoid fatigue-related thoughts (Dong et al., 2021). Identifying long-term changes in fatigue can help healthcare providers better understand the course of fatigue and inform the appropriate timing of nursing interventions. However, the change in fatigue over time in patients with liver cancer receiving RT has been investigated in only a few studies (Hasan et al., 2019; Klein et al., 2015), with the findings indicating that fatigue improves with time in most patients after completion of RT (Hasan et al., 2019; Klein et al., 2015) but remains high in those with poorer liver functions (Klein et al., 2015). Although the change of fatigue in patients with liver cancer receiving RT was explored in the abovementioned studies, none has examined how fatigue has changed from preradiation (baseline) through RT administration and into the posttreatment period.
Given the potential benefit of RT to HCC patient survival, understanding the change in radiation-related fatigue over time is essential. Therefore, this study was designed to explore the change in fatigue over time in patients with HCC receiving radiotherapy and related factors using a longitudinal design.
Methods Design, Participants, and SettingsIn this study, a prospective longitudinal design was used to examine the changes in fatigue over time in patients with HCC receiving radiotherapy. Participants were recruited from among radiation oncology outpatients visiting a medical center in Taiwan between November 2015 and March 2018. Inclusion criteria were individuals who (a) were over 20 years old, (b) were diagnosed with HCC, (c) were scheduled to receive radiotherapy, (d) scored < 3 on the Eastern Cooperative Oncology Group Performance Status (ECOG-PS) scale, (e) were able to read or communicate in Mandarin/Taiwanese, and (f) scored ≥ 24 on the Mini-Mental State Examination (MMSE). Patients with extrahepatic radiotherapy were excluded. The RT patients enrolled were receiving intensity-modulated RT, stereotactic body RT, or proton beam therapy (PBT). Intensity-modulated RT was delivered in 10–25 fractions five times per week for 2–6 weeks, with a cumulative irradiation dose of 2,500–6,000 cGy; stereotactic body RT was delivered in 5 fractions every other day for 2 weeks, with a cumulative radiation dose of 4,000–5,000 cGy; and PBT was delivered in 10–22 fractions five times per week for 2–5 weeks, with a cumulative dose of 4,840–7,260 cGy (Department of Radiation Oncology, Chang Gung Memorial Hospital, 2017), with adjustments to dose and fraction numbers made by clinical radiologists based on liver tolerance and liver tumor location.
MeasuresThe MMSE scale was used to screen patients for inclusion. Demographic characteristics (i.e., gender, age, education, religious beliefs, occupation, marital status, economic status, and living habits) and clinical information (i.e., disease stage, ECOG-PS scores, degree of cirrhosis, comorbidities, type of radiotherapy, target area of radiotherapy, total dose of radiotherapy, number of radiotherapies, and the use of concomitant therapies) were collected using a self-developed form. Symptoms were assessed using the Functional Assessment of Chronic Illness Therapy-Fatigue scale (FACIT-F scale), Brief Pain Inventory-Short Form (BPI-SF), and psychological subscale of the Memorial Symptom Assessment Scale-Short Form (MSAS-SF). Fatigue and related symptoms were measured before radiotherapy (T0), during radiotherapy (T1), and 1 month (T2), 3 months (T3), and 6 months (T4) after completing radiotherapy.
The mini-mental status examinationThe MMSE is a cognitive screening test used widely in clinical and research (Folstein et al., 1975). The 30-item MMSE deals with orientation, attention and calculation, short-term memory, language, visuospatial abilities, and the ability to understand and following instructions. Each correct response to an item earns 1 point, and the total possible score for the instrument ranges from 0 to 30. According to a systematic review, the MMSE has pooled sensitivity of .89 and specificity of .89 to detect dementia using a cutoff of either 23 or 24 (Patnode et al., 2020). In this study, the internal reliability of the MMSE was .57 because of the high homogeneity within the sample, with 96% of the participants scoring above 24.
Eastern cooperative oncology group performance statusThe ECOG-PS was used in this study to assess performance status. This scale ranks performance status from 0 to 5, with 0 = fully active, 1 = restricted in physically strenuous activity but ambulatory and able to carry out light work, 2 = ambulatory and capable of all self-care but limited in work activities, 3 = capable of only limited self-care, 4 = completely disabled, and 5 = dead (Oken et al., 1982). The ECOG-PS is regularly used as a staging factor and prognostic predictor for HCC (Reig et al., 2022).
Functional assessment of chronic illness therapy-fatigue scaleThe 13-item FACIT-F scale was designed to assess fatigue and its effects on daily activities in patients with chronic illnesses or cancer. Each item is rated on a 0–4 scale (0 = not at all, 1 = a little bit, 2 = somewhat, 3 = quite a bit, 4 = very much), and the total possible score for the scale ranges from 0 to 52, with higher scores indicating greater fatigue (Yellen et al., 1997). The internal consistency reliability for the FACIT-F scale in this study was good, with a Cronbach's α of .91.
Memorial symptom assessment scale-short formThe MSAS-SF was developed to assess distress for 28 symptoms and frequency for four symptoms. Distress is rated on a scale of 0–4 (0 = not at all, 4 = very much), whereas frequency is rated between 1 and 4 (1 = rarely, 4 = almost constantly). Four summary scores may be generated from the MSAS-SF, including the physical symptom subscale score (12 items), the psychological symptom subscale score (six items), the global distress index (10 prevalent symptom items), and the Memorial Symptom Assessment Scale total score. The MSAS-SF has good internal consistency reliability (Cronbach's α between .76 and .82 for subscales; .87 for the Memorial Symptom Assessment Scale total score) and good convergence validity (Chang et al., 2000). In this study, the psychological symptom subscale score (PSYCH; including worrying, feeling sad, feeling nervous, difficulty sleeping, feeling irritable, and difficulty concentrating) was used to indicate psychological symptom distress. The original score was transformed into a 0–4 range, with higher scores indicating a higher distress level associated with psychological symptoms. In this study, the internal consistency reliability of the PSYCH was good, with a Cronbach's α of .76.
The brief pain inventory-short formThe BPI-SF (Cleeland, 1985) consists of four parts, namely, pain location; worst, least, average, and current pain intensity (severity); percentage of pain relief after treatment; and the extent to which pain interferes with daily activities. Pain intensity and interference items are rated on a 0–10 scale with 0 indicating “no pain” or “does not interfere” and 10 indicating “pain as bad as you can imagine” or “completely interferes.” The Chinese version of the BPI-SF used in this study was evaluated as having good reliability and validity (Ger et al., 1999). The internal consistencies of the severity and interference scales of the Brief Pain Inventory in this study were good, with Cronbach's α values of .77 and .92, respectively. In this study, pain severity was determined using the average pain intensity score on the BPI-SF.
ProceduresData were collected via an electronic questionnaire hosted on a patient-reported outcomes website developed as a part of this project. A research assistant used a touch-screen tablet with internet access to administer the questionnaire. After the research assistant logged into the system, participants responded to each question on the questionnaire either by using the touch screen or by giving verbal responses after the research assistant reads out each question and the associated response options.
Ethical ConsiderationsThis study was reviewed and approved by the institutional review board of Chang Gung Memorial Hospital (Approval No. 102-5528B). Informed consent was obtained from all of the participants.
Data AnalysisDescriptive statistics were used to summarize the distribution of demographic and clinical characteristics as well as symptom scores. The fatigue data measured weekly during radiotherapy were averaged and used as the during treatment fatigue (T1) value. Change in fatigue over time was evaluated using five data points (T0–T4) and was examined using generalized estimating equations (GEE), with time used as a repeated categorical factor. The working correlation used in the GEE analysis was “first-order autoregressive.” Potential factors influencing fatigue were identified using a series of bivariate GEE, with time included in the model. Factors with p values less than .25 from the bivariate linear regression of GEE analyses were entered into a multivariate GEE model (Bursac et al., 2008). Pain and psychological distress were measured concurrently with fatigue and were thus treated as time-variate variables. GEE was chosen because this approach accounts for correlated repeated data and accommodates missing values because of attrition (de Melo et al., 2022).
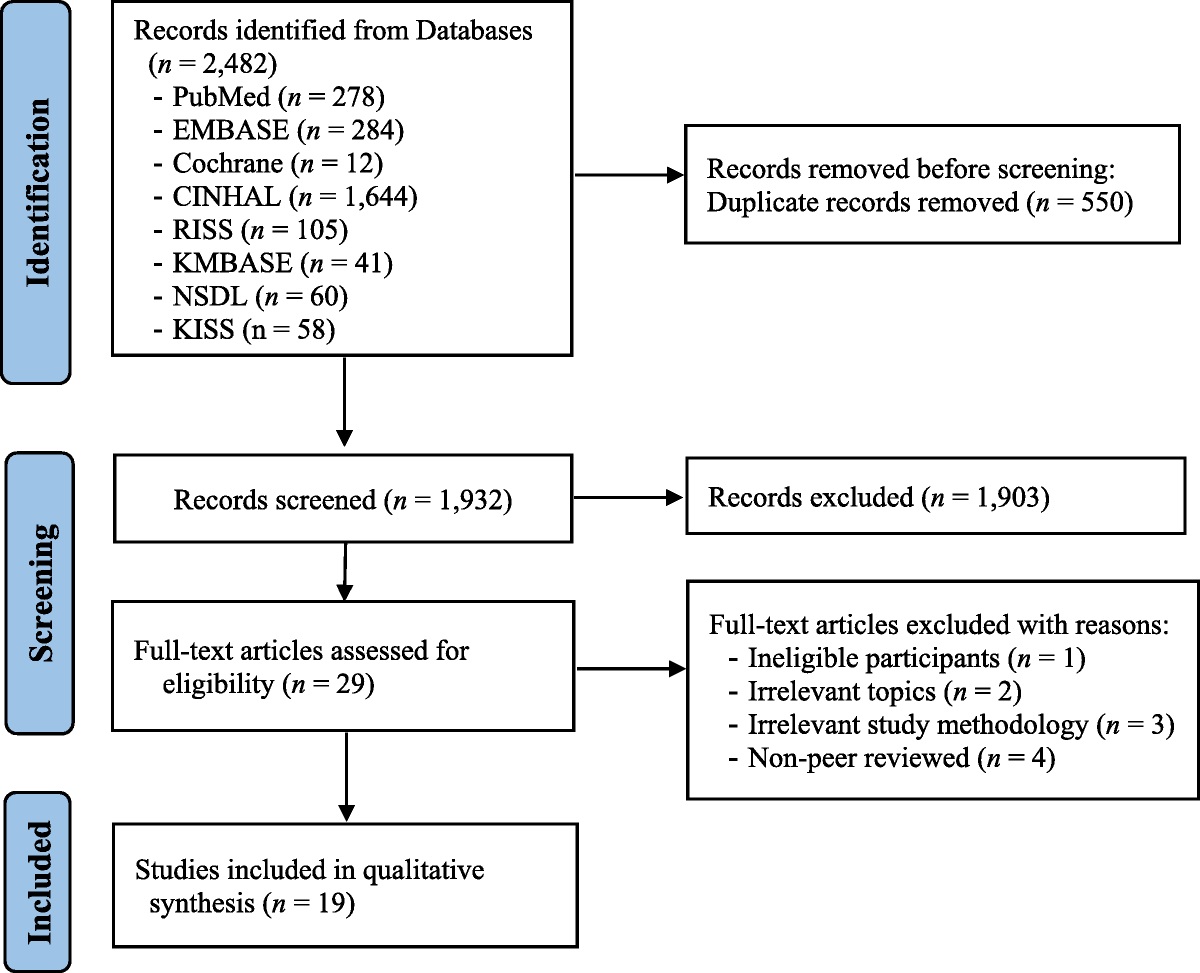
ResultsOf the 111 qualified patients with HCC, seven were excluded from the analysis because of withdrawal from the study before T1 (n = 7), and four were excluded because of interruptions in RT treatment, leaving data from 100 participants available for analysis at T1. The numbers of participants available for posttreatment analysis at T2, T3, and T4 were, respectively, 87, 80, and 72.
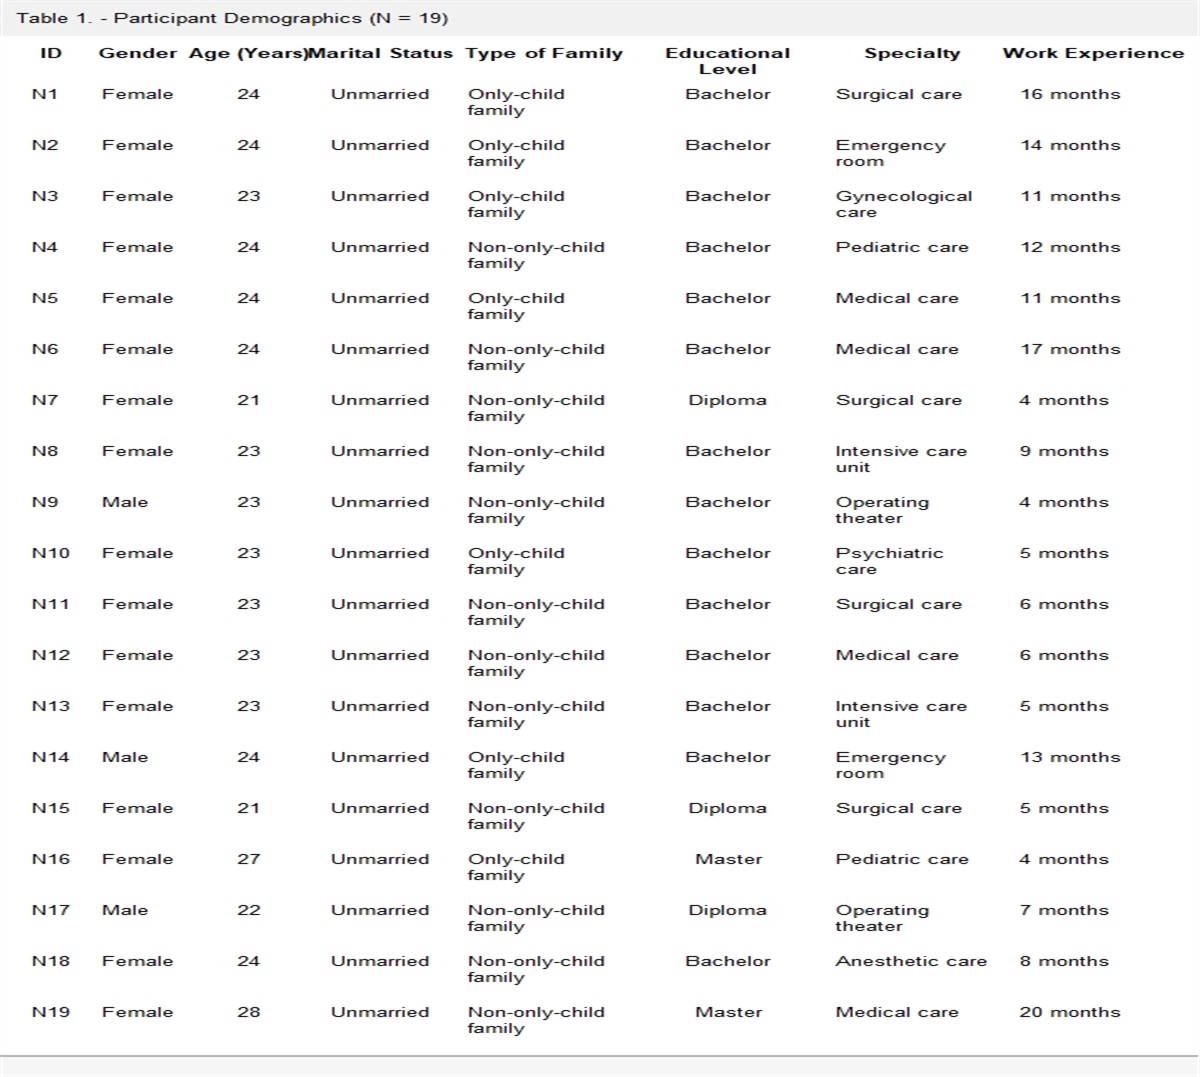
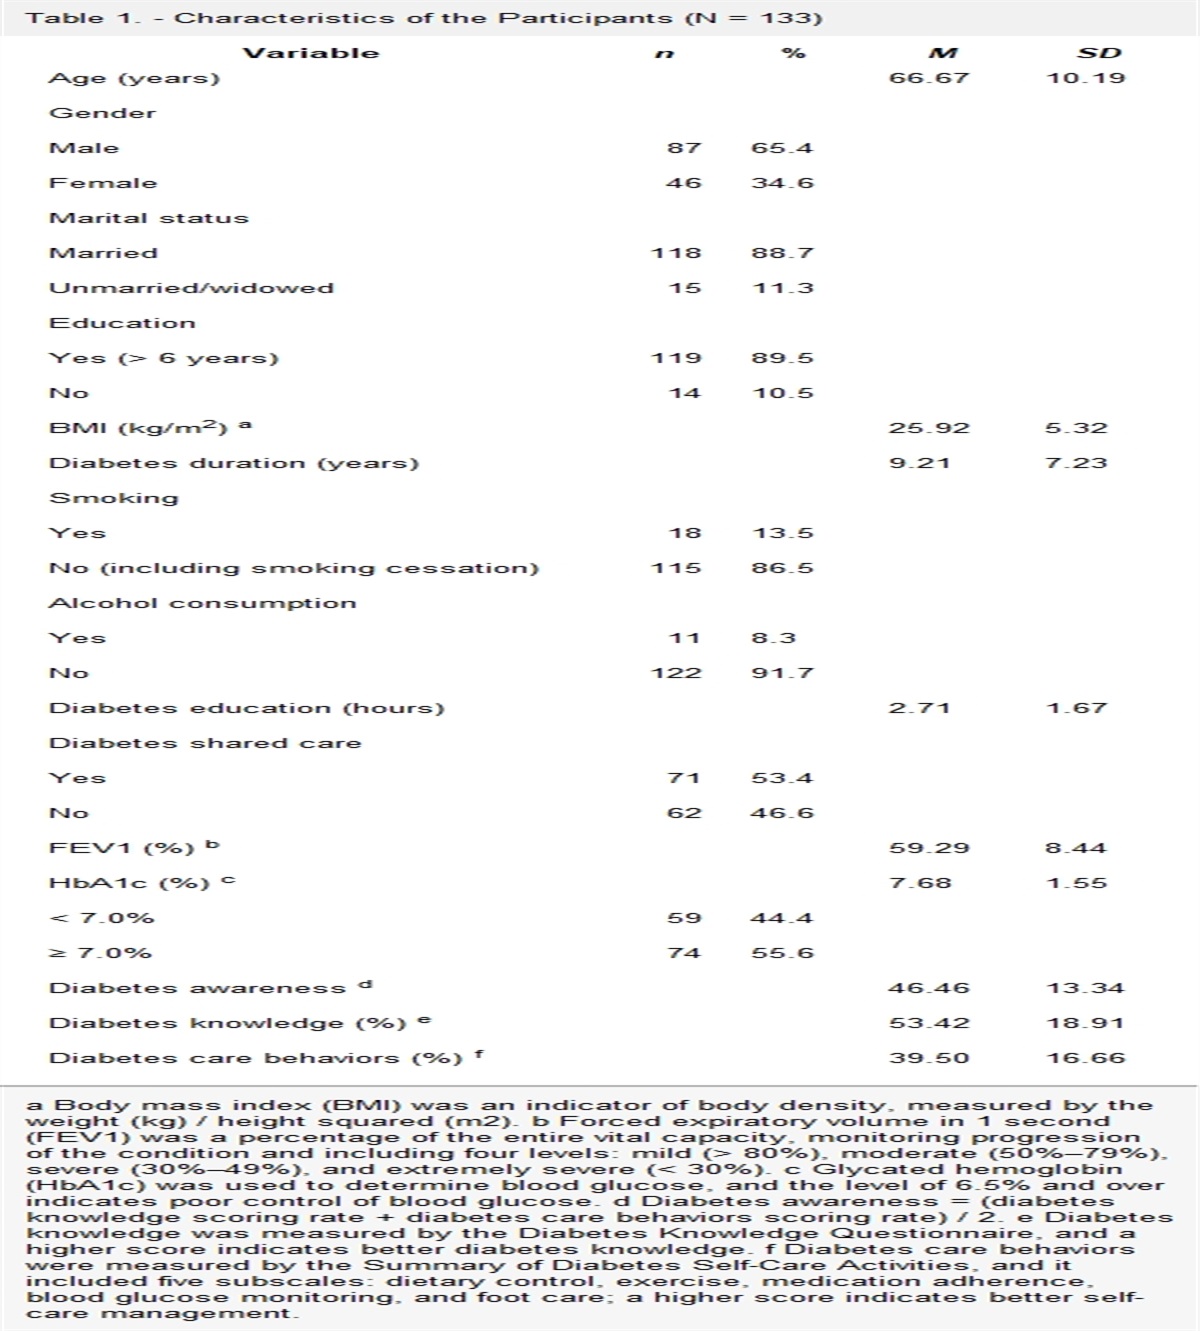
Sample CharacteristicsThe sample was predominantly male (84%), and the mean age was 62.89 (SD = 10.89) years. The educational level was low, with 80% holding less than a college degree. Nearly all were married or had partners (94%), most held religious beliefs (79%), and over 60% were currently not employed. For all patients included in this study, most patients were earning a monthly income below TWD 30,000 (66%). Fewer than half (42%) were never smokers, and over half were either former or current smokers (58%). Most patients self-reported as not consuming alcohol (66%) or betel nuts (80%; Table 1).
Table 1. - Participant Characteristics (N = 100) Item n % Mean SD Range Age (years) 100 100 62.89 10.89 36–84 Gender Male 84 84 Female 16 16 Educational level < College degree 80 80 ≥ College degree 20 20 Marital status Without a spouse/ partner 6 6 With a spouse/ partner 94 94 Religion No 21 21 Yes 79 79 Working status (after getting sick) Resigned 22 22 Continue working 36 36 Not previously employed 42 42 Personal income (NTD/month) < 30,000 66 66 30,000–60,000 16 16 > 60,000 13 13 N/A 5 5 Smoking status Never smoker 42 42 Former or current smoker 58 58 Drinking habit No 66 66 Yes 34 34 Betel nut chewing habit No 80 80 Yes 20 20 Type of radiation therapy Photon IMRT 12 12 Photon SBRT 17 17 Proton (PBT) 71 71 Tumor size (cm) 100 100 3.60 0.87 2–5 BCLC stage 0 or A or B 27 27 C or D 73 73 ECOG-PS Grade 0 49 49 Grade 1 or 2 51 51 Child–Pugh score Class A 91 91 Class B or C 9 9 Chronic hepatitis No 6 6 Yes 94 94 Comorbidity No 53 53 Yes 47 47 Fraction numbers 100 100 16.74 7.06 5–25 Photon IMRT 12 12 13.75 5.69 10–25 Photon SBRT 17 17 5.00 0.00 5 Proton (PBT) 71 71 20.00 4.39 10–22 Total radiation dose (cGy) 100 100 6,351 1,224 2,500–7,260 < 4,000 6 6 4,001–5,999 26 26 6,000–7,260 68 68Note. NTD = New Taiwan dollar; IMRT = intensity-modulated radiation therapy; SBRT = stereotactic body radiation therapy; PBT = proton beam therapy; BCLC = Barcelona Clinic Liver Cancer; ECOG-PS = Eastern Cooperative Oncology Group Performance Status; cGy = centigray.
Most of the participants received PBT (71%). The average tumor size was 3.60 cm (SD = 0.87). Most were in Stage C or D (73%) based on the Barcelona Clinic Liver Cancer staging, half (51%) had Grades 1 or 2 functional status based on the ECOG-PS, and Child–Pugh scores were predominantly at Grade A (91%). Most had chronic hepatitis (94%), and slightly more than half had no comorbidities (53%). The mean number of radiotherapy fraction was 16.74 (SD = 7.06). Over two thirds of the participants (68%) had received a total radiation dose of 6,000–7,260 cGy, with the mean dose at 6,351 (SD = 1224.38) cGy (Table 1).
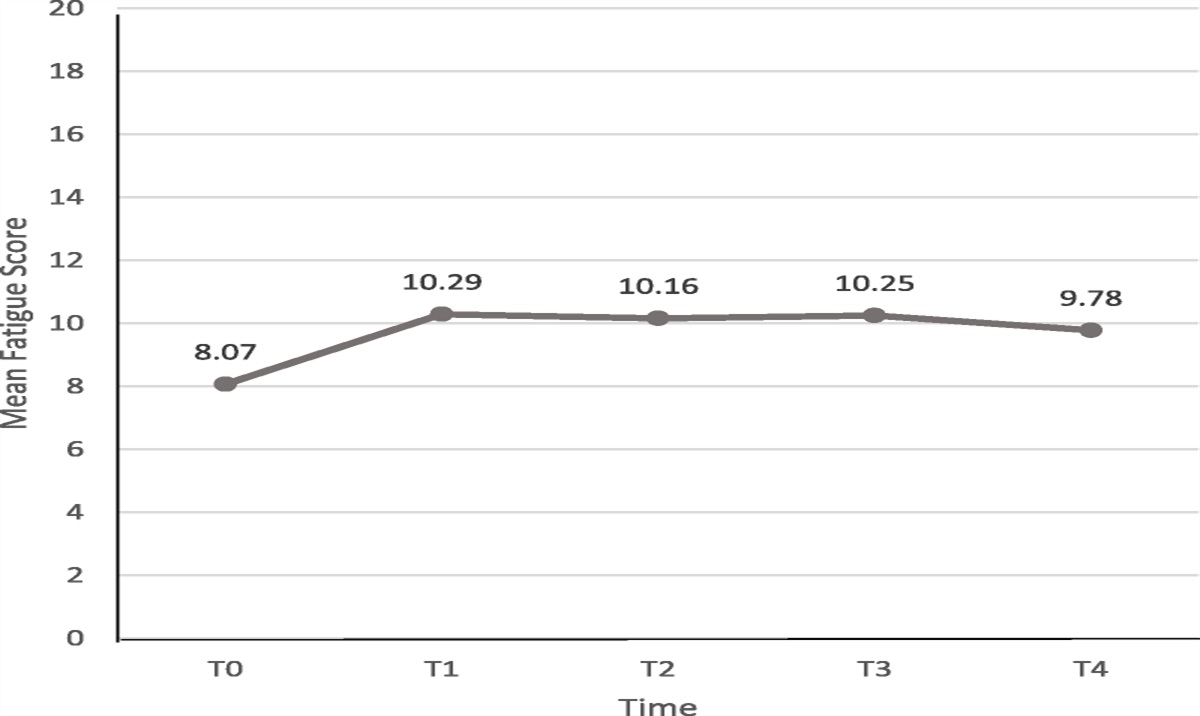
Distribution of Fatigue, Psychological Symptom Distress, and Pain at Each Time PointThe symptom scores are shown in Table 2. Across the five measurement points. the mean fatigue levels ranged from 8.07 to 10.29 (possible score range: 0–52), the mean psychological symptom distress ranged from 0.54 to 0.66 (possible score range: 0–4), and the mean pain levels ranged from 0.45 to 0.83 (possible score range: 0–10). The overall severities of the abovementioned symptoms were all mild.
Table 2. - Descriptive Statistics on Psychological Symptom Distress and Pain at Each Time Point (N = 100) Scale Mean ± SD T0 (Baseline) T1 T2 T3 T4 FACIT-F (0–52) 8.07 ± 6.59 10.29 ± 7.57 10.16 ± 8.72 10.25 ± 7.82 9.78 ± 7.33 Range 0–31 0–35 0–43 0–35 0–30 PSYCH (0–4) 0.66 ± 0.74 0.54 ± 0.61 0.56 ± 0.65 0.58 ± 0.64 0.59 ± 0.66 Range 0–3.30 0–2.95 0–3.07 0–2.27 0–2.40 BPI-SF (0–10) 0.58 ± 1.39 0.80 ± 1.25 0.83 ± 1.67 0.45 ± 1.07 0.58 ± 1.25 Range 0–7 0–5 0–7 0–4 0–5Note. T1 = during treatment; T2 = 1 month after treatment; T3 = 3 months after treatment; T4 = 6 months after treatment; FACIT-F = Functional Assessment of Chronic Illness Therapy-Fatigue scale; PSYCH = psychological symptom distress subscale; BPI-SF = Brief Pain Inventory-Short Form.
The fatigue level increased sharply from 8.07 at T0 to 10.29 at T1 (during RT) and then remained at this elevated level from T2 through T4 (Figure 1). There was a significant overall time effect, with fatigue levels at T1 (p < .001), T2 (p = .009), T3 (p = .002), and T4 (p = .006) significantly higher than that at T0. No significant differences were found among T1, T2, T3, and T4. In other words, the fatigue level increased when the participants commenced RT and remained at this higher level through 6 months after completing their therapy (Table 3).
 Figure 1.:
 Changes in Mean Fatigue Score Over Time
Table 3. - Bivariate Linear Regression of Generalized Estimating Equations Results for Fatigue: Time Effect (N = 100) Variable Coefficient 95% CI p Intercept 8.07 [6.79, 9.35] < .001 T1 vs. T0 2.22 [1.00, 3.44] < .001 T2 vs. T0 2.25 [0.57, 3.94] .009 T3 vs. T0 2.86 [1.07, 4.65] .002 T4 vs. T0 2.42 [0.69, 4.14] .006Note. T0 = baseline; T1 = during treatment; T2 = 1 month after treatment; T3 = 3 months after treatment; T4 = 6 months after treatment.
Nine factors, including age, gender, religion, working status, personal income, disease stage, functional status, RT type, RT total dose, pain, and psychological symptoms, were included in the initial multiple GEE model based on significance values < .25 after a series of bivariate linear regressions of GEE. However, after eliminating data on the six participants with extremely low RT total dosage levels from the analysis, the correlation between RT total dose and fatigue did not reach significance. Next, the remaining 10 factors and time were entered into a multiple GEE model, and those participants with a monthly income below 30,000 NTD were found to have higher levels of fatigue than their peers with monthly incomes above 60,000 NTD (p = .020). The participants at Grade 1 and 2 ECOG-PS at baseline were found to have higher degrees of fatigue than those who were at Grade 0 (p = .005). In addition, a positive association was found between fatigue and, respectively, pain and psychological distress at each time point (p < .001; Table 4).
Table 4. - Multiple GEE Model for Fatigue: Effects of Other Covariates After Adjusting for Time (N = 100) Variable Coefficient 95% CI p Time effect T1 vs. T0 2.63 [1.44, 3.81] < .001 T2 vs. T0 2.50 [1.05, 3.96] .001 T3 vs. T0 3.06 [1.59, 4.52] < .001 T4 vs. T0 2.49 [0.87, 4.10] .003 Age 0.08 [−0.01, 0.17] .094 Gender Female vs. male 2.52 [−0.61, 5.64] .114 Religion Yes vs. no 1.29 [−0.30, 2.89] .112 Working status (after getting sick) Resigned Ref. Continue working −0.45 [−2.47, 1.57] .663 Not previously employed −1.49 [−3.67, 0.69] .180 Personal income (NTD/month) < 30,000 Ref. 30,000–60,000 −1.21 [−3.19, 0.77] .230 > 60,000 −2.60 [−4.79, −0.41] .020 Refuse to answer −2.90 [−6.11, 0.32] .077 BCLC stage Stages C and D vs. Stages 0, A, and B 0.64 [−1.34, 2.61] .528 ECOG-PS Grades 1 and 2 vs. Grade 0 2.70 [0.83, 4.57] .005 RT type Photon vs. PBT 0.09 [−1.87, 2.05] .928 Pain 0.83 [3.47, 5.80] < .001 Psychological symptoms
留言 (0)