
記住我


Dysphagia is a common problem in patients who are elderly, were involved in a cerebral vascular accident, have head and neck cancer (HNC), or have an age-related degenerative disease such as Alzheimer's disease (Sadakane-Sakuramoto et al., 2021; Thiyagalingam et al., 2021). Dysphagia is known to increase morbidity and mortality and cause severe problems, the most severe of which is aspiration pneumonia (Yoshimatsu et al., 2022). Early dysphagia detection may help nurses and healthcare givers to become aware of this problem in advance and refer affected patients for further evaluations and treatments (Feng et al., 2019; Simões et al., 2020).
Dysphagia evaluation includes objective and subjective assessments (Bartlett et al., 2022; Seo et al., 2021). Videofluoroscopy, a radiographic procedure, is one of the most widely used of these assessments (Huang et al., 2023). Penetration–Aspiration Scale (PAS) scores measured using videofluoroscopy can help detect airway invasion (Borders & Brates, 2020). PAS scores range from 1 to 8, which respectively correlate to minor (1) to severe (8) degrees of airway invasion (Borders & Brates, 2020). The severity of dysphagia symptoms is descriptive of the risk of bolus penetration into the airway (Alkhuwaiter et al., 2022). Subjective assessment tools for dysphagia use self-reported questionnaires such as the Eating Assessment Tool-10 (EAT-10) and Sydney Swallow Questionnaire (SSQ; Szczesniak et al., 2014; Zhang et al., 2023). Total scores for the EAT-10 and SSQ range, respectively, from 0 to 40 and from 0 to 1,700 (Möller et al., 2020; Szczesniak et al., 2014), with higher scores indicating more severe dysphagia symptoms.
Videofluoroscopy visualizes bolus flow and the degree of airway invasion directly (Lee et al., 2020). However, limitations of this technique include risk of radiation exposure and the high cost of related equipment (Stafler et al., 2022). Moreover, videofluoroscopy facilities are usually available only at medical centers, not at nursing homes. In addition, equipment manipulation and image interpretation require a trained radiologist. In contrast, subjective questionnaires are easily implemented by nurses or caregivers. Therefore, an improved understanding of the discrepancies between questionnaires and videofluoroscopy may help nurses and homecare givers select the appropriate subjective questionnaire to evaluate swallowing efficacy.
Although the relationship between subjective questionnaires and videofluoroscopy diagnoses has been investigated (Audag et al., 2019; Bartlett et al., 2022; Zhang et al., 2023), the reported correlation ranges were inconsistent. Therefore, in this study, a meta-analysis and a systematic review were conducted to rigorously assess the correlations between videofluoroscopy and two commonly used subjective questionnaires, EAT-10 and SSQ.
Methods DesignThe searching, screening, and reporting of evidence for this meta-analysis and systematic review were based on the Preferred Reporting Items for Systematic Reviews and Meta-Analyses guidelines (Selçuk, 2019).
Search StrategyThe structure of this meta-analysis also followed the Preferred Reporting Items for Systematic Reviews and Meta-Analyses guidelines (Page et al., 2021). A PubMed search for Medical Subject Headings terms corresponding to “dysphagia,” “subjective questionnaire,” and “videofluoroscopy” identified the Medical Subject Headings term “deglutition disorder” for dysphagia only, which was also included as a search term in this study. To expand the search to include the use of subjective questionnaires, we searched three dysphagia-related journals (Dysphagia, Journal of Neurogastroenterology and Motility, and Neurogastroenterology and Motility) using the keyword “questionnaire,” which returned the EAT-10 and SSQ. Therefore, the keywords “dysphagia,” “deglutition disorder,” “questionnaire,” “subjective questionnaire,” videofluoroscopy,” “eating assessment tool-10,” “EAT-10,” “Sydney Swallow Questionnaire,” and “SSQ” were used to search the PubMed and Embase databases with an upper cutoff date of December 2022.
Study SelectionAfter using EndNote X7 reference management software (Clarivate, Philadelphia, PA, USA) to find and remove duplicate articles, the identified articles were screened in two phases. In the first phase, titles and abstracts were assessed for relevance, including the presence of search terms related to dysphagia, subjective questionnaires about dysphagia, and videofluoroscopy. In the second phase, the full text of the articles were evaluated using the inclusion and exclusion criteria. Two independent reviewers double-coded all articles, and any disagreements were resolved through discussion until a consensus was reached.
Inclusion and Exclusion CriteriaThe inclusion criteria were studies that (a) investigate the correlation between a subjective questionnaire (EAT-10 or SSQ) and videofluoroscopy, (b) provide Pearson or Spearman correlation coefficients, and (c) were written in English. Exclusion criteria were studies that (a) were published as a review, editorial, protocol, case report, letter to the editor, or qualitative research paper; (b) were published in a language other than English; (c) were duplicate publications; (d) did not provide usable data; and (e) were not a full manuscript (e.g., a poster).
Critical Evaluation of QualityAt least two assessors performed independent assessments of the quality of each included study using the Quality in Prognosis Studies tool (Hayden et al., 2013). For each study, the six domains of the Quality in Prognosis Studies tool, namely “participation,” “attrition,” “prognostic factor measurement,” “confounding measurement and account,” “outcome measurement,” and “analysis and reporting,” were assessed and categorized as posing a low, moderate, or high risk of bias.
Data Extraction and TransformationTwo reviewers performed data extraction from each study independently and listed the variables as follows: author, publication year, Pearson's or Spearman's correlation coefficients, p values, country where the research was performed, and sample size. Because variance in sample correlation coefficients can strongly affect pooled results (Borenstein et al., 2009), the correlation coefficients were transformed to the Fisher's z scale before analysis. After the meta-analysis, these synthesized values were transformed back into their original correlation units using Equation 2.
Equation 1: Fisher's z scale value = 0.5×ln1+r1−r, where r is the reported correlation coefficients from the studies
Equation 2: ρ =e2z−1e2z+1, where z is the Fisher's z scale value.
Statistical AnalysisHeterogeneity was evaluated using the I-squared index (I2) and examined using the Cochran's Q test. Publication bias was assessed using the funnel plot and Egger's tests. Both fixed- and random-effects models were fitted in this meta-analysis. Values of I2 < 50% and p > .1 were considered as indicating homogeneous between-study variance and appropriate for use with the fixed-effects model. For values of I2 ≥ 50% and p ≤ .1, a random-effects model was used to account for the heterogenous effects (Higgins et al., 2003; Huedo-Medina et al., 2006). In addition, subgroup analyses were conducted to assess possible factors of heterogeneity between studies and to further discern the correlations among studies (Leeflang et al., 2008). Furthermore, a multilevel model was used to fit the correlated data within a single study. All of the analyses were conducted using R statistical software (v4.0.3; R Core Team, 2020).
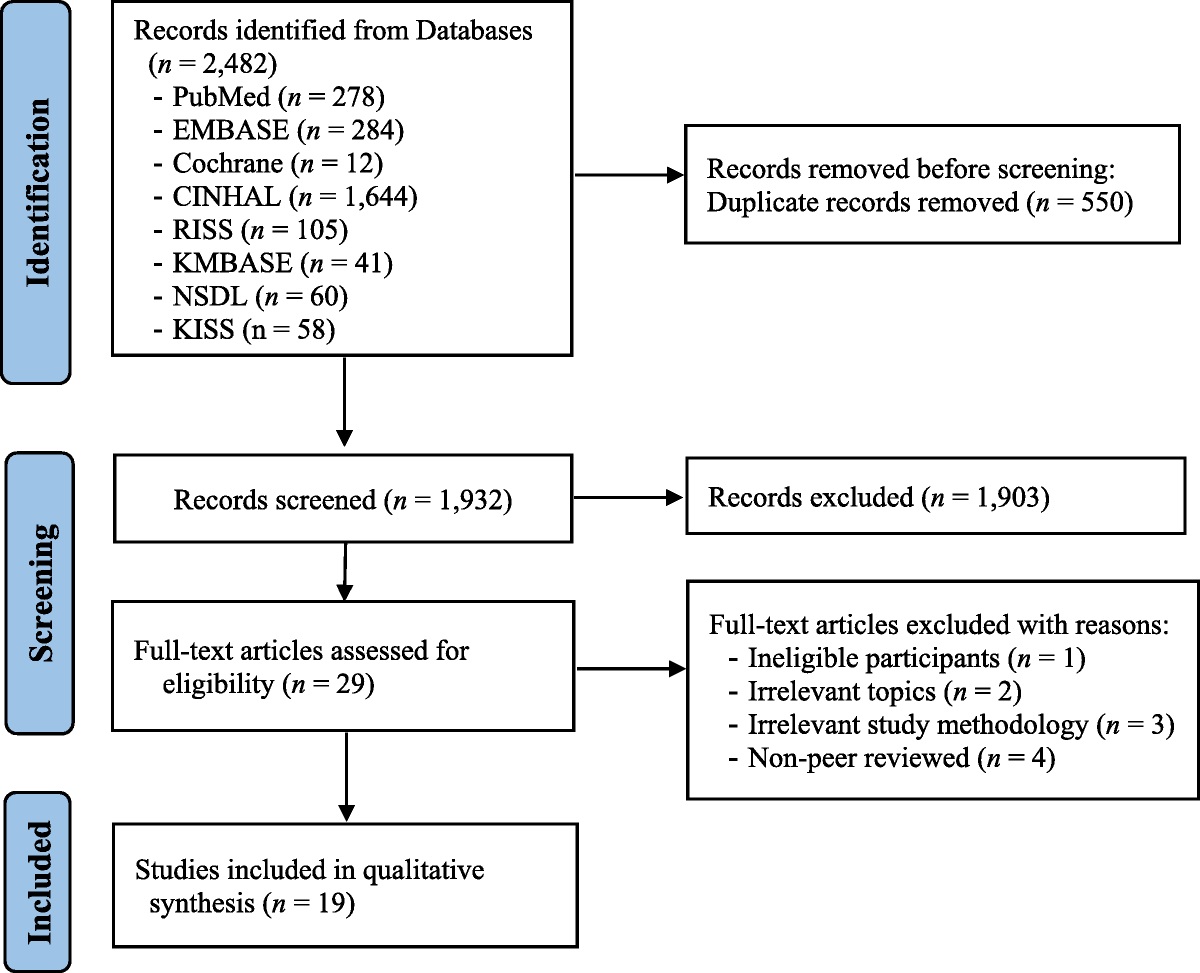
Results Article SearchThe initial keyword search identified 10,065 potentially relevant studies. After screening, 57 were shortlisted as potentially qualified and evaluated using the inclusion criteria. Ultimately, six studies were qualified and included in the meta-analysis. The article search process and reasons for exclusion are shown in Figure 1.
 Figure 1.:
 Search of the Literature Flowchart
Critical Evaluation of QualityThe included studies were assessed for quality assessment, and the related risk levels were calculated based on study participation, study attrition, measurement, study confounding, statistical analysis, and reporting (Table 1). All of the included studies were assessed as having low risk values for measurement and statistical analysis, indicating their good reliability.
Table 1. - Risk of Bias SummaryNote. + = low risk; ++ = moderate risk; +++ = high risk; EAT = Eating Assessment Tool; SSQ = Sydney Swallow Questionnaire.
The six included studies covered 883 patients and assessed the relationship between the two questionnaire surveys and videofluoroscopy-measured PAS scores. Information on study region, number of patients, raw correlation coefficient, type of subjective questionnaire, and different patient groups (i.e., HNC, stroke, neurological disorder, Parkinson's disease, and dysphagia symptoms) is shown in Table 2.
Table 2. - Characteristics of Included Studies Serial No. Author, Publication Year Study Site Instrument Subgroups by Diagnosis Number of Patients Correlation Coefficient 1 Arrese et al. (2017) America EAT-10 HNC with pretreatment to 1 year s/p 19 .66 Between 1 and 5 years s/p 8 −.06 Between greater than 5 years s/p 17 .07 2 Bartlett et al. (2022) America EAT-10 HNC 87 .41 Stroke 59 .12 Parkinson 41 .18 3 Arslan et al. (2017) Turkey EAT-10 Neurological disorder 259 .42 4 Cheney et al. (2015) America EAT-10 Dysphagia 360 .27 5 Bofill-Soler et al. (2021) Spain EAT-10 HNC pre-chemoradiotherapy 31 .31 End of chemoradiotherapy 20 .33 Three months post-chemoradiotherapy 17 .28 6 Audag et al. (2019) Belgium SSQ Dysphagia 27 .74Note. EAT = Eating Assessment Tool; HNC = head and neck cancer; s/p = status post; SSQ = Sydney Swallow Questionnaire.
Cumulative sample sizes and pooled correlation with 95% confidence interval (CI) are shown in Table 3. The six articles (n = 883 patients) reported on the correlations between the questionnaire and videofluoroscopy results. The results of the funnel plot and Egger's tests did not indicate publication bias (Figure 2; p = .88). High heterogeneity (I2 = 51%, p = .02) was observed among the six articles. The result of the random-effects meta-analysis showed a pooled correlation of .35 (95% CI [0.20, 0.48]). In addition, two of the included studies (Arrese et al., 2017; Bofill-Soler et al., 2021) were separated into three parts, with each part treated as a single datum for analysis. As this approach may potentially overestimate the effects of a single study, a multilevel model that incorporated a covariance matrix within the individual studies was used. The results of the multilevel model (pooled correlation = .34, 95% CI [0.25, 0.42]) were similar to those shown in Table 3.
Table 3. - Correlations Between Subjective Questionnaires and Videofluoroscopy Study Total Correlation 95% CI Weight (%) Arrese et al.: patients with head and neck cancer pretreatment 19 .66 [0.29, 0.86] 6.1 Arrese et al.: patients with head and neck cancer posttreatment of 1–5 years 8 −.06 [−0.73, 0.67] 2.7 Arrese et al.: patients with posttreatment > 5 years 17 .07 [−0.42, 0.53] 5.6 Bartlett et al.: patients with head and neck cancer 87 .41 [0.22, 0.57] 11.5 Bartlett et al.: patients with stroke 59 .12 [−0.14, 0.36] 10.4 Bartlett et al.: patients with Parkinson disease 41 .18 [−0.13, 0.46] 9.2 Arslan et al.: patients with dysphagia symptoms 259 .42 [0.31, 0.51] 13.3 Cheney et al.: patients with dysphagia symptoms 360 .27 [0.17, 0.37] 13.6 Bofill-Soler et al.: head and neck cancer pre-chemoradiotherapy 31 .31 [−0.05, 0.60] 8.1 Bofill-Soler et al.: end of chemoradiotherapy 20 .33 [−0.13, 0.67] 6.3 Bofill-Soler et al.: 3 months post-chemoradiotherapy 17 .27 [−0.24, 0.67] 5.6 Audag et al. 27 .74 [0.50, 0.87] 7.6 Random-effects model 945 .35 [0.20, 0.48] 100.0 Heterogeneity: I 2 = 51%, τ2 = 0.05, p = .02. Figure 2.:
 Funnel Plot and Egger's Tests
Subgroup analyses were performed on patient subgroups, namely, HNC status, English speaking status, and questionnaire used (EAT-10 or SSQ). The pooled correlations were .35 (95% CI [0.15, 0.52]; Table 4) and .36 (95% CI [0.10, 0.57]; Table 4) for patients with and without HNC, respectively, indicating no significant difference (p = .95). For patients who did and did not speak English, the pooled correlations were .28 (95% CI [0.09, 0.45]; Table 5) and .44 (95% CI [0.23, 0.62]; Table 5), respectively, which also indicated no significant difference (p = .24). Five of the included studies examined the relationship between EAT-10 and videofluoroscopy. The pooled correlation between EAT-10 and videofluoroscopy from these studies was .31 (95% CI [0.19, 0.42]; Table 6). Only one of the included studies reported on the correlation between SSQ and videofluoroscopy (.74, 95% CI [0.50, 0.87]; Table 6). A significant difference between these two correlations was identified (p < .01).
Table 4. - Correlation Between Subjective Questionnaires (Patients With vs. Without Head and Neck Cancers) and Videofluoroscopy Study Total Correlation 95% CI Weight (%) Patients with head and neck cancer Arrese et al.: patients with head and neck cancer pretreatment 19 .66 [0.29, 0.86] 6.1 Arrese et al.: patients with head and neck cancer posttreatment of 1–5 years 8 −.06 [−0.73, 0.67] 2.7 Arrese et al.: patients with posttreatment > 5 years 17 .07 [−0.42, 0.53] 5.6 Bartlett et al.: patients with head and neck cancer 87 .41 [0.22, 0.57] 11.5 Bofill-Soler et al.: head and neck cancer pre-chemoradiotherapy 31 .31 [−0.05, 0.60] 8.1 Bofill-Soler et al.: end of chemoradiotherapy 20 .33 [−0.13, 0.67] 6.3 Bofill-Soler et al.: 3 months post-chemoradiotherapy 17 .27 [−0.24, 0.67] 5.6 Random-effects model 199 .35 [0.15, 0.52] 46.0 Heterogeneity: I 2 = 0%, τ2 = 0.0309, p = .48 Patients without head and neck cancer Bartlett et al.: patients with stroke 59 .12 [−0.14, 0.36] 10.4 Bartlett et al.: patients with Parkinson disease 41 .18 [−0.14, 0.46] 9.2 Arslan et al.: patients with dysphagia symptoms 259 .42 [0.31, 0.51] 13.3 Cheney et al.: patients with dysphagia symptoms 360 .27 [0.17, 0.37] 13.6 Audag et al. 27 .74 [0.50, 0.87] 7.6 Random-effects model 746 .36 [0.10, 0.57] 54.0 Heterogeneity: I 2 = 76%, τ2 = 0.08, p < .01 Random-effects model 945 .35 [0.20, 0.48] 100.0 Heterogeneity: I 2 = 51%, τ2 = 0.05, p = .02 Test for subgroup differences: χ2 = 0.004, df = 1 (p = .95)
留言 (0)