
記住我


Gestational diabetes mellitus (GDM) is defined as a condition in which hyperglycemia develops and is diagnosed for the first time during pregnancy.1 Intrauterine exposure to hyperglycemia, hyperinsulinemia, and proinflammatory mediators in GDM can affect the long-term neurodevelopment of children.2 However, these findings have been contradictory,3–6 and the study designs have been heterogeneous.7,8 Two recent studies report that particularly GDM combined with maternal pre-pregnancy overweight or obesity may lead to transgenerational brain changes9 or to weaker neurodevelopmental skills in offspring, although being still within the mean normative range in this population.10
Metformin is increasingly used in the treatment of GDM. However, metformin crosses the placenta with fetal levels similar to maternal concentrations.11 It has also shown to cross the blood-brain barrier in experimental animals and in humans and to exert various neurophysiological actions.12
Mice studies have shown that male and female offspring may develop different metabolic phenotypes after similar exposure, e.g., GDM or metformin medication during pregnancy.13,14 In our previous studies, boys in the metformin group had better high-density lipoprotein cholesterol15 and adiponectin16 concentration than the boys in the insulin group at the age of 9 years. Still, in short term, metformin has been considered as a safe option for both the mother and the child.17–20 Thus, possible long-term effects on neurocognitive development of the offspring after prenatal exposure of metformin treatment of GDM are important to evaluate.
Previously, neurodevelopment of offspring in randomized studies comparing maternal metformin or insulin treatment of GDM has been followed only until the age of 18 months21 or 2 years,22,23 and in 1 population-based cohort study, the questionnaire of offspring psychosocial and behavioral indices was gathered before entering school.24 In these 4 studies, no significant differences were found between the 2 treatment groups.
The aim of this study was to assess possible long-term effects of prenatal metformin exposure on cognitive and neuropsychological performance in 9-year-old children. The study subjects were children born to mothers with GDM randomized to metformin or insulin treatment. Cognitive and neuropsychological outcomes between children of metformin and insulin groups were also analyzed in subgroups by sex. The age of 9 years, just before the onset of puberty and after completing the second grade of primary school education, was considered the most appropriate age to compare the cognitive and neuropsychological variables between the offspring of the 2 treatment groups.
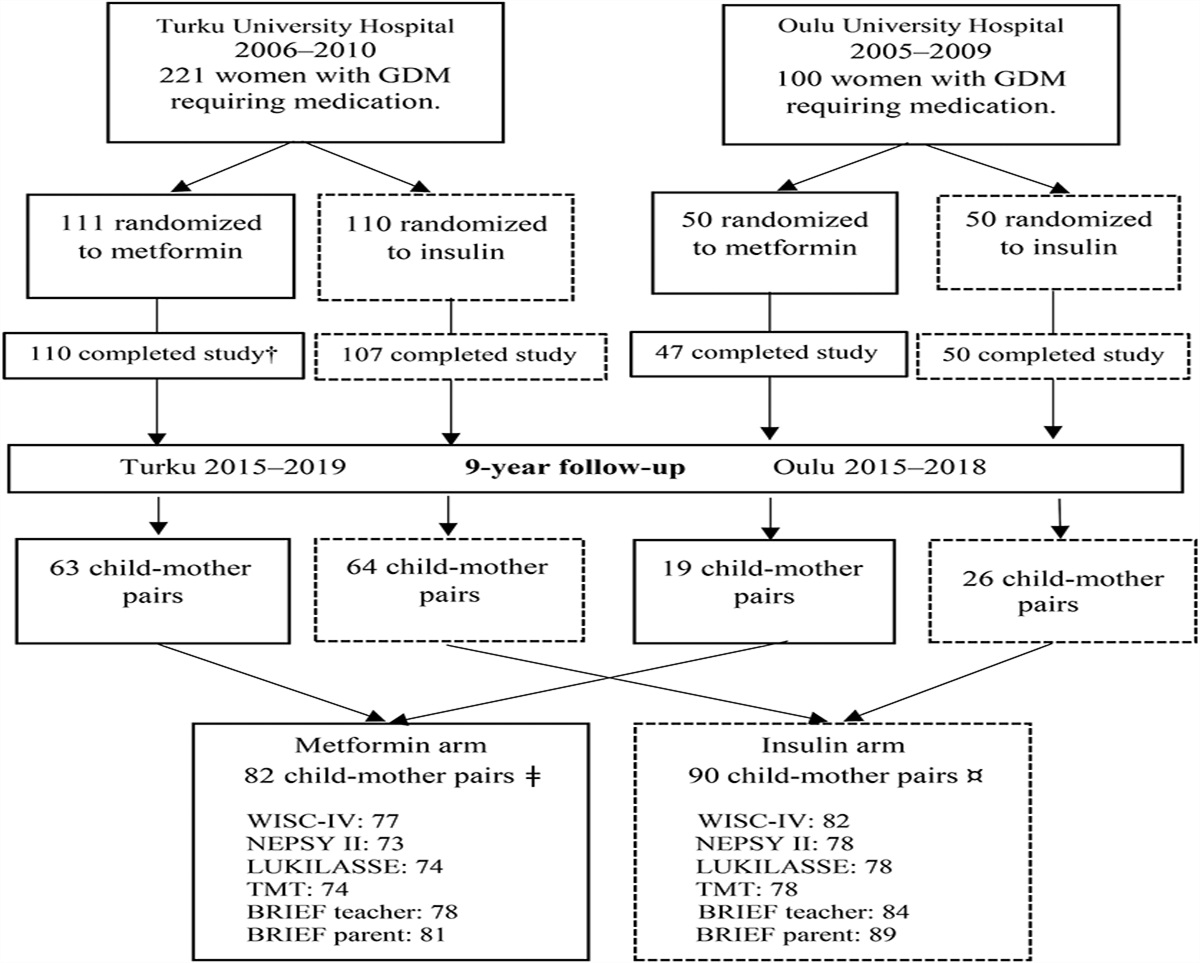
METHODS Study SubjectsThis was a prospective follow-up study in the offspring of 2 previously published Finnish randomized controlled trials with similar study designs,25,26 comparing metformin and insulin treatment of GDM. The study design of this follow-up study has been previously described in detail.15 A total of 172 children participated in a 9-year follow-up study, comprising 55% of all eligible children (n = 311) from the 2 original trials (Fig. 1). For neuropsychological assessment, 159 of 311 children (51%) participated. In total, 82 of the participating children (48%) were born to mothers who were randomly assigned at 17 to 34 gestational weeks to treatment with metformin and 90 (52%) were born to mothers assigned to insulin treatment. Furthermore, in the metformin group, 27% of the mothers (22 of 82) received additional insulin to achieve sufficient glucose balance. The aim of this study was to investigate the safety of metformin; thus, children born to mothers originally randomized to receive metformin were handled as 1 group in all analyses, including those whose mothers needed additional insulin.
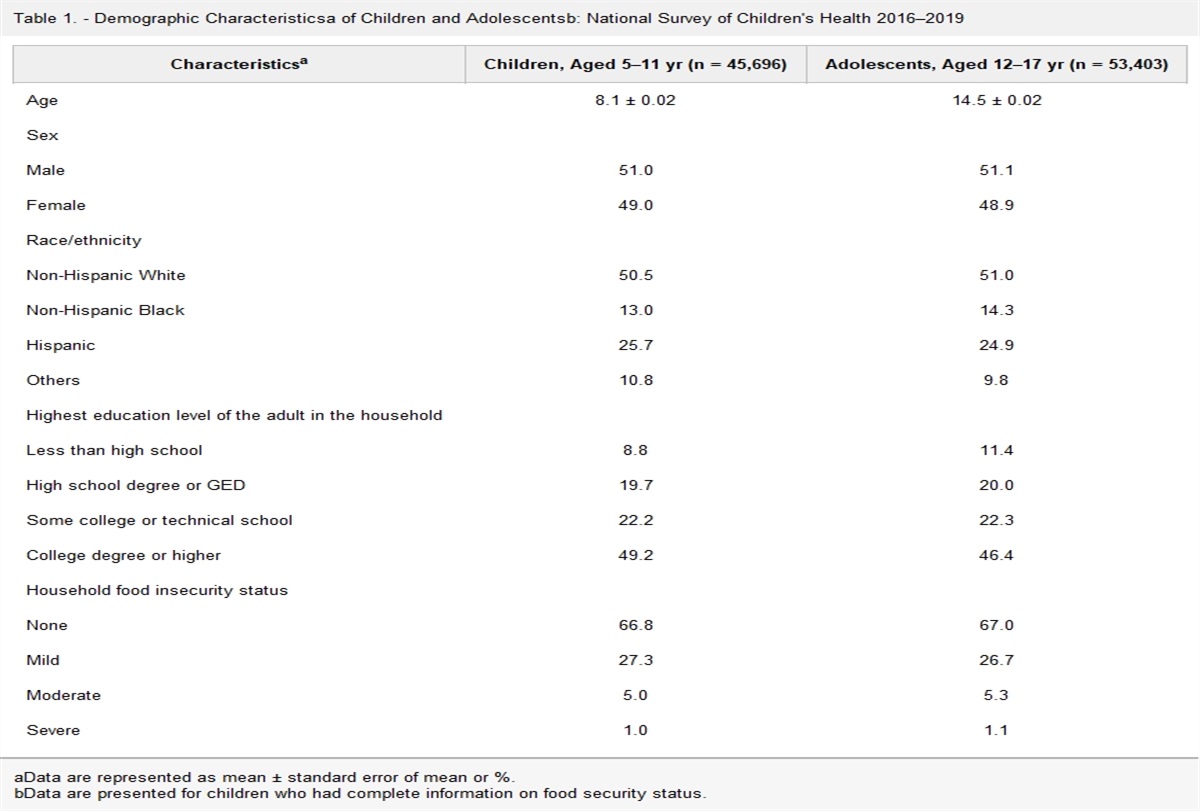
 Figure 1.:
 Participants of the 2 original randomized controlled trials and those of the 9-year follow-up study. †Of the 110 participants, who completed the original study in the metformin group in Turku, 3 offspring were excluded because 1 child had valproate syndrome, 1 child had down syndrome, and 1 child was stillborn. In the 9-year follow-up of 82 participants in the metformin group, 2 children were excluded (Swedish language), and for 2 children, a psychologist was not available for testing. ¤Of the 90 participants in the insulin group, 7 children were excluded because 1 child had attended a psychological test within less than a year, 8 children had Swedish as a school language, and for 1 child, a psychologist was not available for testing. BRIEF, Behavioral Rating Inventory of Executive Functioning; GDM, gestational diabetes mellitus; LUKILASSE, Screening test for reading, writing, and calculus for first to sixth grades; NEPSY II, developmental neuropsychological assessment test; TMT, Trail Making Test; WISC, Wechsler Intelligence Scale for Children.
This 9-year follow-up study was conducted at 2 sites, Turku University Hospital in Southwest Finland and Oulu University Hospital in Northern Finland, between 2015 and 2019. Examination included measurements of growth, body composition, and blood tests for metabolism, and these results were reported previously.15 Study examinations of the children were arranged during 1 day in the following order: fasting blood samples, oral glucose tolerance test, anthropometric measurements,15 and after lunch, cognitive and neuropsychological assessments and radiological imaging studies assessing adiposity.16 Furthermore, anthropometric data (height and weight) of the mothers were gathered during the children's study visit. Parental demographic and lifestyle data together with paternal anthropometric values and children's school-related factors were collected from the parents before the study visits using questionnaires designed for the purposes of the present study. In addition, teachers and parents filled in questionnaires about their child's executive functioning before the study visit. In Finland, basic education starts the year children turn 7 years, and at the age of 9 years, they are completing their second or started their third grade at school. Nine children, 2 from the metformin group and 7 from the insulin group, were excluded from the neuropsychological assessments: 1 child had attended a similar psychological test within less than a year and 8 children did not have Finnish as a school language. Furthermore, the neuropsychological assessment was not completed for 3 children because of scheduling reasons, and 1 child was not able to attend the assessment because of nausea and feeling ill.
Written informed consent was obtained from each mother, child, and father. The assessors were blinded to the treatment allocation of the mothers. The 9-year follow-up study was registered with the Clinical Trials Registry (NCT02417090) and approved by the Ethics Committee of the Hospital District of Southwest Finland (ETMK 31/2015, April 27, 2015).
Cognitive and Neuropsychological AssessmentsNeuropsychological test battery for the purposes of this study was designed to cover essential functions of development and school performance of 9-year-old children. Neuropsychological assessments were performed in Finnish. Two psychologists and 3 final-stage psychology students under the guidance of an experienced psychologist made the assessments over a 4-year period.
Cognitive DevelopmentCognitive development of the children was assessed using the Finnish translation of Wechsler Intelligence Scale for Children, Fourth Edition (WISC-IV).27,28 Full-Scale Intelligence Quotient (FSIQ) was used as a measure of general intelligence. FSIQ comprises 4 indexes derived from 10 subtests. The Verbal Comprehension Index measures the ability of verbal reasoning and acquired knowledge, Perceptual Reasoning Index (PRI) measures perceptual organization and logical reasoning, Working Memory Index measures working memory and attention, and Processing Speed Index measures the speed of mental and fine motor processing. WISC-IV indexes were calculated according to age-appropriate Finnish norms (mean 100, SD 15)28 and used as a continuous variable. Based on clinical significance, the cutoff was set to <85 points (−1 SD) in WISC-IV indexes to identify children whose results were at least slightly below normal.27,28
Neuropsychological PerformanceLanguage functions were assessed using a Developmental Neuropsychological Assessment (NEPSY II)29,30 subtest called Comprehension of Instructions, assessing the ability to receive and process oral instructions of increasing complexity.
Memory functions were assessed using a NEPSY II29,30 subtest called Narrative Memory, assessing memory for logical verbal story under free and cued recall. Scores of the NEPSY II measures were based on age-appropriate Finnish norms (mean 10, SD 3)29,30 and used as a continuous variable. The cutoff was set to <8 standard scores (−1 SD) to identify results that were at least slightly below normal.29,30
Attention regulation was assessed with the Trail Making Test (TMT) for children,31 consisting of 2 parts: TMT A, in which the respondent is asked to connect randomly arranged circles containing numbers and requires visual tracking and simple set-sifting, and TMT B, in which the respondent has to alternate between numbers and letters and requires visual tracking and complex set-sifting. The time in minutes needed to complete each part as quickly as possible was used as a measure of performance and used as a continuous variable.
Executive functions in daily life were assessed using both teacher and parent forms of the Finnish translation of the Behavior Rating Inventory of Executive Function (BRIEF).32 BRIEF forms consist of 86 items with a 3-point Likert scale, and these items consist of 8 subscales that form 2 indexes. The Behavioral Regulation Index is a composite score of Inhibit (ability to resist impulse), Shift (making transitions between tasks and mindsets), and Emotional Control (regulation of emotional responses). The Metacognition Index is a composite score of Initiate (starting an activity independently), Working Memory (holding information to complete a task), Plan/Organize (planning and organizing ahead for future events), Organization of Materials (sorting and organizing things), and Monitor (assessing one's own performance for proper goal attainment). The Global Executive Composite Score combines Behavioral Regulation Index and Metacognition Index. The age-specific and sex-specific standardized T-scores on the subscales and index scores were used to measure outcomes32 and used as a continuous variable. Pre-established cutoff T-score > 64 was used to indicate clinically significant symptoms.32 Only consistently filled-in questionnaires were used in the analyses.32
Academic FunctioningReading fluency was assessed with a subtest of the Screening test for reading, writing, and calculus for first to sixth grades (LUKILASSE). In that test, the study participants read as many words as possible from the word list in 2 minutes and correctly read words are counted.33 Standard scores at or below −1.34 SD were considered as clearly below grade level.33
School-related factors—information about the level of educational support—were collected from parents. Educational support is divided into 3 levels, i.e., general, intensified, and special support. All students are covered by general support. Intensified support means a part-time special education in a specific area, such as literacy or mathematics, and special support means full-time special education that is intended for children with a long-term need of support and includes mainly individualized education plans in one or several subjects.
Data AnalysisOwing to a relatively small number of children in both study groups, post hoc power analysis was performed to evaluate the reliability of the results. Assuming at least noninferiority between the study groups, the required sample sizes were calculated to attain 80% statistical power on 95% significance level with 10 points as a noninferiority margin using the observed group means and pooled SD. We chose a 10-point difference because we were interested in clinically significant difference that might affect the performance of the children. In this setup, we found that sufficient total sample size to assess noninferiority for FSIQ is n = 95 subjects and for PRI n = 216 subjects. This analysis was performed using R: a language and environment for statistical computing, version 4.2.3 (R Foundation for Statistical Computing, Vienna, Austria) and epiR package, version 2.0.57 (Stevenson et al.).34
The Kolmogorov-Smirnov test was used to analyze whether the variables were normally distributed, and the Shapiro-Wilk test was used to test the normality of the subgroups of boys and girls (n < 50). Continuous variables are described using means, SDs or medians, and interquartile ranges (IQR). Categorical variables are described using frequencies and percentages. Between-group comparisons in continuous variables were performed using Student's ttest for normally distributed data and the Mann-Whitney U test for skewed data. The chi-square test or Fisher's exact test was used for categorical variables. Potential differences in boys and girls between the treatment groups were explored using subgroup analysis. Multivariable regression analysis was used to adjust the results for parental education level and sex. The IBM SPSS Statistics (IBM Corp, Armonk, NY) software package, version 27.0, was used, and a p value of <0.05 was set to indicate statistical significance.
RESULTS Study SubjectsA total of 172 children (82 in the metformin group and 90 in the insulin group) were followed up at 9 years. The means or medians of cognitive development, neuropsychological performance, and academic functioning were similar in offspring assessed in the 2 study sites (Turku n = 127, Oulu n = 45), which allowed further analysis to be made as a single group. The results of neuropsychological assessments were eligible in 159 participants, which is 51% of the 311 children in the original cohort and 77 (48%) of these belonged to the metformin group and 82 (52%) belonged to the insulin group (Fig. 1). The BRIEF questionnaires of 13 children who were excluded or whose test results were not obtained were received and included in the analyses (Fig. 1). The children participated in the neuropsychological assessment the year they turned 9 years. The median age of the participants was 9.1 years (range 8.8–9.5) in the metformin group and 9.0 years (range 8.8–9.7) in the insulin group (Table 1). Fifteen percent of the neuropsychological assessments (24 of 159: 10 [13%] in the metformin group and 14 [17.1%] in the insulin group) were conducted on a day separate from other study examinations. The means or medians of neuropsychological assessments were similar despite the difference in survey dates.
Table 1. - Pregnancy, Neonatal, and 9-Yr Follow-Up Characteristics of the Participants in the 9-Yr Follow-Up Study Metformin Insulin p Mother, pregnancy n = 77 n = 82 Age (yr), 1st antenatal visit 32.7 ± 4.8 32.5 ± 5.3 0.72 Ethnicity, White, n (%) 76 (98.7) 82 (100) 0.30 BMI (kg/m2), 1st antenatal visit 29.0 (25.0–33.0) 28.0 (25.7–33.0) 0.87ǂ Total weight gain during pregnancy (kg) 8.3 ± 4.7 8.6 ± 5.4 0.71 HbA1c prior randomization (%) 5.5 ± 0.4 5.6 ± 0.4 0.39 HbA1c at 36 gestational weeks (%) 5.6 ± 0.3 5.7 ± 0.4 0.42 Gestational weeks at randomization (wk) 30.4 (29.2–32.0) 30.8 (29.3–32.0) 0.43ǂ Duration of insulin/metformin medication (wk) 8.6 (7.1–10.6) 8.4 (6.7–10.4) 0.52ǂ Gestational weeks at birth (wk) 39.0 (38.4–40.1) 39.1 (38.4–40.3) 0.66ǂ Prematurity (delivery <37 gestational weeks) 6 (7.8) 3 (3.7) 0.26† Child, newborn n = 77 n = 82 Birth weight (g) 3620 ± 490 3571 ± 542 0.56 Birth weight (SD) 0.18 ± 1.08 0.07 ± 1.17 0.55 Birth weight < −2 SD 3 (3.9) 1 (1.2) 0.28† Apgar points at 1 min 9.0 (9.0–9.0) 9.0 (8.0–9.0) 0.22ǂ Apgar points at 5 min 9.0 (9.0–9.0) 9.0 (9.0–9.0) 0.87ǂ Apgar points at 15 min 9.0 (9.0–10.0) 9.0 (9.0–10.0) 0.56ǂ Umbilical artery pH 7.28 ± 0.09 7.28 ± 0.08 0.997 Hypoglycemia, need for IV glucose 16 (20.8) 14 (17.1) 0.55 Child, 9 yr n = 77 n = 82 Age 9.1 (9.0–9.1) 9.0 (9.0–9.1) Boys/girls 39 (50.6)/38 (49.4) 38 (46.3)/44 (53.7) 0.64 BMI (kg/m2) 17.45 (16.3–19.4) 17.85 (16.1–20.7) 0.63ǂ Overweight or obese (adjusted BMI ≥25.0)¤ 20 (26.3) 30 (36.6) 0.17 Waist:height ratio 0.43 (0.41–0.47) 0.44 (0.43–0.49) 0.13 Waist:height ratio >0.5 11 (14.5) 14 (17.1) 0.67 Grade at school, 2nd/3rd 37 (48.1)/40 (51.9) 46 (56.1)/36 (43.9) 0.31 Mother at 9-yr visit n = 77 n = 82 Age (yr) 42.3 ± 4.8 41.9 ± 5.4 0.63 BMI (kg/m2) 31.1 ± 5.8 31.0 ± 5.3 0.91 Regular smoking 10 (13.0) 12 (14.6) 0.76 Education level Lower or upper secondary 37 (52.1) 43 (55.1) 0.71 Postsecondary or higher 34 (47.9) 35 (44.9) Father at 9-yr visit n = 72 n = 75 Age (yr) 42.0 (39.8–46.3) 42.5 (40.0–48.8) 0.47ǂ BMI (kg/m2) 27.0 (24.7–30.8) 27.8 (24.7–30.5) 0.70ǂ Regular smoking 18 (25.0) 16 (21.3) 0.60 Education level Lower or upper secondary 42 (60.0) 49 (65.3) 0.51 Postsecondary or higher 28 (40.0) 26 (34.7)Psychological assessments were performed in 159 participants. Comparison between the groups treated with metformin or insulin for GDM.
Data are expressed as mean ± SD, median (IQR), or n (%). The t test or Mann-Whitney U test (ǂ) was used for continuous variables, and the χ2 or Fisher's exact test (†) was used for categorical variables. Age-specific and sex-specific adjusted BMI cutoff points are used according to Cole et al.35 (¤).BMI, body mass index; GDM, gestational diabetes mellitus; IQR, interquartile ranges.
No significant differences between the participants and nonparticipants of the 9-year follow-up study were found in maternal baseline characteristics of pregnancy, i.e., pre-pregnancy body mass index (BMI), glycemic status, smoking habits, distribution of metformin and insulin treatments, duration of medication, and gestational weeks at delivery. The same was true in neonatal measures, i.e., birth weight, umbilical artery pH, Apgar score, need for IV glucose for hypoglycemia, and sex distribution of the children within the groups (Table S1, Supplemental Digital Content 1, https://links.lww.com/JDBP/A446). Smoking during pregnancy was slightly, but nonsignificantly, different (p = 0.060) between the 2 medication groups, and after adjusting for smoking in pregnancy, the results of WISC-IV indexes did not change. No differences were found in the abovementioned baseline characteristics between medication groups of the participants in the 9-year follow-up study (Table S2, Supplemental Digital Content 1, https://links.lww.com/JDBP/A446, Table 1). The characteristics of the 9-year-old children (e.g., sex, BMI, proportion of children with overweight/obesity or waist-height ratio >0.5) were similar in the 2 groups. Furthermore, parental characteristics (e.g., age, BMI, smoking habits and education level) at the 9-year visit were similar between the groups (Table 1).
Cognitive Development at the Age of 9 YearsThe results of Full-Scale Intelligence Quotient, Verbal Comprehension Index, PRI, Working Memory Index, and Processing Speed Index between metformin and insulin groups were similar (Table 2). Adjustment for maternal and paternal educational levels did not change the results. However, when comparing the proportion of children who performed below the average level (<85 standard points) in FSIQ, 28.6% of the children belonged to the metformin group and 16.5% to the insulin group (p = 0.070, Table S3, Supplemental Digital Content 1, https://links.lww.com/JDBP/A446). Three children had FISQ < 70 corresponding to severe cognitive impairment (standard points between 50 and 69). Two of these children were boys of the metformin group (FSIQ 64 and 69), and one was a girl of the insulin group (FSIQ 65).
Table 2. - Cognitive Development, Neuropsychological Performance, and Academic Functioning at the Age of 9 yr All Children Boys Girls Metformin Insulin p Metformin Insulin p Metformin Insulin p n = 77 n = 82 n = 39 n = 38 n = 38 n = 44 Cognitive developmenta Full-scale IQ 96.0 ± 15.0 97.8 ± 13.4 0.43 92.3 ± 12.8 93.4 ± 11.0 0.68 99.9 ± 16.2 101.7 ± 14.3 0.60 Verbal comprehension 98.6 ± 13.1 99.9 ± 12.6 0.53 97.1 ± 12.3 96.5 ± 10.8 0.83 100.2 ± 13.9 102.9 ± 13.4 0.38 Perceptual reasoning 96.5 ± 15.0 100.7 ± 15.1 0.081 94.1 ± 14.7 97.3 ± 13.3 0.31 99.0 ± 15.1 103.6 ± 16.1 0.19 Working memory 94.2 ± 12.9 94.6 ± 11.3 0.61ǂ 92.0 ± 12.1 95.0 ± 10.0 0.24 96.5 ± 13.5 94.3 ± 12.3 0.45 Processing speed 100.7 ± 15.2 97.9 ± 14.4 0.23 95.0 ± 11.0 93.6 ± 14.6 0.65 106.7 ± 16.7 101.6 ± 13.2 0.13 Neuropsychological performanceb Comprehension of instructions 10.0 (8.0–12.0) 10.5 (8.8–12.0) 0.26ǂ 8.9 (7.0–11.0) 10.0 (8.0–11.0) 0.34ǂ 11.0 (8.3–12.0) 11.0 (9.0–12.0) 0.61ǂ Narrative memory 7.1 ± 3.4 7.6 ± 3.9 0.48 6.8 ± 3.3 6.6 ± 3.7 0.77 7.4 ± 3.4 8.3 ± 4.0 0.29 TMT A (s) 23.0 (19.0–30.0) 22.5 (18.0–29.3) 0.55ǂ 23.0 (18.0–28.0) 23.0 (17.0–32.0) 0.99ǂ 23.0 (19.5–30.0) 21.0 (19.0–28.0) 0.41ǂ TMT B (s) 47.0 (40.0–74.0) 50.0 (38.0–67.3) 0.81ǂ 45.5 (40.0–74.0) 55.0 (39.0–70.0) 0.47ǂ 48.0 (39.5–71.5) 48.0 (38.0–63.0) 0.77ǂ Academic functioningc Reading fluency 71.8 ± 19.9 68.4 ± 18.0 0.28 67.4 ± 20.1 66.8 ± 16.1 0.90 76.2 ± 18.9 69.9 ± 19.7 0.16 Educational support Intensified, n (%) 3 (3.9) 6 (7.3) 3 (7.7) 4 (10.5) 0 (0) 2 (4.5) Special, n (%) 8 (10.4) 1 (1.2) 4 (10.3) 0 (0) 4 (10.5) 1 (2.3) Intensified or special, n (%) 11 (14.3) 7 (8.5) 0.063 7 (18.0) 4 (10.5) 0.13 4 (10.5) 3 (6.8) 0.28Psychological assessments were performed in 159 participants. Comparison between the offspring of the mothers treated with metformin or insulin for GDM.
Data are expressed as mean ± SD, median (IQR) or n (%). The t test or Mann-Whitney U test (ǂ) was used for continuous variables, and the Fisher's exact test was used for categorical variables.
aWechsler Intelligence Scale for Children, Fourth Edition (WISC-IV).
bTwo subtests of the Developmental Neuropsychological Assessment (NEPSY-II) test battery and TMT.
cOne subtest of the Screening test for reading, writing, and calculus for first to sixth grades (LUKILASSE) and information about received support at school.
GDM, gestational diabetes mellitus; IQR, interquartile ranges; TMT, Trail Making Test.
The results of the 2 subtests of NEPSY II, TMT A-time and B-time, and reading fluency test by LUKILASSE were similar in the children of the metformin and insulin groups (Table 2). Grade levels at school and proportion of children receiving educational support (Table 2) were similar in the 2 groups. In addition, executive function profiles at school and at home and the proportion of the children reported to have clinically significant symptoms were similar in the 2 study groups (Table 3, Table S4, Supplemental Digital Content 1, https://links.lww.com/JDBP/A446). At the time of the neuropsychological assessment, half of the children were completing second grade and half of the children were completing third grade at school (Table 2). Eleven children (14.3%) of the metformin group and 7 children (8.5%) of the insulin group received intensified or special support at school (p = 0.063 between groups; Table 2).
Table 3. - Executive Functioning in Daily Life at the Age of 9 yr as Assessed by the Teacher and Parent All Children Metformin Insulin p Executive functioning at school (n = 162) n = 78 n = 84 Behavioral regulation index 48.5 (45–60) 48.0 (45–57) 0.55 Clinically significant problems at school, n (%) 11 (14) 7 (8) 0.24 Metacognition index 51.0 (44–60) 50.0 (45–60) 0.68 Clinically significant problems at school, n (%) 13 (17) 14 (17) 0.97 Global executive composite scores 50.0 (45–61) 49.5 (45–60) 0.93 Clinically significant problems at school, n (%) 13 (17) 12 (14) 0.65 Executive functioning at home (n = 170) n = 81 n = 89 Behavioral regulation index 43.0 (39–48) 42.0 (38–50) 0.54 Clinically significant problems at home, n (%) 4 (5) 2 (2) 0.34† Metacognition index 44.0 (39–52) 44.0 (38–48) 0.37 Clinically significant problems at home, n (%) 2 (3) 2 (2) 0.93† Global executive composite scores 45.0 (38–50) 43.0 (38–48) 0.39 Clinically significant problems at home, n (%) 2 (3) 3 (3) 0.72†Medians of BRIEF indexes and proportion of children who had clinically significant problems (scores above 64) in BRIEF at school or at home. Comparison between the offspring of the mothers treated with metformin or insulin for GDM.
Data are expressed as median (IQR) or n (%). Scores above 64 are used to indicate clinically significant problems. The Mann-Whitney U test was used for continuous variables, and the χ2 or Fisher's exact test (†) was used for categorical variables.
BRIEF, Behavior Rating Inventory of Executive Function; GDM, gestational diabetes mellitus; IQR, interquartile ranges.
In this follow-up study, which comprised one
留言 (0)