Our study presents new opportunities for PZ PCa detection. A combined model was finally set up with the goal of establishing an easy-to-use tool.
Previous studies have presented controversial results regarding hypoechoic lesions in the detection of PZ PCa. Kwang Suk Lee et al. [27] reported a high proportion (76.9%) of high-grade GSs for hypoechoic PCa lesions, and hypoechoic lesions generally have worse pathologic differentiation with increasing size. Nakano Junqueira et al. [28] showed that patients with hypoechoic lesions who underwent prostatectomy had significantly worse outcomes than those who did not. A hypoechoic lesion was defined as a region with a lower grayscale value than the surrounding tissue [29]. In our study, the suspicious lesions mostly included hypoechoic lesions and few isoechoic or mixed lesions. However, hypoechoic lesions may become hyperechoic, isoechoic, or mixed lesions depending on whether they grow, invade other issues, or develop calcification [11, 15].
Li et al. [19] noted the indicators predicting suspicious lesions when using CEUS: (1) hypoechoic lesions in the peripheral zone showed high enhancement, (2) the peak intensity of enhancement within the lesion was increased, (3) asymmetric enhancement, etc. Various enhancement patterns can coexist due to the uniformity of microvessel density. Notably, we chose the CEUS image of the TTP moment to segment ROIs because the image at this moment reflected the section with the most abundant blood supply due to its microvessel density (MVD). Bono et al. [30] detected a significant difference in the MVD of PCa among different groups of GS scores, and a higher GS score corresponded to higher MVD in PCa. Additionally, in Andreas Maxeiner’s study [17], within a subgroup analysis [> vs. ≤ 3 + 4 = 7a (ISUP 2)], peak enhancement (PE) [a.u] showed statistical significance with the software used (VueBox, Bracco). As a wash-in parameter index, PE exactly reflected the real maximum echo-power of the target lesion at the TTP moment. However, in our software TomTec’s SonoLiver, only one related index, ‘Imax’, was identified, which is a percentage, reflecting the ratio of the peak enhancement of the target ROI and the reference ROI at the peak time, rather than the echo-power itself. Therefore, the CEUS image of the TTP moment was selected for the radiomic analysis.
Jiang et al. [18] showed that the peak intensity of PCa was significantly higher than that of benign prostatic hyperplasia (BPH) lesions. BPH is the most common benign lesion in the prostate and corresponds to a histopathological hyperplastic process causing glandular-epithelial growth and stromal/muscle tissue in the prostate, especially in the periurethral region of the prostate [27]. Nevertheless, the pathological changes associated with PCa mostly originate from the growth of cancer cells and changes in the extracellular space [8]. Moreover, the low specificities may also be explained by prostatitis, which causes high enhancement on CEUS [19].
Radiomics can reflect the distribution of various cell components, fluid, collagen, and fibromuscular matrix in different prostate lesions, which can provide value through quantitative analysis of different imaging features. According to the high weights of the characteristic coefficients, “Cluster Shade” and “Zone Entropy” on CEUS imaging and “Zone Entropy” and “Dependence Non Uniformity Normalized (DN)” on conventional ultrasound imaging were relatively vital characteristics for PCa identification in our study. “Cluster shade” is a measure of the skewness and uniformity of the GLCM. A higher cluster shade implies greater asymmetry about the mean; it was higher in PCa than in benign tumors. ZoneEntropy measures the uncertainty/randomness in the distribution of zone sizes and gray levels. A higher value on either CEUS or B-mode US indicates greater heterogeneity in the texture patterns, which can be used as a predictor of PCa. DN measures the similarity of dependence throughout an image, with a lower value indicating more homogeneity among dependencies in the image.
As for risk factors, those with statistical significance are consistent with those obtained by performing univariate analysis followed by multivariate analysis. Given the considerable lack of evidence supporting its efficacy, although the DRE is commonly performed to screen for prostate cancer, researches [7] recommend against routine performance of DRE to screen for prostate cancer in the primary care setting. Previous studies have demonstrated that age and PSA levels are related to prostate cancer. Junxiao Liu et al. [31] reported that tPSA (AUC = 0.74), fPSA (AUC = 0.68), PV (AUC = 0.62), and PSAD (AUC = 0.77) were significant predictors in the detection and localization of prostate cancer from suspicious mpMRI results, and PSAD and tPSA had higher diagnostic accuracy than other single parameters, which is consistent with our study. Our research indicated that PV, PSAD, tPSA, fPSA and f/t PSA were all significant factors by univariate logistic analysis, and age, PSAD, and tPSA were independent risk factors by multivariable logistic regression analysis.
Except for these usual clinical risk factors, we also incorporated CEUS parameters in the analysis. A common problem with CEUS is the examiner’s subjective judgment. For example, early enhancement and the peak intensity determination relied on the subjective judgment of the radiologist. Therefore, quantitative measurements are needed. According to Jung’s study [16], tumor detection was possible in 85.3% and 73.5% of cases by evaluating RT and MTT, respectively. Baur’s research revealed that the TTP showed significant differences between benign lesions and PCa (AUC 0.65) [32]. In our study, RT and MTT demonstrated significant performance, as reported in the literature, which reflected the hypothesized hypervascularity owing to angiogenesis during tumor growth [30], and RT was the only independent factor by multivariable logistic regression analysis. The TTP showed no significance in our analysis, which may be due to sample differences.
Radiomic models have mostly been used with mpMRI to discriminate PCa, predict the GS score, identify lesions, and plan radiotherapy. However, studies on ultrasound-based radiomics are rare. Lorusso’s et al. retrospectively analyzed data from 64 patients with PCa followed by a computerized artificial neural network analysis of the TRUS based on an artificial intelligence, and on a per-sectors analysis, the sensitivity, specificity and accuracy were 62%, 81%, and 78% respectively [26]. Wildeboer et al. studied 48 patients demonstrating that multiparametric machine learning combined with B-mode, shear-wave elastography (SWE), and CEUS radiomics achieved ROC curves of 0.75 and 0.90 for PCa and significant PCa, respectively [24]. In our study, a more widely used pyradiomic approach was adopted together with risk factors, which also demonstrated that the Rad-score can improve diagnostic performance and the clinical net benefit in PCa distinction.
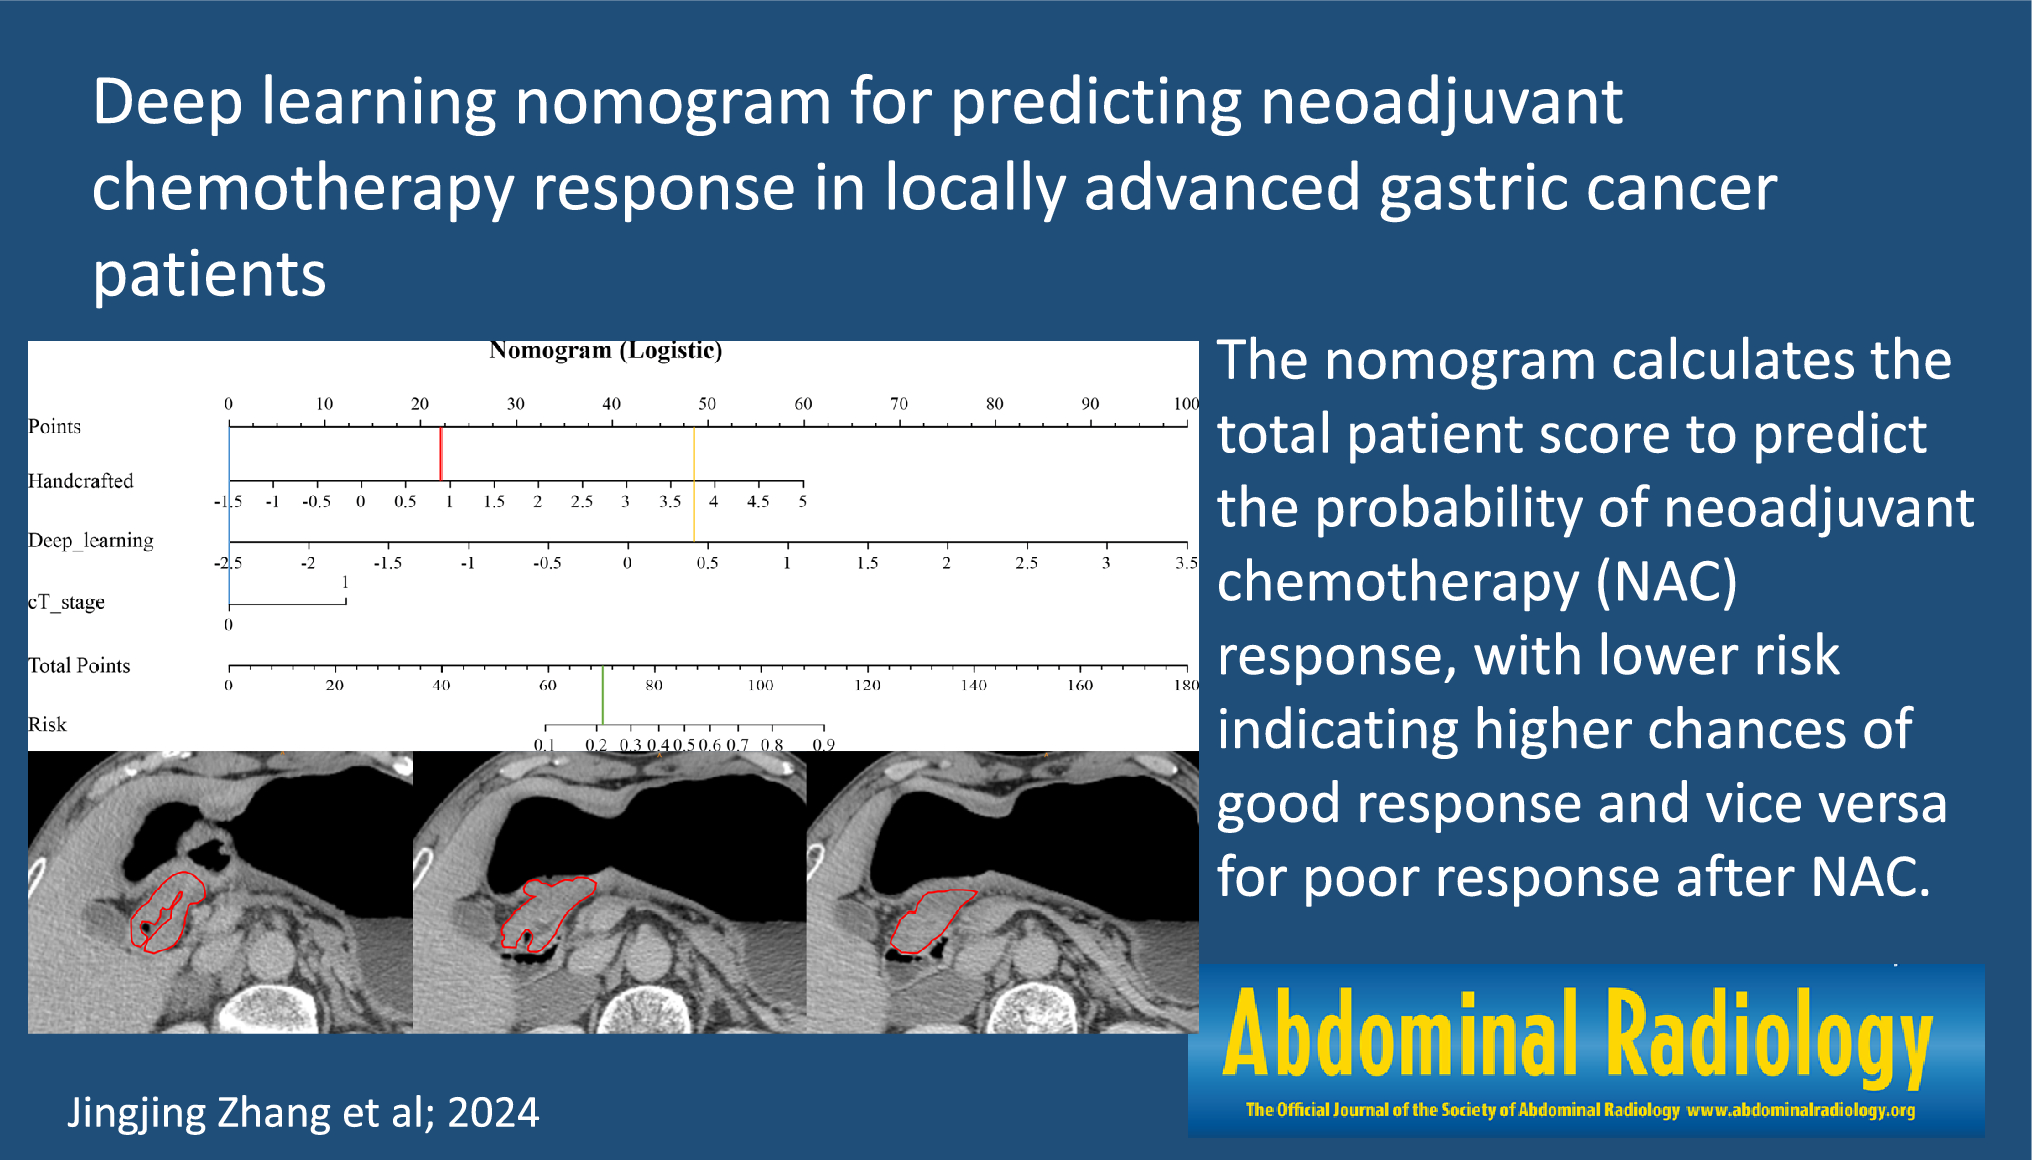
To date, nomograms have been widely used in the medical field. In our research, by using risk scores, we validated a combined risk factors-radiomics combined nomogram including age, tPSA, PSAD, RT, and Rad-score to diagnose PCa, providing a more quantifiable, distinct, and individualized auxiliary tool to clinicians.
Despite a positive role for the prediction model in PZ PCa detection, we acknowledge further limitations of the present study. First, this is a single-center analysis with a small population, and although the radiomics features differed between different GSs [33], they were not separated in our research because of the sample size. Therefore, larger, multicenter datasets are needed. In addition, manual segmentation might influence stability and repeatability, and automatic segmentation may be used to solve this problem in the future. Furthermore, ultrasound may be restricted by a large prostate volume because of the far-field attenuation effect. Last, the quantitative perfusion analysis relied on one cross-sectional image, providing limited information, which can possibly be overcome by 3D/4D-ultrasound probes.


留言 (0)