
記住我


Based on the above reasons, this study aimed to measure BMD and HU values after maxillary and mandibular reconstruction with the fibula, analyze the correlation between them, and discuss whether the HU value can be used to monitor the changing trend of fibular BMD after jaw reconstruction.
This study included patients who underwent maxillar/mandibular reconstruction with a fibular flap at the Department of Oral and Maxillofacial Surgery, Peking University School of Stomatology, Beijing, China, between September 2021 and September 2022. The inclusion criteria were as follows: (1) at least one segmental fibula used to repair the alveolar ridge area and (2) spiral CT examination performed 1 week after the surgery and at least one CT examination performed 3–9 months after the surgery. The exclusion criteria were as follows: (1) patients with titanium plate exposure, infection, or flap failure after surgery; (2) patients with bone metabolism disease; (3) patients who could not undergo CT examination for some reason; and (4) patients who received postoperative radiotherapy/chemotherapy. This study adhered to the principles of the Declaration of Helsinki and was approved by the Institutional Ethics Committee of Peking University School and Hospital of Stomatology (Approval No: PKUSSIRB-202282159). Informed consent was obtained from those who participated.
Spiral CT photographyCT images [120 kV, 25 mA, section width = 1.25 mm] were acquired immediately after the surgery (1 week after the surgery) and 3 and 6 months after the surgery. The patient was placed in a supine position, the head was placed at the center of the headrest, and the Frankfurt Plane was kept vertical to the ground. The patients were instructed to occlude the posterior teeth. A calibration phantom was used to calibrate the BMD values obtained using the QCT software each day to obtain the most accurate measurement data. The scanning data were simultaneously transmitted to the Picture Archiving and Communication System (PACS) in Digital Imaging and Communications in Medicine (DICOM) format and to the QCT workstation in QCT file format. The patients underwent spiral CT (BrightSpeed Edge Select 16 slice, Ge, USA, 120 kv, 25 mAs) of the oral and maxillofacial regions.
HU value measurementThe fibula was observed using a bone window (800 HU), and the HU value was measured using the PACS software (Carestream Health Inc., Rochester, NY, USA).
Measurement methodThe observation plane was adjusted. First, the cross-section was parallel to the occlusal plane, and the sagittal plane was perpendicular to the cross-section and parallel to the midline of the maxillary dentition. The sagittal plane was then moved to the fibula reconstruction site, and the cross-sectional and coronal plane directions were adjusted to be consistent with the long axis of the fibula. Subsequently, a circular region of interest (ROI) with a diameter of approximately 5 mm (5 ± 0.5 mm) was created on the cross-section. The center of the circle coincided with 25%, 50%, and 75% of the length of the fibular axis, and the HU value of the corresponding part was measured (Fig. 1). We measured each point three times and calculated the average value as the final outcome to minimize the errors.
Fig. 1
ROI of measurement. HU value and BMD were measured at 25%, 50%, and 75% of the fibula long axis, and the ROI diameter was 5 mm (5 ± 0.5 mm). ROI, region of interest; BMD, bone mineral density; HU, Hounsfield unit
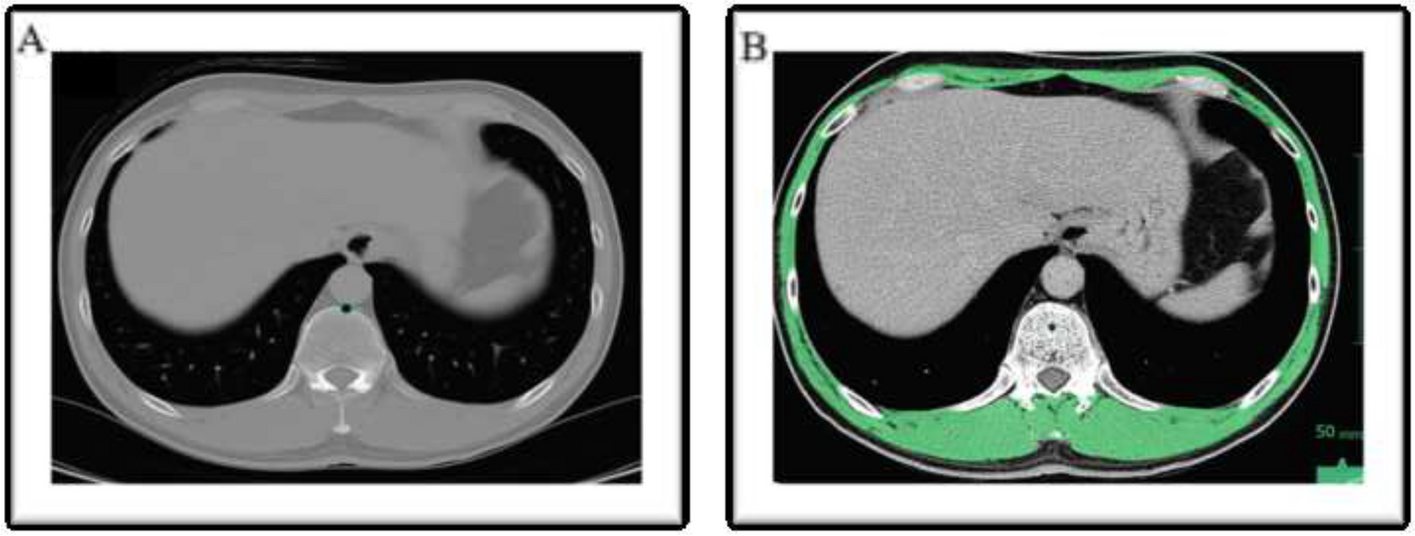
BMD value measurementUsing the same CT image, the fibula was measured again using the QCT Pro 6.1 software (Mindways Software, Inc., Austin, TX, USA), and the corresponding BMD was obtained. The measurement method was as follows: first, the X-axis of the sagittal plane was adjusted to be parallel to the occlusal plane in the “rotation” interface, and then, the Y-axis of the cross-section was adjusted to be parallel to the midline of the dental arch of the jaw. The sagittal plane at the level of the transplanted fibula was adjusted, and the X-axis of the sagittal plane was adjusted parallel to the long axis of the fibula. Then, the cross-sectional level was adjusted to the uppermost point of the fibula alveolar side (superior side when the fibula was used to reconstruct the mandible and the inferior side when it was used to reconstruct the maxilla), and the 25%, 50%, and 75% sites corresponding to the axial length of the graft bone flap were used as the measurement sites. Then, a circular ROI was manually selected with a diameter of approximately 5 mm and a depth of 1 mm on the “ROIs” interface. The center of the ROI coincided with the yellow criss-cross selected on the “rotation” interface. The position in the sagittal plane was 1 mm adjacent to the uppermost point of the fibular alveolar side, and the corresponding BMD values were obtained (Figs. 1 and 2). The calculation of BMD was the same as that of the HU value. In this section, we measured each point three times and calculated the average value as the final outcome to minimize errors as much as possible.
Fig. 2
BMD measurement. The figure shows the average BMD measured at different positions 1 mm below the uppermost point of the fibular alveolar side. BMD, bone mineral density
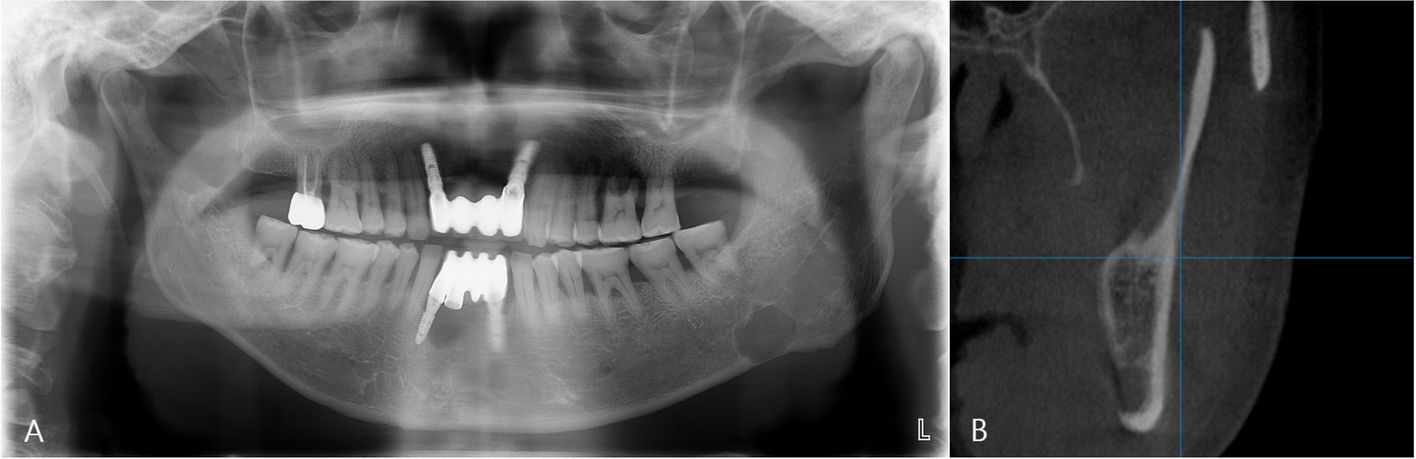
In the process of selecting the ROI, the effects of the titanium plate, titanium nail, or implant on the measurement may be encountered. For example, sometimes the measurement sites were located between two adjacent titanium nails. If we chose 5 mm as the diameter of ROI when the actual distance between two adjacent titanium nails was less than 5 mm, then the result might be influenced as ROI involved the metal artifacts. Thus, the diameter of ROI should be adjusted in case such an error occurred. Therefore, the actual distance between two adjacent titanium nails was chosen as the final diameter of ROI in such circumstances. However, if the distance between adjacent titanium nails was more than 5 mm, then 5 mm was selected as the diameter of ROI routinely (Fig. 3).
Fig. 3
Method of adjusting and selecting ROI diameter. If we chose 5 mm as the diameter of ROI when the actual distance between two adjacent titanium nails was less than 5 mm, then the result might be influenced as ROI involved the metal artifacts. Therefore, the actual distance between two adjacent titanium nails was chosen as the final diameter of ROI in such circumstances. However, if the distance between adjacent titanium nails was more than 5 mm, then 5 mm was selected as the diameter of ROI routinely. ROI, region of interest
Index calculation equationAbsorption rate = (HU value or BMD value at 1 week after surgery – HU value or BMD value at 3 and 6 months after surgery)/(HU value or BMD value at 1 week after surgery). The difference between each pair of absorption rates (DAR) was calculated as the absolute value of (BMD absorption rate at 3 and 6 months after surgery – HU value absorption rate at 3 and 6 months after surgery).
Statistical analysisStatistical Package for the Social Sciences version 26.0 (IBM Corp., Armonk, NY, USA) was used for statistical analysis. The intraclass correlation coefficient was used to verify the measurement stability of each study. Data were expressed as mean ± standard deviation. Correlation analysis was used to verify whether there was a correlation between the HU value and QCT BMD value and whether the HU value or BMD changed with time. The linear regression equation between HU and BMD was calculated using linear regression analysis. One-way analysis of variance was used to test whether there were significant differences in the HU or BMD values at different follow-up times. A paired-sample t test was used to verify whether the absorption rates of HU and BMD were consistent at the same follow-up. A correlation test was used to verify whether there was a correlation between sex, age, reconstruction site, tumor nature, body mass index (BMI), HU value, and BMD absorption rate. Statistical significance was set at P < 0.05.
留言 (0)