
記住我
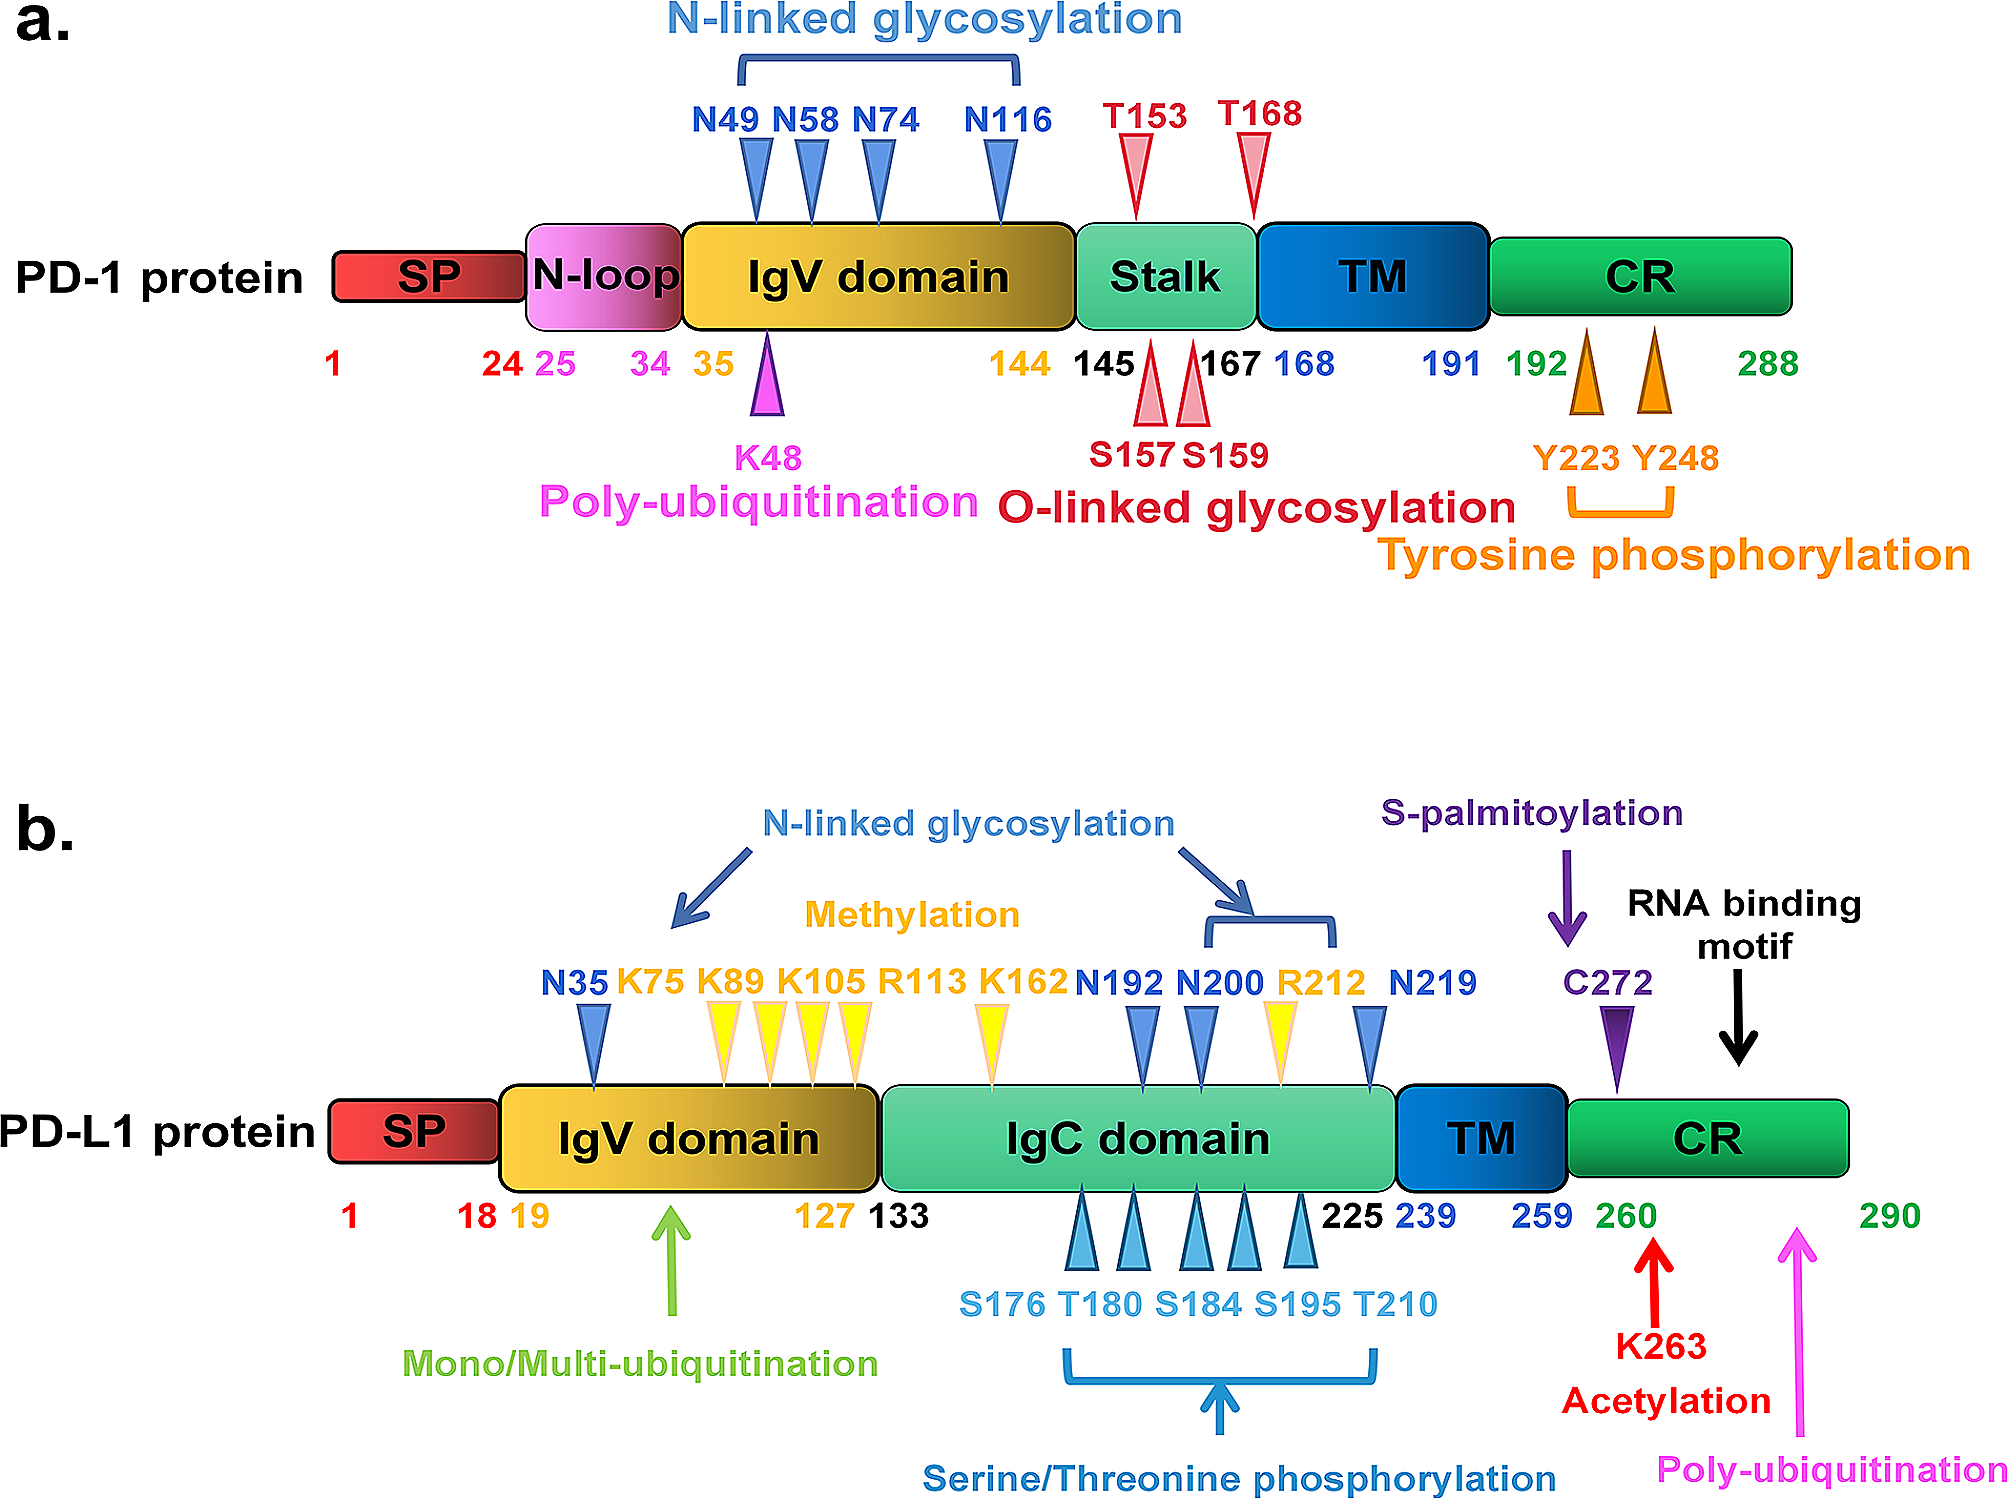
The scRNA-seq analysis was performed on four tumor samples from two patients with PCa to determine their cellular composition (Fig. 1A). Single-cell transcriptomes from a total of 32,766 cells were obtained, of which 16,717 cells were from the primary lesion and 16,049 cells were from LNM (Tables 2 and 3). UMAP analysis identified 14 major groups based on genetic profiles and typical marker genes of the cells (Fig. 1B and D; Supplementary Material 10–11). Their specific contents were as follows: (1) CD8 + T cells with high expression of GZMK, CD8A, and IFNG; (2) luminal cells specifically expressing KRT18 and EPCAM; (3) fibroblasts with high expression of ACTA2 and TAGLN; (4) NK cells with high expression of GZMB, NKG7, and GNLY; and (5) monocytes specifically expressing HLA-DRA, C1QA, and C1QB, as well as marker genes in other cell types (Fig. 1D). The results showed the expression profiles of the top 10 highly expressed genes in each cell type, as well as the cell proportion of each cell type (Fig. 1C and E, Supplementary Material 12). Notably, all cell types were present in each primary lesion sample, while basal cells and neutrophils were nearly absent in metastatic lesions (Fig. 1C, Tables 2 and 3). Significant differences in TME cell composition implied obvious heterogeneity between primary lesions and lymphatic metastases. Basal cell subpopulation in our study was not found in lymphatic metastasis lesions, which is consistent with previous findings on basal cell loss and luminal cell expansion in PCa [16].
Fig. 1
Fourteen cell types in PCa were identified by scRNA-seq. (A). Study flow chart; (B). Main cell clusters in PCa tissue demonstrated using uniform manifold approximation and projection (UMAP) analysis are colored and labeled according to their featured gene expression profiles. (C). Cell numbers and percentages of each cluster in each sample; (D). Marker gene expression for each cell type, where dot size and color represent percentage of marker gene expression (pct. exp) and averaged scaled expression (avg. exp. scale) value, respectively; (E). Heatmap generated based on expression levels of top ten marker genes in each cluster
Table 2 The number of cells in each cell population Table 3 The cell number of each cell population in each sample Transcriptional heterogeneity and InferCNV of luminal cellsAccording to previous studies, luminal and basal cells are the possible initiating cells of PCa [17]. UMAP analysis of luminal cells identified a total of seven subgroups (Fig. 2A) and demonstrated gene expression patterns in different luminal cell subgroups (Fig. 2B, Supplementary Material 13). The top five merker genes in each subgroup of luminal cells were also demonstrated (Fig. 2C), which were EEF1A2, HBB, IGKC, NPY, and FOLH1 in the luminal 1. HBB and IGKC were highly expressed in the luminal 5, while NPY and FOLH1 were highly expressed in the luminal 7 (Fig. 2C). GSVA showed that MYC and oxidative phosphorylation signaling pathways were enriched in the luminal 1 subgroup, while TNF-α signaling pathway activity was enhanced in the luminal 3 subgroup. In addition, the luminal 4 subgroup had high protein secretion and androgen response pathway enrichment score, while the E2F and G2M signaling pathways were enriched in the luminal 6 subgroup. The luminal 7 subgroup demonstrated enhanced activity in the angiogenesis signaling pathway (Fig. 2D).
Fig. 2
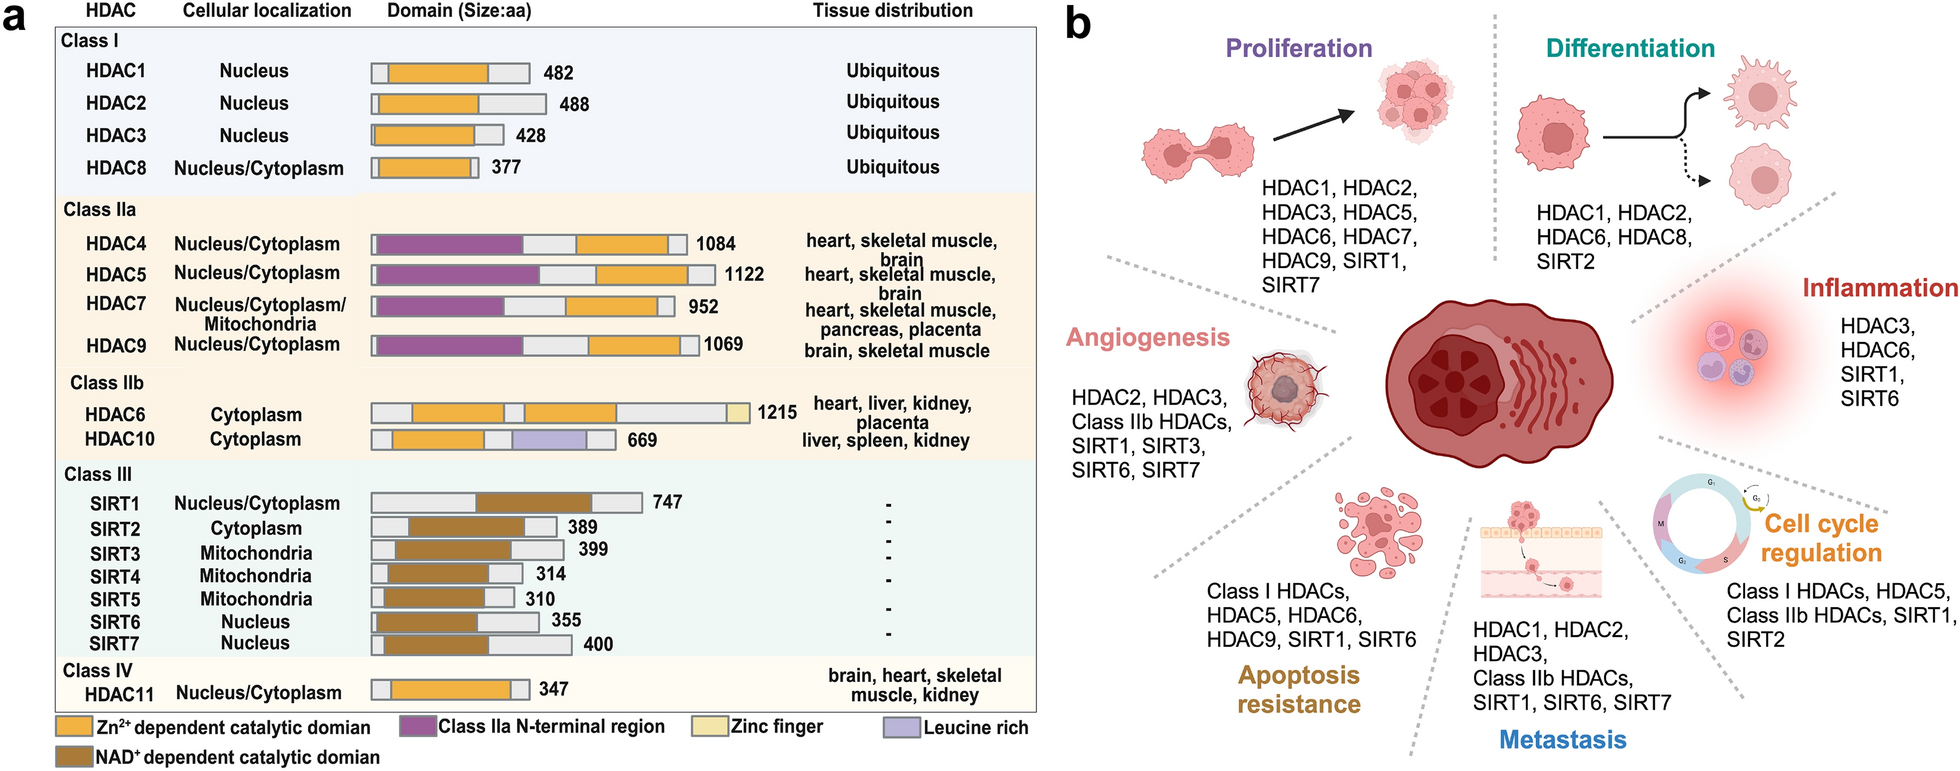
Heterogeneity and CNV analysis of luminal cells; (A). Seven main luminal subgroups identified using UMAP analysis; (B). Feature plots for marker genes; Color legend shows log1p normalized gene expression levels; (C). Heatmap of average expression for top five DEGs among seven subgroups. Color legend indicates normalized gene expression levels among subgroups; (D). GSEA heatmap for 50 hallmark gene sets in MSigDB database among seven luminal subclusters; (E). Hierarchical heatmap showing large-scale CNVs in seven luminal subgroups; (F). Differential analysis heatmap of transcriptional regulators among seven luminal subgroups; (G). Luminal subgroups in primary and metastatic lesions identified using UMAP analysis; (H). Scatter plot of DEGs between primary lesion and lymphatic metastases. Top 10 DEGs are labeled in red; (I). Functional enrichment DEG analysis in primary lesion and lymphatic metastases. (J). Heatmap of activated transcription factors in lymphatic metastases and primary lesions. Red indicates high activity, and blue shows low activity
The InferCNV algorithm was used to identify chromosomal CNAs to further verify the presence of malignant cells in the seven luminal subgroups. As described previously [18], this method can identify typical PCa genomic alterations [10, 19], including the chromosome 8q gain and chromosome 8p, 13, and 16q loss. Chen et al. found that only an inflection point was observed in a few PCa samples, which can separate putative malignant cells from non-malignant cells in PCa. However, this distinction was not so precise in other samples [17], which may be because some localized PCa tumors have been shown to have a silent genome [20]. Furthermore, previous DNA sequencing studies have revealed that 0–50% of PCa genomes have CNAs and that CNAs are also a prognostic factor for PCa [21]. Moreover, the subclone CNA load far exceeds the clonal load in most PCa cases [22]. The InferCNV results of our study are shown in Fig. 2E. All cells in the luminal subgroups 1 and 5, as well as 3 and 7, were clustered together. All cells in the other subgroups were grouped separately (Fig. 2E). In the CNA heatmap, red and blue represent excessive and low gene expression values in the fragment chromosomes, respectively. This means that the darker the red color, the higher the degree of chromosome amplification, and the darker the blue color is, the higher the degree of chromosome loss. Therefore, the study results showed that luminal subgroups 1 and 5, as well as 3 and 7, had a much higher degree of chromosome CNAs than other clusters. Therefore, cells in the luminal subgroups 1 and 5, as well as 3 and 7, may be malignant ones (Fig. 2E). Furthermore, luminal subgroups 1 and 5 only appeared in metastatic lesions, implying that these two subgroups may contain cells with metastatic ability among the malignant cells (Fig. 2G). The DEGs and their functional enrichment between primary lesion and LNM were further analyzed to reveal specific gene expression patterns of LNM in PCa (Fig. 2H-I, Supplementary Material 14). The results showed that the main enriched functional DEG pathways were immune-related, such as regulation of leukocyte and lymphocyte activity and B cell activity (Fig. 2I), indicating that tumor immunity may contribute to lymphatic metastasis in PCa. Furthermore, the transcriptional regulators of luminal cells were analyzed and compared between primary lesions and LNM (Fig. 2F and J). JDP2, IRF1, ENO1, HOXB2, IRF8, NELFE, ESRRA, SP8, KLF9, SF1, TFAP2A, IRF7, CREB3, GTF2F1, MXI1, CREB5, EGR3, FOXO3, NFATC3, and CREM were all activated in LNM, but not in the primary lesions (Fig. 2F and J; Supplementary Fig. 1A–G). In particular, the expression of NELFE in lymphatic metastases was significantly higher than that in the primary lesion. It has been reported that NELFE can promote the invasion and metastasis in many cancers. Therefore, the above results demonstrated that these TFs may be involved in lymphatic metastasis of PCa (Fig. 2J, Supplementary Fig. 1H). Subsequently, markers gene EEF1A2 and CCL5 with specificity in EEF2 + and FOLH1 + luminal subgroups were selected for immunohistochemical staining on our PCa tissue chips, and the results showed negative results in normal tissues.The positive expression of some PCa cells in the primary and lymphatic metastases suggests the existence of these two subgroups of cells in PCa (Fig. 3A). Immunofluorescence demonstrated that MEEF1A2 and CCL5 were all expressed in LNCap cells (Fig. 3B). Down-regulating the expression of MEEF1A2 and CCL5 in LNCap cells could significantly reduced the ability of cell proliferation and metastasis ((Fig. 3C-F).
Fig. 3
EEF2 + and FOLH1 + luminal cells existed in PCa. (A). Immunohistochemistry analysis of CCL5 and EEF1A2 through PCa tissue microarray; (B). Immunofluorescence of CCL5 and EEF1A2 in LNCap. (C-D). EDU showed the cell proliferation capacity of LNCaP after CCL5 and EEF1A2 down-regulation. (E–F). Metastatic ability of LNCAP cells was analyzed using transwell assay after down-regulation of CCL5 and EEF1A2
MYC may promote lymphatic metastasis by promoting tumor cell progression and immunosuppressionThe luminal subgroups 1 and 5 appeared in the lymphatic metastases. The MYC pathway was also shown to be enriched in these cells and was therefore investigated further. MYC is a well-known oncogene that belongs to a class of nuclear gene family that includes C-MYC, N-MYC, and L-MYC [23]. A study from Science found that MYC inhibition in mouse tumors reduced the CD47 and PD-L1 mRNA and protein levels and enhanced antitumor immune responses [24]. Therefore, MYC can promote tumor progression directly as well as give rise to tumor immunosuppression, which can indirectly result in tumor progression by regulating CD47 and PD-L1. In our study, the microarray IHC results showed that MYC was expressed in the nucleus and cytoplasm, and its expression in PCa tissues was significantly stronger than that in normal prostate tissues. Importantly, the MYC expression in LNM was significantly higher than that in the primary lesions (Fig. 4A), indicating a relationship between MYC and PCa metastasis. The immunofluorescence results demonstrated that MYC, PDL1, and CD47 were all expressed in LNCap cells, while PDL1 and CD47 were mainly expressed in the cytosol (Fig. 4B). Results obtained from the NCBI (https://www.ncbi.nlm.nih.gov/) and JASPAR (https://jaspar.genereg.net/) databases showed that the promoter regions of PDL1 and CD47 had binding sites for MYC, demonstrating that PDL1 and CD47 were the target genes of MYC (Fig. 4C). After further down-regulating the expression of MYC in LNCap cells via plasmid transfection, it was found that the mRNA and protein levels of PDL1 and CD47 were significantly down-regulated(P < 0.05) (Figure.4D-F). Moreover, the Transwell results indicated that down-regulation of MYC expression significantly reduced the metastatic ability of LNCap cells (P < 0.05) (Fig. 4G-H).
Fig. 4
MYC drives tumor progression through CD47 and PD-L1. (A). Immunohistochemistry analysis of MYC through PCa tissue microarray; N: Normal prostate tissue, T: Prostate cancer tissue, LM: lymphatic metastases; (B). Immunofluorescence of MYC, PDL1, and CD47 in LNCap; (C). Bioinformatics analysis of binding sites of MYC to PDL1 and CD47; (D). MYCmRNA, PDL1mRNA, and CD47mRNA expression in LNCaP after MYC down-regulation. (E–F). MYC, PDL1, and CD47 western blot protein expression analysis in LNCaP; (G–H). Metastatic ability of LNCAP cells analyzed using transwell assay after down-regulation of MYC.
Luminal cell trajectory analysisThe cell trajectory results are shown in Fig. 4, where Monocle 2 divided all luminal cells into seven states (Fig. 5B). Figure 4A shows the differentiation trajectory of cells according to their cluster after dimensionality reduction clustering by Seurat. Clusters 0 and 4 were distributed on the right side of the figure, while clusters 2 and 6 were distributed on the left side of the figure. The other three clusters (1, 3, and 5) were located in the lower part in the middle of the figure (Fig. 5A). Furthermore, the differentiation trajectory of the luminal cells took the second branch points as an important turning point from the right to the left and lower part of the figure (Fig. 5C). Therefore, the overall differentiation of luminal cells occurred from clusters 0, 1, and 4 to clusters 2, 3, and 6. The InferCNV results showed that clusters 0, 2, 4, and 6 were potential malignant cells, while clusters 1, 3, and 5 were non-malignant cells. The two clusters 0 and 4 were metastatic cells, implying that cancer cells with metastatic ability were early occurrence (Fig. 5C, Supplementary Fig. 2). Moreover, the differentiation direction of malignant cells was different from that of the non-malignant cells.
Fig. 5
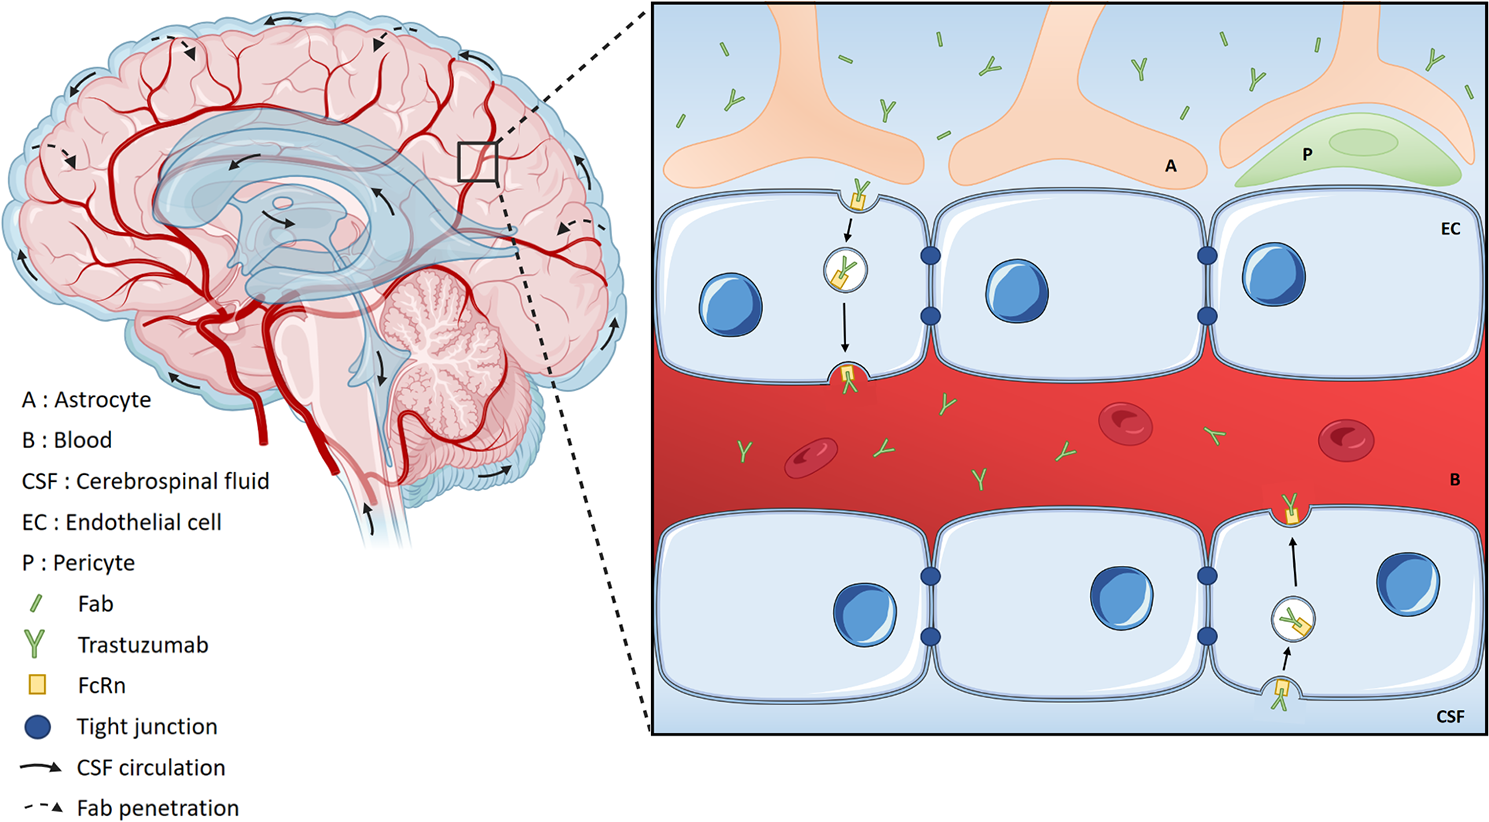
Luminal cell trajectory analysis. (A–C). Monocle 2 trajectory plot showing luminal subcluster and state dynamics; (D). Three representative genes with different expression patterns in the process of luminal cell differentiation: MAZ, POTEN, and SPN; (E). Hierarchical clustering heatmap showing four subclusters of differentially expressed genes along with luminal cell pseudotime. (F). Hierarchical clustering heatmap showing four subclusters of differentially expressed genes along with pseudotime for three cell types (from cell fate1 to cell fate2)
Next, the transcriptome changes during luminal cell differentiation were explored. Representative genes with different expression characteristics were selected to observe their dynamic changes during cell differentiation (Fig. 5C). MYC-associated zinc-finger protein (MAZ) plays a transcriptional regulatory role in some important genes, including MYC, RAS, and CT-1. Moreover, MAZ contributes greatly to the occurrence and development of PCa [25]. MAZ expression first increased and then decreased sharply with cell differentiation time (Fig. 5D). Sialophorin (SPN), also known as LSN and CD43, is a transmembrane salivary glycoprotein. In addition to being present in mature red blood cells and immune cells, SPN has also been found to be expressed in hematopoietic cells [26,27,28]. Accompanied by luminal cell differentiation, SPN gene expression initially remains unchanged for a short time at baseline, followed by a sharp increase, a mild decline, and a final rapid increase (Fig. 5D). The expression changes of MYC, PDL1, and CD47 in the trajectory process of luminal cell were further investigated. The results showed that MYC expression showed an initial short-term increase, followed by a decrease, return to the baseline level, and a final increase. CD47 showed a sharp increase that was then maintained. Interestingly, the expression of PDL1 (CD274) did not change in the whole cell trajectory process (Supplementary Fig. 3). The above results indicated that MYC and CD47 were involved in the differentiation of luminal cells. Finally, the visualization and clustering results for the characteristic genes expression changes during luminal cell differentiation are shown in Fig. 5E. Subsequently, luminal cells were divided into cell fate 1, pre-branch, and cell fate 2 subsets according to the differentiation process. During the process of luminal cell differentiation from cell fate 1 to cell fate 2, all of the changed genes could be clustered into four categories based on their expression levels (Fig. 5F).
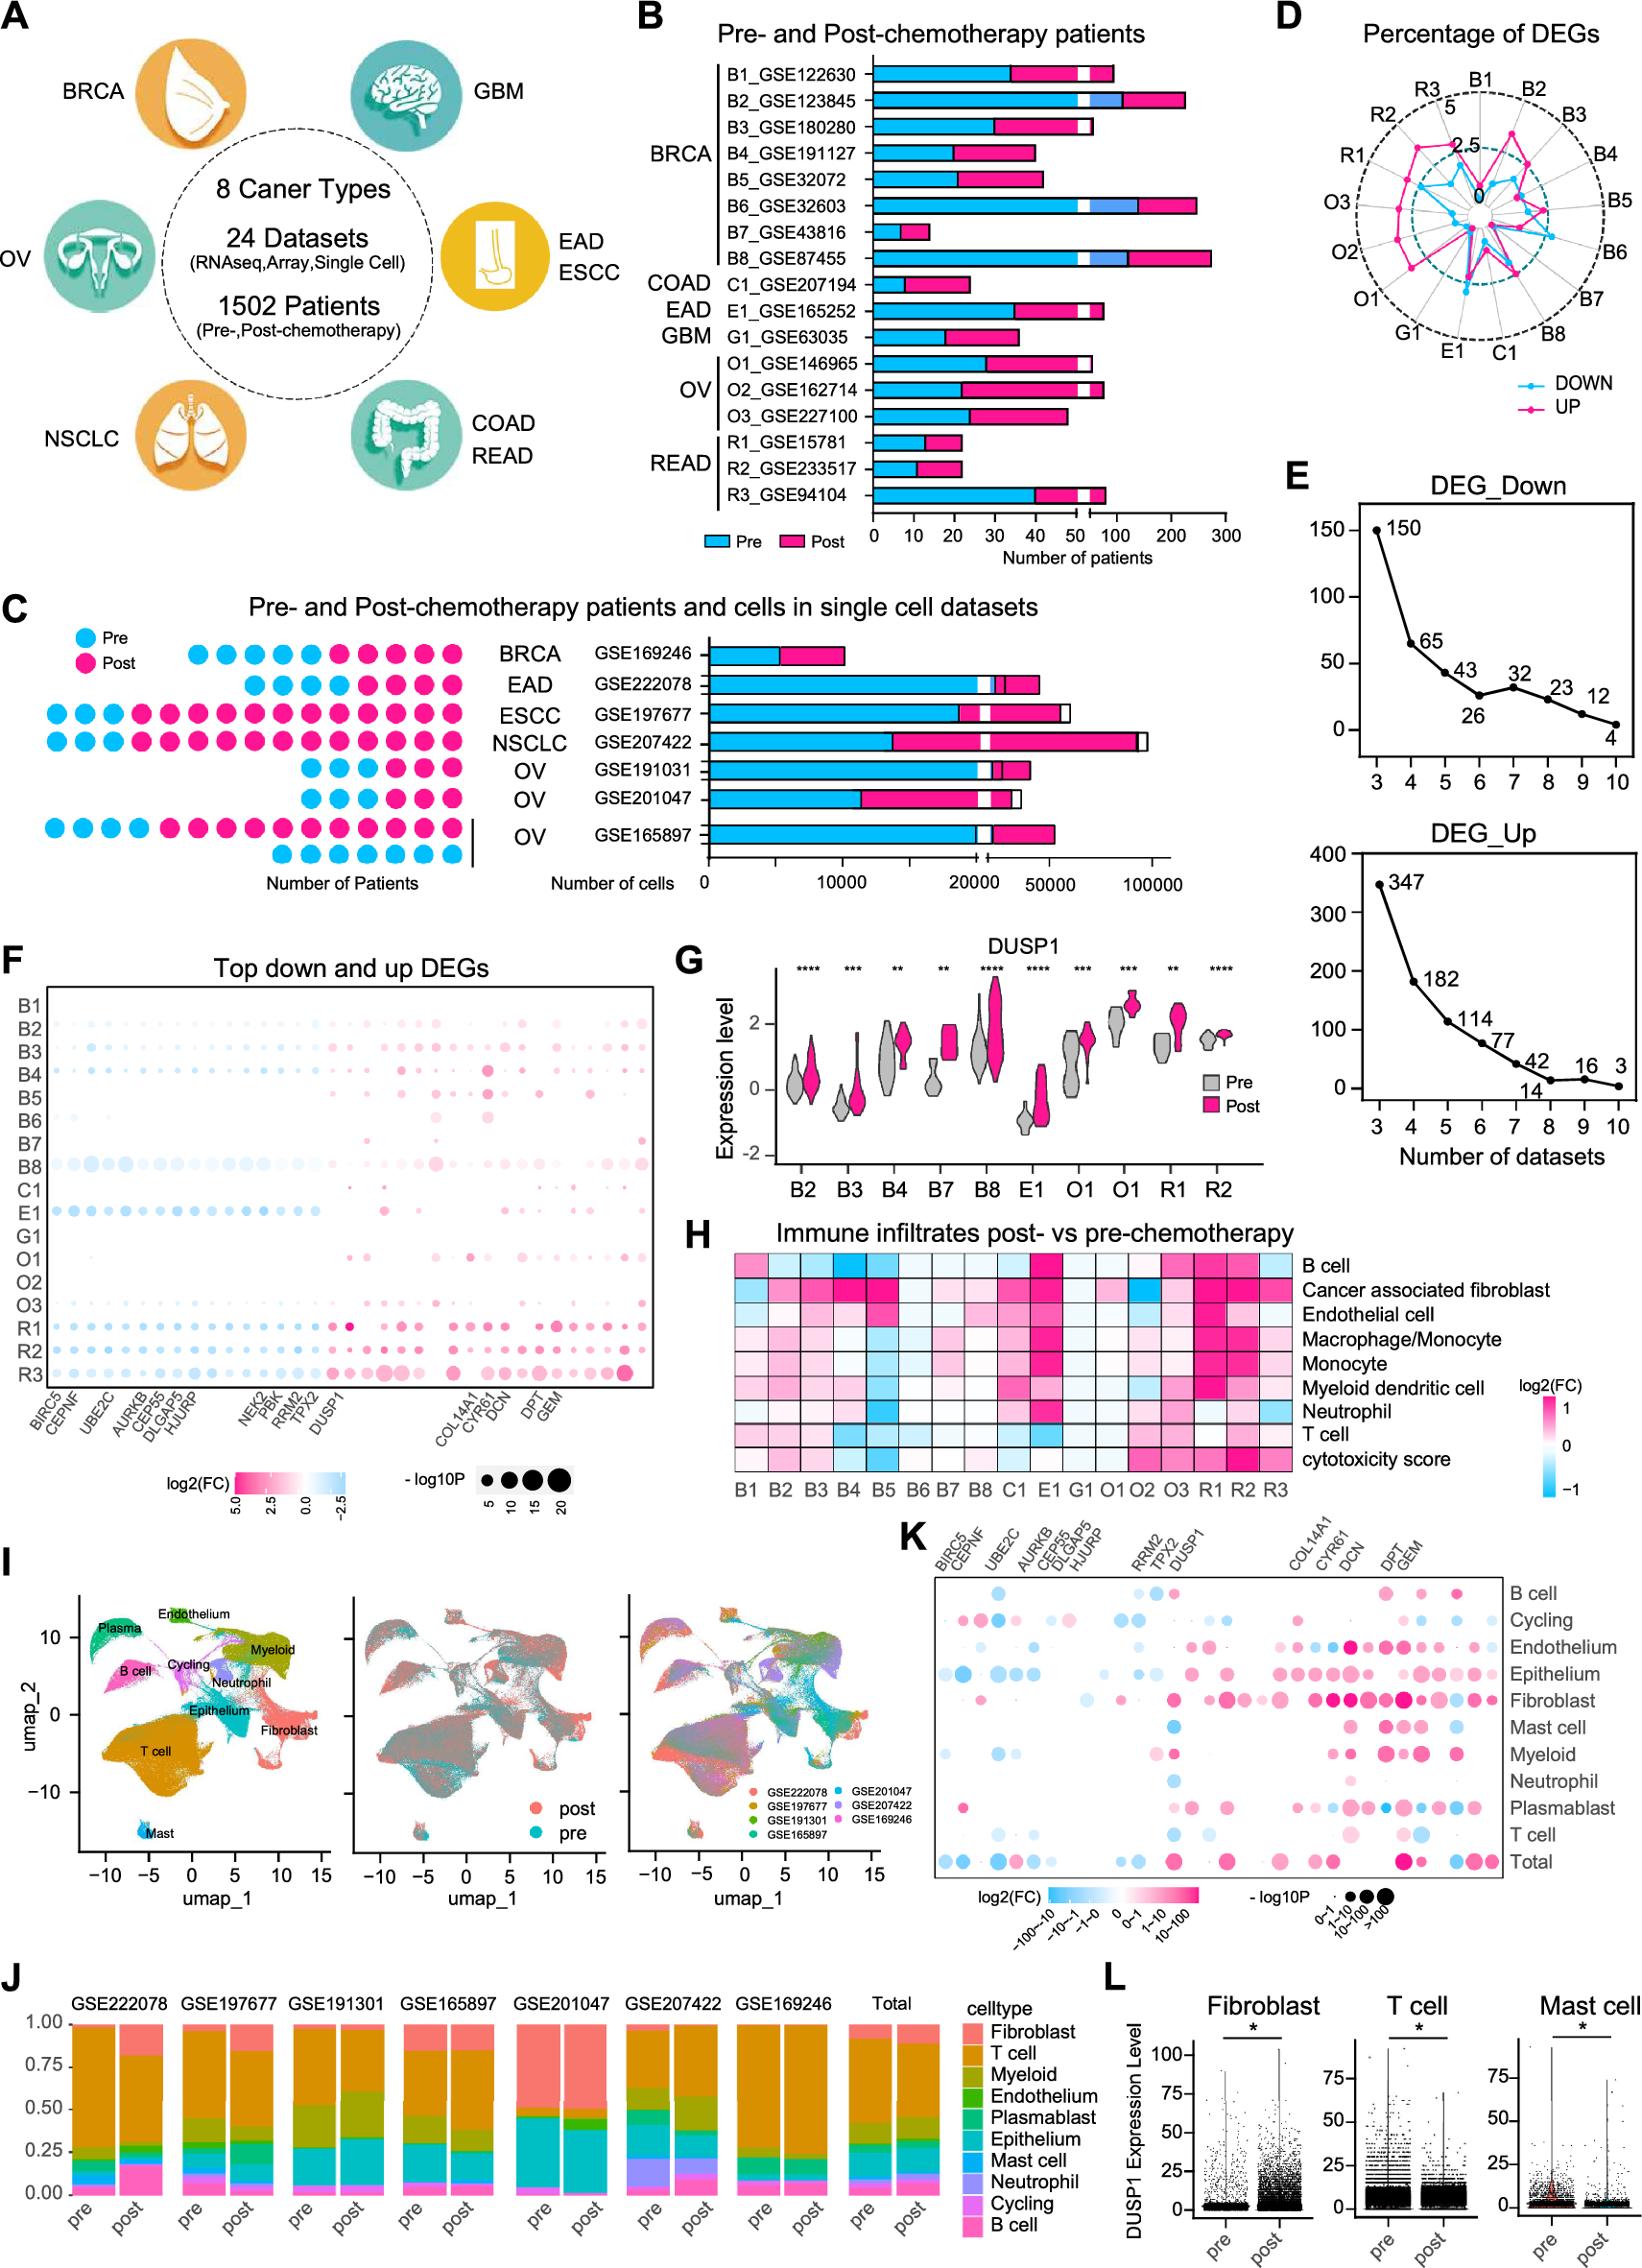
Heterogeneous characterization of CD8 + T cells in primary and lymphatic metastatic lesionsHigh heterogeneity in T cell type composition, gene expression patterns, and functional properties can significantly affect the outcome of T cell-based immunotherapy [29]. In tumor immunity, CD8 + T cells usually have a crucial antitumor role. However, tumor-mediated depletion of T cells prevents CD8 + T cells from exerting normal cytotoxicity, resulting in immunosuppression [30]. In our study, 5,843 CD8 + T cells were identified (3,069 in the primary lesion and 2,774 in the metastatic lesion). The proportion of CD8 + T cells in the metastatic lesion was significantly smaller than that in the primary lesion (Tables 2 and 3), implying the possibility of immunosuppression or more obvious T cell depletion in the metastatic lesion. A total of four subsets of CD8 + T cells were identified using UMAP analysis of CD8 + T cells (Fig. 6A, Supplementary Material 15). Furthermore, the results showed that the proportion of subsets 0 and 3 in the metastatic lesions was significantly higher than that in the primary lesions (Fig. 6C). Moreover, among the marker genes, CCR7 was only expressed in subsets 0 and 3 (Fig. 6C). Studies have found that CCR7 promotes tumor development by promoting tumor cell proliferation and metastasis, encouraging proteolytic enzyme secretion, and inducing angiogenesis and immunosuppression [31,32,33,34,35,36], which is consistent with our findings, where CD8 + T and other tumor immune cell levels decreased and underwent transcriptional recombination, resulting in significant immunosuppression in lymphatic metastases. In addition, the GSVA results in our study showed that pathways enriched in subsets 0 and 3 included Hedgehog signaling, notch signaling, angiogenesis, and MYC pathways, which are associated with tumor proliferation and progression (Fig. 6F). These results indicated that marker genes expressed by subsets 0 and 3 had the characteristics of tumor genes, which can promote tumor proliferation and metastasis as well as cause tumor immunosuppression. The proportion of subset 2 was also significantly smaller in the metastatic lesion than in the primary lesion (Fig. 6B), and NR4A3, DUSP4, and RGS1 were the marker genes with a higher expression (Fig. 6C). The GSVA results in our study showed that pathways enriched in subset 2 included apoptosis, EMT, oxidative phosphorylation, and DNA repair (Fig. 6F). These results confirmed that marker genes expressed in the subset 2, such as NR4A3, can restrain PCa metastasis by mediating the MT-2 signaling pathway, showing the opposite function to that of CD8 + T cell subsets 0 and 3. These results demonstrated that T cell heterogeneity and immunosuppression in TME may be important causes of LNM in PCa. Further analysis of DEGs between primary lesions and lymphatic metastases showed that IGKC and JUNB were highly expressed in the metastatic lesions. JUNB (JunB proto-oncogene) is a protein-coding gene that can act on the DAP12 receptor in NK cells to regulate the immune response. Primary cutaneous T-cell lymphoma and anaplastic large cell lymphoma are closely related to JUNB [37]. Functional enrichment pathway analysis of DEGs showed that these genes were mainly concentrated in cytoplasmic translation, T cell activation, positive regulation of leukocyte activation, immune response regulation, leukocyte adhesion, and other immune-related pathways (Fig. 6D and E). These results further demonstrated that CD8 + T cells in lymphatic metastasis of PCa had the characteristics of promoting tumor progression and leading to immunosuppression. Principal component analysis of different T cell groups in the immune microenvironment of breast cancer by Azizi et al. revealed that T cells were in a continuous activation and differentiation trajectory, and their phenotypic diversity was jointly determined by various environmental stimuli and T cell receptors [38]. Zheng et al. used the Monocle 2 algorithm to analyze the developmental trajectory of T cells and found that CD8 + T cells had a state transition process from activation to depletion, and that GZMK + subsets were the intermediate states in this transition process [39]. Our trajectory analysis of CD8 + T cells found that most of the CD8 + T cells in metastasis were located in the middle and posterior segment of the whole cell differentiation, and CD8 + T cells showed a high expression of cytotoxic markers GZMM and GZMB (Supplementary Fig. 4, Supplementary Material 15), implying that GZMK + subsets in PCa were intermediate states in the CD8 + T cell transition process.
Fig. 6
Heterogeneity analysis of CD+8 T cells between primary and metastatic lesions; (A). Subcluster of CD+8 T distribution between primary and metastatic lesions using UMAP-2 analysis; (B). Percentage of four CD+8 T subclusters between primary and metastasis lesions; (C). Violin plots showing normalized marker gene expression levels across four subclusters of CD+8 T cells; (D). DEGs in metastasis identified using edgeR package with comparison to primary lesion. Scatter plots showing respective DEG profiles in PCa. Red spots indicate up-regulated genes; green spots indicate no significant gene change; (E). Functional DEG enrichment analysis; (F). GSEA heatmap of 50 hallmark gene sets in MSigDB database among four CD+8 T cell subclusters
Heterogeneity of monocytes in primary and lymphatic metastatic samplesMyeloid cells are another important component in TME in addition to lymphoid cells. Nirschl et al. determined the transcriptome of monocytes in the microenvironment of lymph node metastatic melanoma and found that these cells up-regulated the expression of genes related to immune homeostasis, indicating that tumors might use the mechanism of the body regulating autoimmune homeostasis for immune escape [40]. In our study, a total of 1,203 monocyte cells were identified (930 in primary lesions and 273 in metastatic lesions), and the number and proportion of monocyte cells in lymphatic metastatic lesions were significantly smaller than those in the primary lesions (Tables 2 and 3). UMAP analysis of monocyte cells identified a total of six subsets (Fig. 7A, Supplementary Material 16). In addition, cell proportions in subsets 1, 2, 4, and 5 in the metastatic lesions were higher than those in the primary lesions. BIRC3 overexpression was found in all four subsets, while subsets 1 and 2 simultaneously overexpressed the M1 characteristic gene CCL3 (Fig. 7B). Furthermore, GSVA analysis showed that TNF-α signaling, inflammatory response, and TGF-β signaling pathway were enriched in the subsets 1 and 2. In addition to BIRC3, the characteristic genes that promote tumor proliferation and progression, including RPL31 and EREG, were all expressed in subsets 1 and 2 (Fig. 7C, F). The above results demonstrated that subsets 1 and 2 might be the transition stage from M1 to M2, which was consistent with the results reported by Azizi et al. who found that some TAM cell groups in breast cancer highly expressed both the M1 (such as CCL3) and M2 (such as MARCO and NRP2) characteristic genes. This implied that TAM differentiation in TME was also a continuous and progressive process, rather than two discrete states as traditionally believed [38]. Moreover, GSVA showed that E2F, MYC, G2M, TNF-α-signaling, and Hedgehog signaling pathways were enriched in subsets 4 and 5. The above results suggested that subsets 4 and 5 had the characteristics of M2. However, the proportion of cells in subsets 0 and 3 in the primary lesion was significantly higher than that in lymphatic metastases, suggesting their possible tumor suppressor function. The characteristic genes SELENOP and C1QA of these two subgroups are closely related to immunity and energy metabolism [41, 42]. In our study, the GSVA results indicated that protein secretion, oxidative phosphorylation, bile acid metabolism, and other metabolism-related pathways were mainly enriched in subsets 0 and 3 (Fig. 7C, F), indicating that these cells may interfere with TME by regulating immunity and metabolism. In addition, monocyte DEGs between primary lesions and lymphatic metastases were further investigated. BIRC3, CCR7, and especially ACTG1 in the lymphatic metastases promote the proliferation and metastasis of PCa [43]. Functional enrichment pathway analysis of DEGs showed that they were mainly concentrated in immune response activation, leukocyte migration, positive regulation of cell activation, and other immune-related pathways (Fig. 7D, E; Supplementary Material 16). Cell trajectory analysis showed that most of the monocyte cells in the metastatic lesions were located in the middle of the whole cell differentiation and differentiated toward the first and second branches below the main line (Supplementary Fig. 5).
Fig. 7
Heterogeneity analysis of myeloid cells in primary and lymphatic metastatic TME of PCa. (A). Monocyte distribution subcluster between metastatic and primary lesions using UMAP-2 analysis; (B). Mean percentage of monocyte subclusters in primary and metastatic lesions; (C). Violin plots showing normalized expression levels of marker genes across monocyte subclusters; (D). Metastasis DEGs identified using edgeR package with comparison to primary lesion. Scatter plots showing respective DEG profiles in PCa. Red spots indicate up-regulated genes; green spots indicate no significant change in genes; (E). Functional enrichment analysis for monocyte DEGs; (F). GSEA heatmap of 50 hallmark gene sets in MSigDB database among monocyte subclusters
Furthermore, the study results demonstrated that the number and proportion of NK cells and neutrophils, like CD8 + T cells, were much smaller in LNM than in primary PCa lesions. Functional enrichment analysis of DEGs showed that they were mainly enriched in immune, metabolic, and tumor proliferation-related pathways (Supplementary Fig. 6, Supplementary Material 17–18). Treg cells can accumulate in tertiary lymphoid organs and can inhibit antitumor immunity. Our results showed that the number and proportion of Treg and Th cells in lymphatic metastases of PCa were significantly higher than those in the primary lesions (Supplementary Fig. 7, Supplementary Material 19–20). Cell clusters expressing immunoglobulin and B cell-specific TFs were the most numerous in breast cancer microenvironment. B cells were divided into two categories: one with center cell/glial cell-expressing characteristics and the other with naive B lymphocyte expression characteristics [44], which shows B cell heterogeneity in the tumor tissue. Similar to the outcomes reported in the literature, our results showed that the number and proportion of B cells in LNM of PCa were significantly higher than those in primary lesions (Supplementary Fig. 8, Supplementary Material 21), which implies that B cells also contribute to PCa metastasis.
Heterogeneity analysis of fibroblastsIn addition to immune cells, the TME also contains cancer-associated fibroblasts (CAFs), vascular endothelial cells, extracellular matrix, and other non-immune cell components, which also affect the functional status of tumor immune microenvironment. Tirosh et al. combined scRNA-seq data with data from the TGCA database and found a series of CAF-expressed genes strongly correlated with T cell infiltration, including chemokine ligand 2 (C-X-C motif chemokine ligand 2 (CXCL2), C-C motif chemokine ligand 19 (CCL19), and other chemokines. Immune regulatory genes, such as PD-L2, and complement factor 3 were strongly correlated with the infiltration of CD8 + T cells. CAFs may be involved in the regulation of T cell tumor infiltration [18]. A total of 2,456 fibroblast cells (2,066 in primary lesions and 390 in metastatic lesions) were identified in our study (Tables 2 and 3). UMAP analysis of fibroblasts revealed a total of five subsets (Fig. 8A, Supplementary Material 22). The percentages of cells in subsets 3 and 4 were significantly higher in lymphatic metastatic lesions than in primary lesions, indicating that subset 3 and 4 cells were associated with tumor progression and metastasis (Fig. 8B). Further study of the characteristic genes expressed in these two subsets revealed genes co-expressed in other subgroups, such as DCN, ATF3, and FLNA (Fig. 8C). More importantly, STEAP4 and ADGRF5 specifically expressed in subgroup 3 and 4 showed a significant overexpression of CXCR4 and SRGN (Fig. 8C), which were closely related to tumor metastasis or immunosuppression in TME. Our multicolor immunofluorescence staining on paraffin sections of 13 cases of PCa combined with lymphatic metastasis indicated that CXCR4 was positive in the primary tumor tissue and lymphatic metastases, and the positive rate was higher in the metastatic lesions than in the primary lesions, which was consistent with the results of single cell sequencing. It suggested that there were CXCR4 + bibroblasts in PCa TME (Figure.
留言 (0)