Cell Culture
The H1299 cell line was purchased from Zhejiang Meisen Cell Technology Co., Ltd. The cells were cultured in an incubator containing 5% CO2 at 37 °C. When the cell density exceeded 90%, the culture medium was absorbed and discarded. Next, 1 ml trypsin solution was added, and the cells were incubated in the incubator for 3 min until they fell off and separated from the culture bottle wall. Then complete 1640 medium was added to neutralize the trypsin solution. After centrifugation, the cells were re-suspended, and an appropriate amount of re-suspension was placed in a new culture bottle with fresh cell complete medium addition.
Collection of Cell Supernatant
When the cell density reached more than 90%, the cells were washed twice with PBS, and then the serum-free 1640 medium was added. After 24 hours of cultivation, the cell supernatant was collected into a 50 ml centrifuge tube.
Extraction of Exosomes from Cell Supernatant
Cell culture supernatant was centrifuged at 2000 g for 30 min to remove cells and debris. After centrifugation, the supernatant was transferred to a new tube, and an appropriate amount of exosome separation reagent was added, shaken, and mixed. The mixed solution was incubated overnight at 2 °C to 8 °C, centrifuged at 4 °C at 10,000 g for 1 hour, and the supernatant was discarded. An appropriate amount of PBS was added to suspend exosomes from the bottom of the centrifuge tube. The extracted exosomes were stored at − 20 degrees.
NTA Particle Size Detection
The exosomes were diluted to 10^7 / ml-10 ^9 /ml with PBS, and the size and quality of the exosomes were measured by NanoSight NS300 particle potentiometric titration and particle size analyzer.
Morphology of Exosomes Detected by Transmission Electron Microscope
Ten μl exosomes were dropped on the copper mesh, incubated at room temperature for 10 min, cleaned with sterile distilled water, and absorbent paper was used to absorb excess liquid. Ten μl 2% uranium diacetate was dropped onto the copper mesh and the sample was negatively stained for 1 min. The float was absorbed with filter paper and dried the sample for 2 min under an incandescent lamp. The copper mesh was observed and imaged under the transmission electron microscope.
Detection of Exosome Protein Markers by Western Blot
CD9, CD63, HSP90, and Alix were used as exosome-positive protein markers, and Calnexin as an exosome-negative protein marker. The separation and concentrated gel were prepared according to the instructions, and 10ul exosomes were added. The gel is put into the prepared electrophoretic solution and 150 V voltage was applied for electrophoresis. PVDF membrane was used for transmembrane. The film transfer device was installed, and the film was transferred on the ice with a constant current of 280 mA and a time of 90 min. After sealing the PVDF membrane for 1 h at room temperature, the primary antibody was added, and the membrane was kept in the refrigerator at 4 °C overnight. After 3 times cleaning in TBST solution, the membrane was incubated with the secondary antibody at room temperature for 1 h. At last, ECL luminous solution was added, and color rendering exposure was carried out by the Chemiluminescence Western Blotting Detection system.
Detection of the Concentration of Exosomes by BCA Assay
Standard protein and BCA working solution were prepared according to the instructions of BCA kit. Twenty μl standard protein solution was added to 96-well plate with the concentration of 0, 0.025, 0.05, 0.1, 0.2, 0.3, 0.4 and 0.5 mg/ml. Twenty μl exosomes were added into the sample well of the 96-well plate. Two hundred μl BCA working solution was added to each hole and placed at 37 °C for 30 minutes. The absorbance of each hole in the 96-well plate was measured by enzyme-labeled instrument at 562 nm wavelength. The corresponding protein concentration of exosomes was calculated according to the standard curve and the measured absorbance.
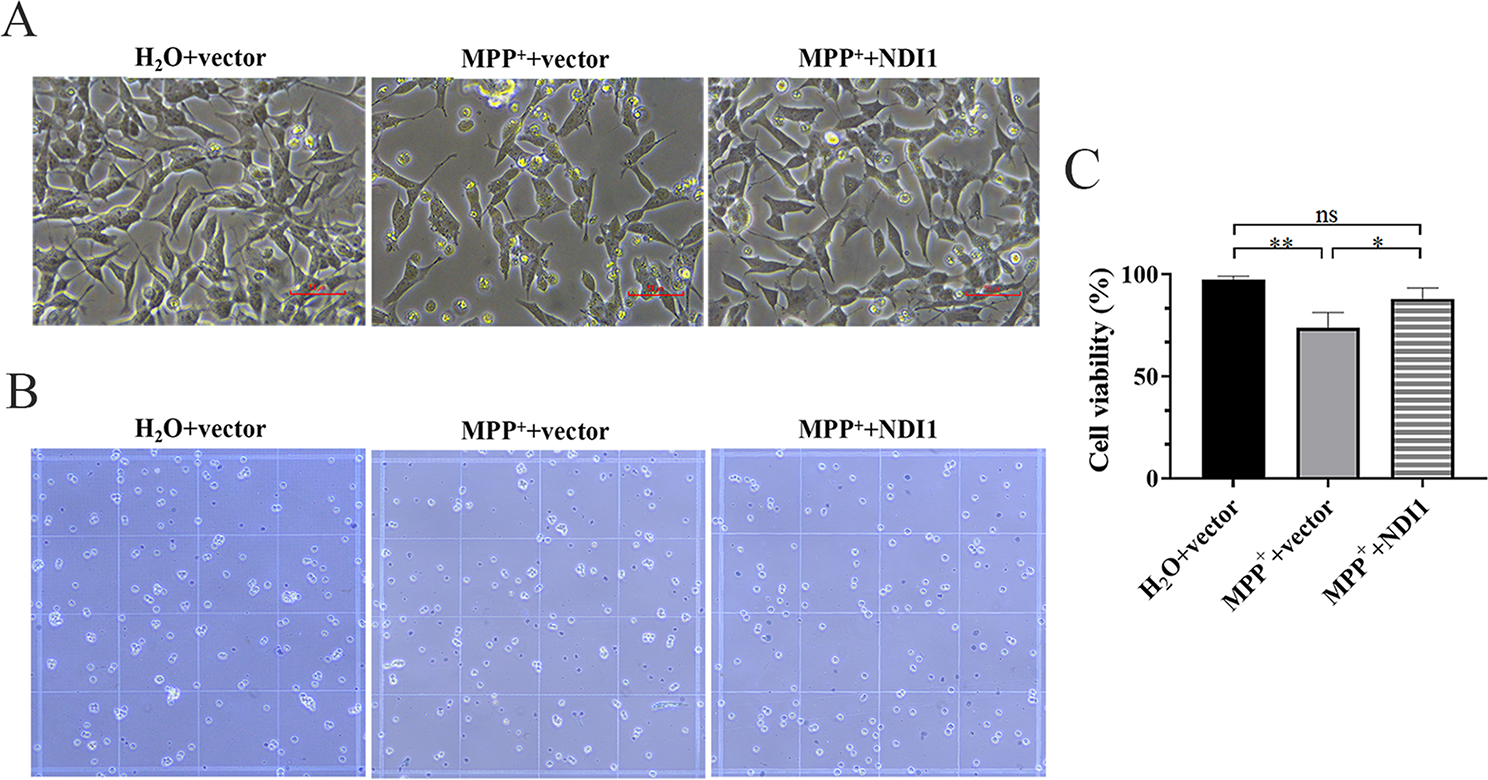
CCK8 Cell Viability Test
The cells were seeded in 96-well plates and incubated until the cell density reached 60%. The medium was replaced by serum-free 1640 medium as well as prepared exosome solution (80 μg/ml, 60 μg/ml, 40 μg/ml, 20 μg/ml). The 96-well plates were placed in an incubator for 24 hours and removed. The medium was discarded and cells were cleaned twice with PBS. CCK8 solution was added according to the instructions and cells were incubated for 1 h. The absorbance of each hole was measured with an enzyme label instrument at 450 nm wavelength, and the cell viability was calculated according to the absorbance.
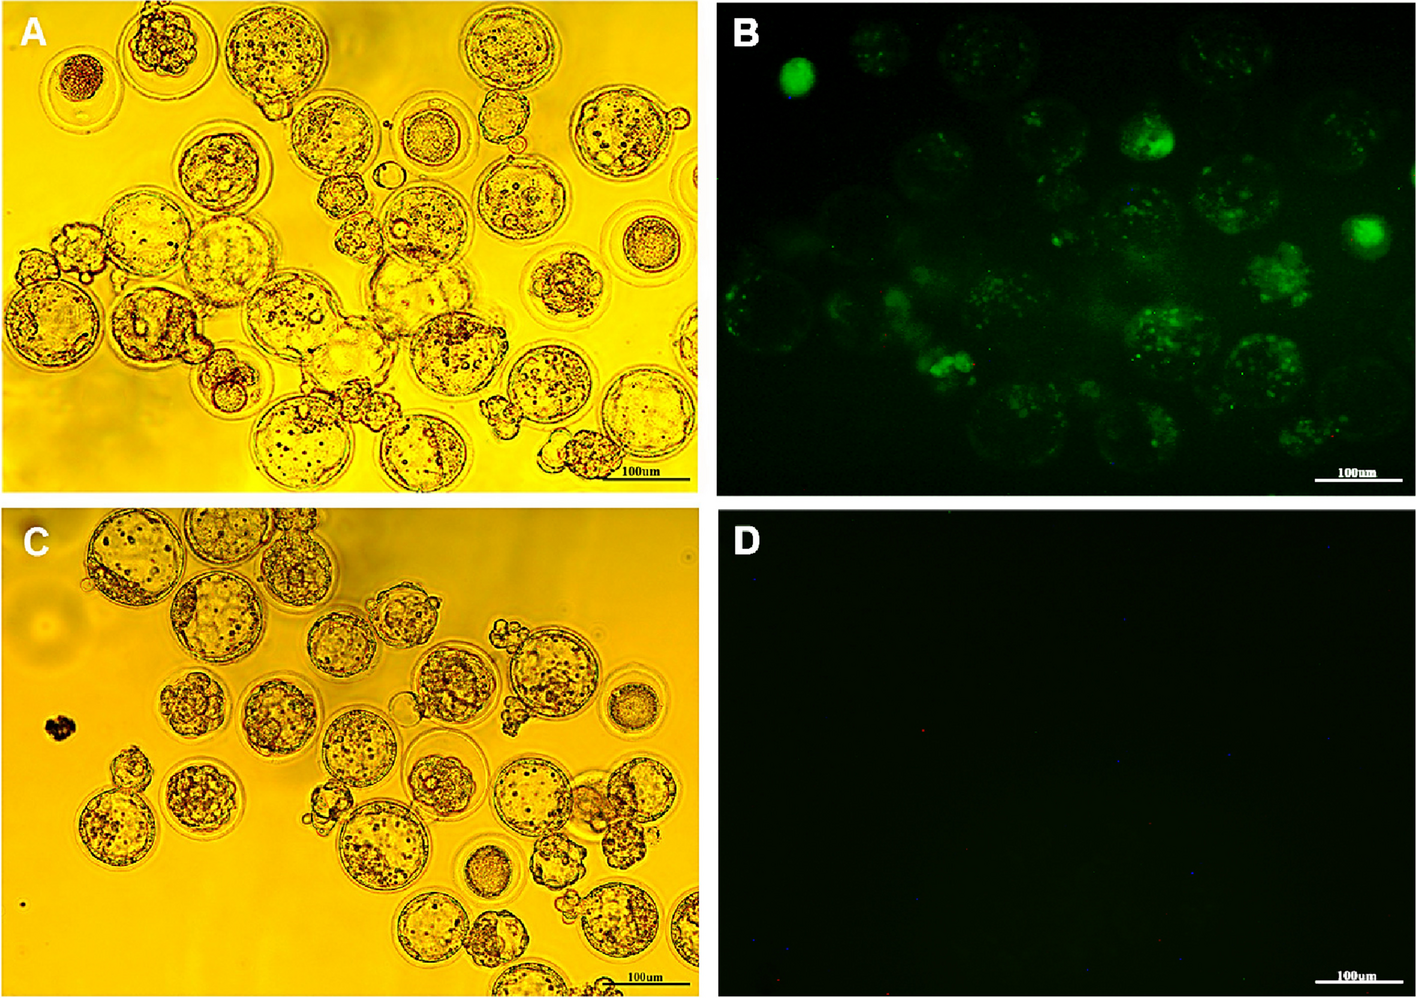
Edu/Hoechst 33342 Observation of Cell Apoptosis
The cells of each group were inoculated on 96-well plates. The control group was given serum-free medium, and the experimental group was assigned serum-free medium with H1299 cell-derived exosomes. After incubation for 24 h, the Edu working solution was prepared according to the instructions. After incubating Edu working solution with each group of cells for 2 hours, 4% paraformaldehyde was added for cell fixation at room temperature for 15 minutes. After 3 times washing, the permeable solution was added and incubated for 10 min. Then, the prepared Click reaction solution was added and incubated for 30 min at room temperature under light protection condition. Finally, nuclear staining was performed with Hoechst 33342 and cells were observed under the fluorescence microscope.
Detection of Apoptosis by Flow Cytometry
The cells were digested with EDTA-free trypsin, centrifuged at 1000 g for 5 min, then re-suspended with 1 ml PBS and counted. 50,000–100,000 cells taken were centrifuged in 1.5 ml EP tubes, and the supernatant was abandoned. Annexin-V-FITC solution was added to re-suspend the cells. Propidium iodide stain was added into each EP tube and the tubes were incubated at room temperature away from light for 20 minutes for detection.
Detection of Cytokines Secreted by Astrocytes
This experiment was completed in cooperation with Shanghai H Wayne Company Ltd. Bio-Plex Pro Human Cytokine Screening 48-plex Panel chip was used for detection. First, the collected cell supernatant of each group was centrifuged, and the standard sample was prepared according to the instructions. After Assay Buffer was used to dilute and shake microbeads, 50 μl was taken and added to a 96-well plate, followed by 50 μl standard, sample, and Blank, and the samples were incubated at room temperature for 30 min without light. After washing, Detection Antibody was added and incubated for 30 min. Then Streptavidin-PE was added and incubated. After washing, the Assay Buffer was added for shaking and mixing. At last, the Bio-Plex detector was used to detect the concentration of each sample.
Label-Free Quantitative Proteomics Analysis
This experiment was completed in cooperation with the Shanghai biotechnology corporation. After protein extraction, SDS-PAGE electrophoresis, Coomassie brilliant blue staining, and FASP enzymatic hydrolysis were performed. After chromatographic separation by the Easy nLC system, the samples were analyzed with Orbitrap Exploris 480 mass spectrometer. MaxQuant software (version No. 1.6.14.0) was applied to search the protein database, and LFQ (LabelFreeQuantity) algorithm was used to conduct the protein quantitative analysis. Blast2GO was used to annotate the function of target proteins. KOALA (KEGG Organization and Links Annotation) software was used to annotate the KEGG pathway of the target proteins. During enrichment analysis of GO annotation or KEGG pathway annotation on target proteins, Fisher’s Exact Test was used to compare the distribution of GO classifications or KEGG pathway in target and total proteins to evaluate the significance level of protein enrichment of a certain GO term or KEGG pathway. The software WoLF PSORT was used to predict the location of different proteins.
Statistical Analysis
The data of flow cytometry were analyzed by Flowjo, and the data of CCK8 were processed by Graphpad Prism 9. The data of different groups were analyzed by unpaired t-test. P < 0.05 was considered a statistical difference.


留言 (0)