
記住我


The blood for isolation of human monocytes from healthy donors was kindly provided by the Department of Transfusion Medicine, University Hospital Muenster. The monocytes were isolated via a double-density gradient centrifugation protocol as described previously [15]. As starting material, blood from either buffy coats or leukoreduction system chambers can be used. Briefly, 10 ml of donor blood were diluted with 20 ml PBS containing 1 mM EDTA. The suspension was layered carefully on top of 15 ml of a Ficoll gradient (Pancoll, PANbiotech) and was centrifuged at 400 × g for 45 min (without brake). The interphase between the plasma and Ficoll layer was collected with a plastic Pasteur pipet and washed twice with PBS containing 1 mM EDTA at 400 × g for 10 min (without brake). The PBMC pellet was resuspended in 20 ml RPMI-1640 medium without phenol red and carefully layered on top of 25 ml of a 46%-iso-osmotic Percoll gradient (Fisher Scientific). The iso-osmotic gradient contains 92% of Percoll solution in 10 × PBS (w/o Ca2+ and Mg2+) and 8% of RPMI-1640 + 10% heat-inactivated (56 °C, 30 min) fetal calf serum (FCS). The sample was centrifuged at 550 × g for 30 min (without brake). Again, the interphase was collected with a plastic Pasteur pipet and washed once in 50 ml PBS containing 1 mM EDTA by centrifugation at 400 × g for 10 min (without brake). The monocyte pellet was resuspended in 10 ml RPMI-1640 containing 10% FCS.
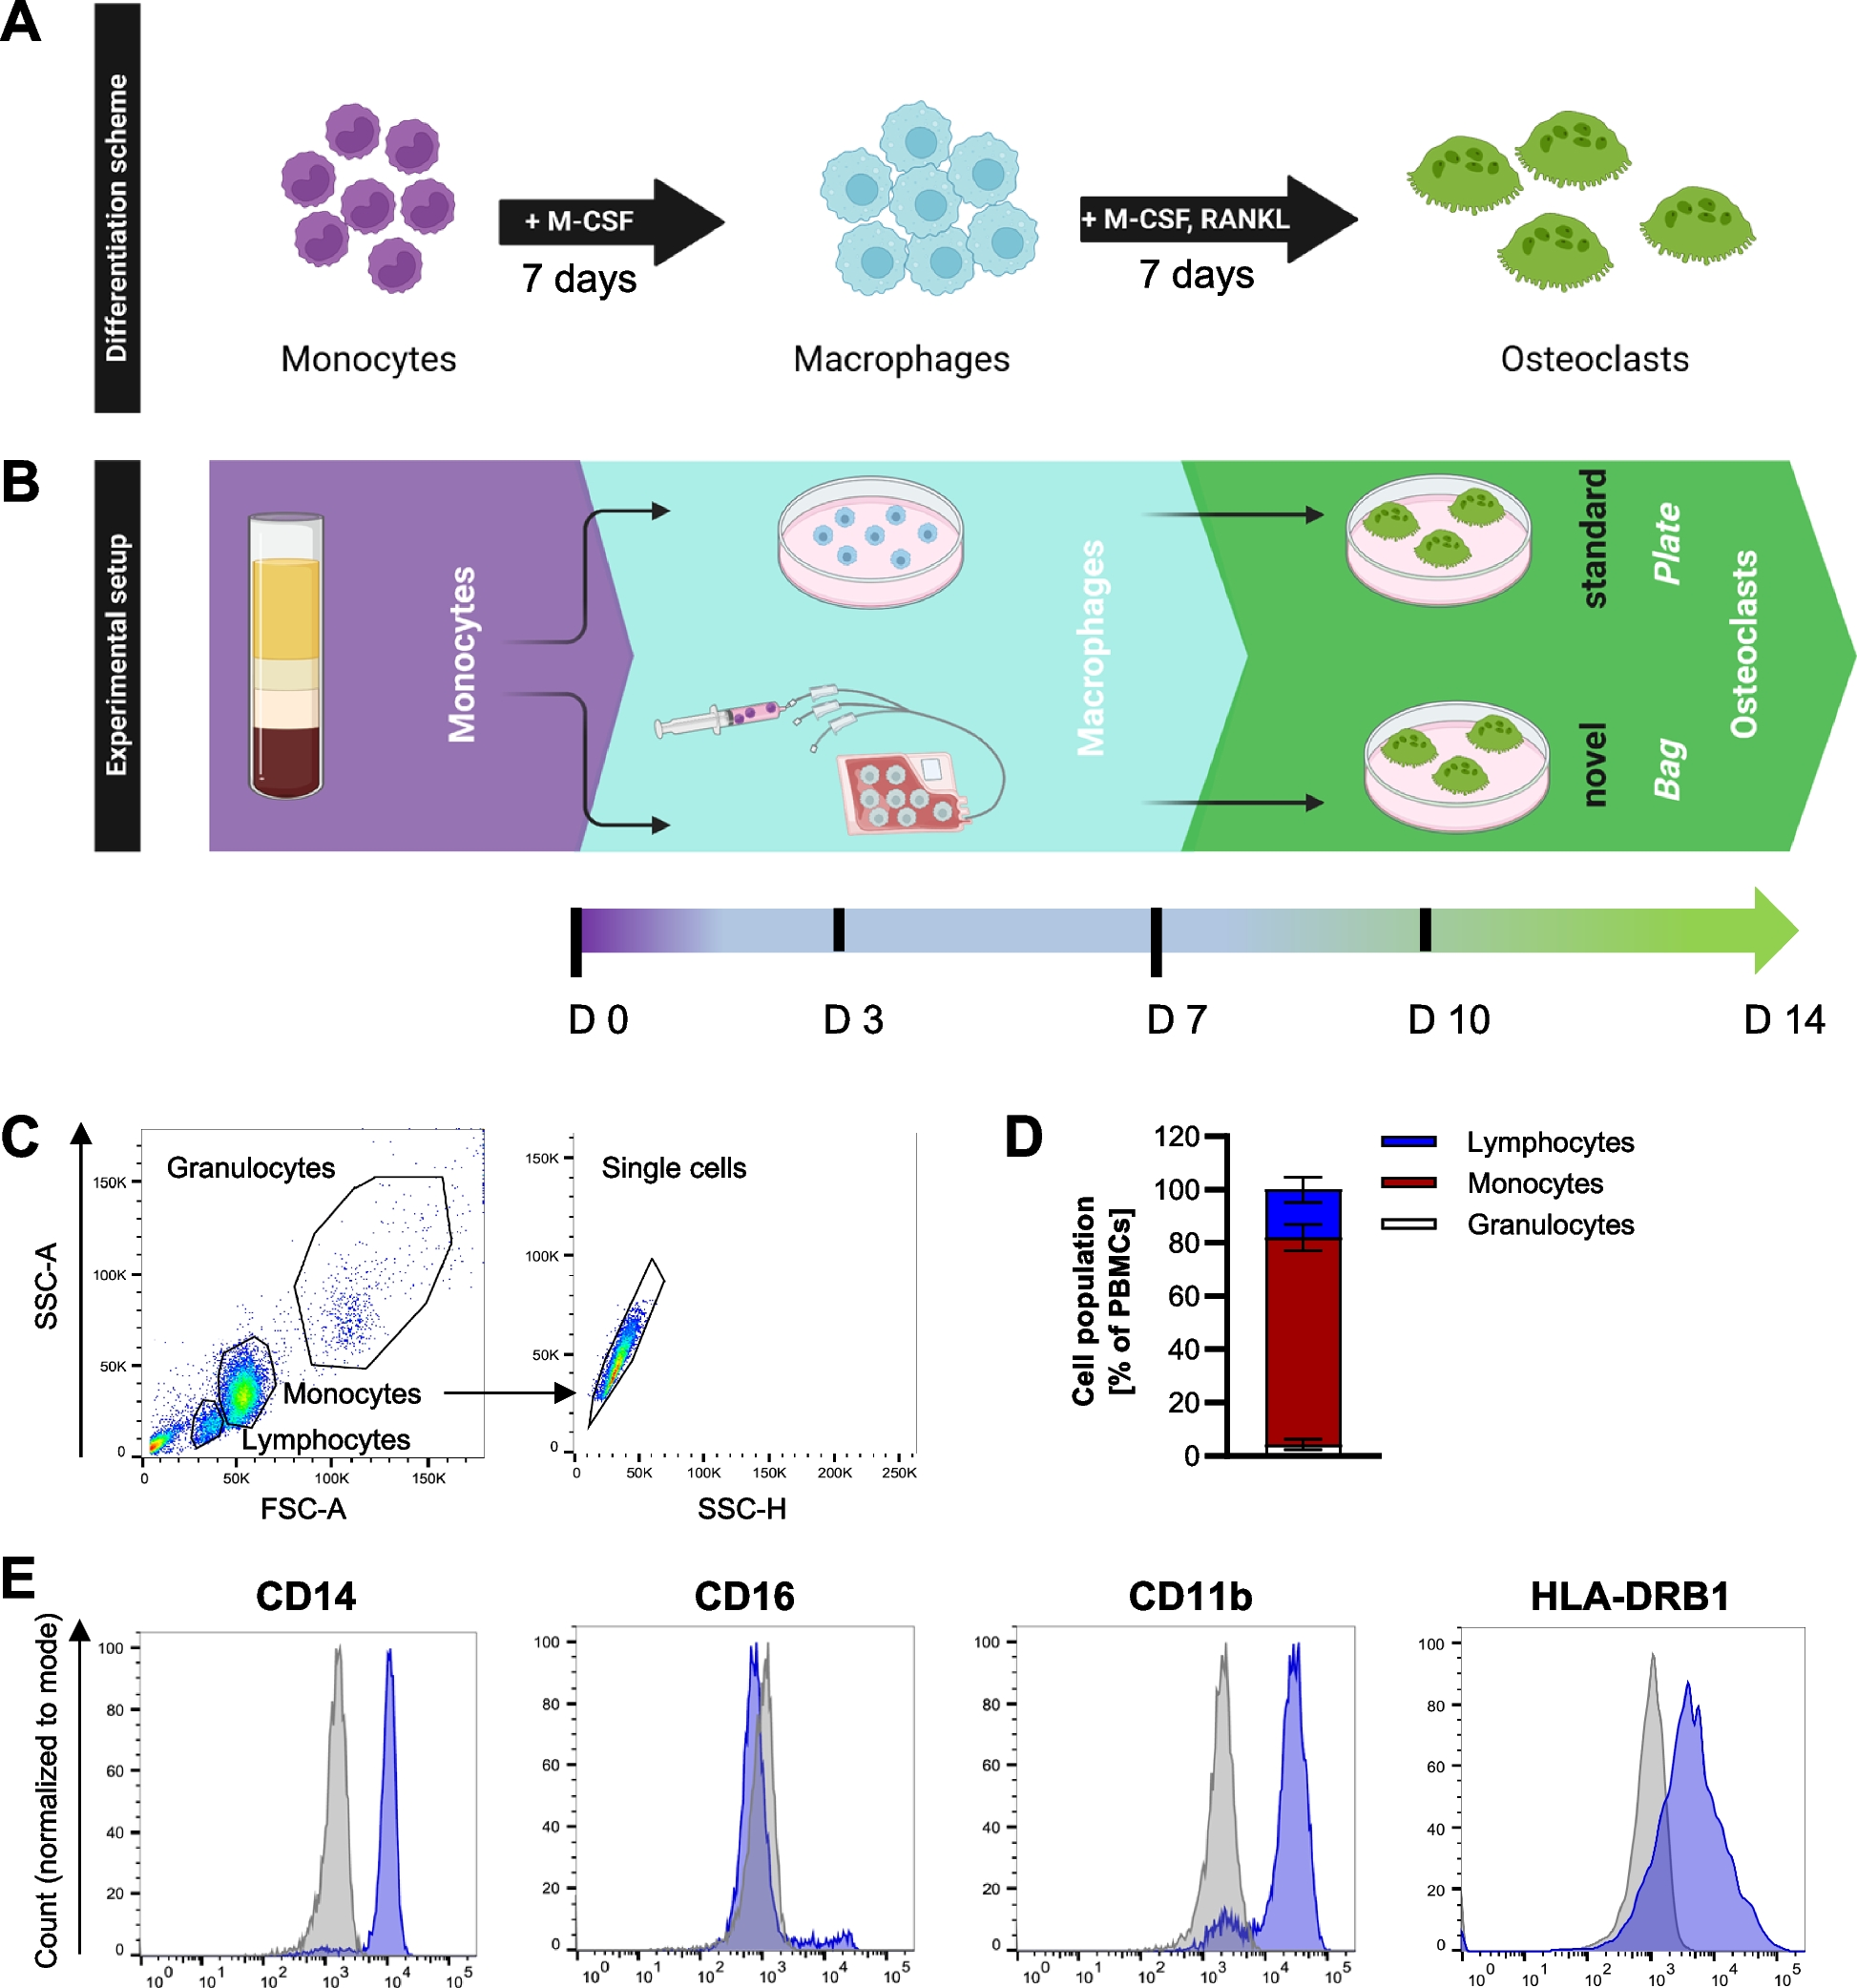
The isolated monocytes were first differentiated to macrophages. To this end, monocytes were either differentiated in 32 ml VueLife cell culture bags coated with a thin fluorinated ethylene propylene (FEP) Teflon film (5 Mil (0.005’’ thick)) (CellGenix) or in regular cell culture dishes with a polystyrol plastic surface for adherent cells (Sarstedt). The Teflon bags have an inside surface area of 87 cm2 and allow regular gas exchange, but otherwise constitute a closed system environment. For differentiation of monocytes in Teflon bags, 2.5 × 10⁷ cells were seeded in 15 ml RPMI-1640 + 10% FCS, 2% human AB serum and M-CSF, while cells differentiated in cell culture plates were cultivated in RPMI-1640 + 10% FCS supplemented with M-CSF. Cells were differentiated to macrophages for 7 days at 37 °C and 5% CO2. During this differentiation period, the cells cultivated in Teflon bags remain in suspension, which facilitates the harvesting process which is described in detail in [15]. After harvesting the macrophages from the bags, they were seeded in cell culture dishes for further differentiation to osteoclasts, or remained in their initially seeded culture dishes. For osteoclast differentiation, cells were cultured in RPMI-1640 + 10% FCS supplemented with both M-CSF and RANKL for another 7 days, with change of culture medium every three days. The differentiation scheme is summarized in Fig. 1.
Fig. 1
Differentiation of primary human osteoclasts. A Differentiation scheme of monocytes to osteoclasts. B Monocytes were isolated from peripheral blood and differentiated for 7 days to macrophages in the presence of M-CSF either in polystyrene cell culture plates (standard method) with a medium change every 3 days or in Teflon bags (novel method) with no medium change required. For terminal osteoclast differentiation, cells were either harvested from the bags and seeded at the desired cell density in cell culture plates, or kept adherent in plates. In both approaches, cells were cultured for an additional 7 days in a medium containing both M-CSF and RANKL which was changed every 3 days. C + D, Flow cytometry profile and gating strategy (C) including corresponding quantification (D) of the monocyte preparations. E Expression of surface marker proteins CD14, CD16, CD11b, CD163 and HLA-DRB1 was assessed on monocytes from n > 3 donors. Shown is one representative histogram for each marker. Blue: antibody-of-interest, grey: isotype control
Flow cytometryTo detach the macrophages/osteoclasts from the cell culture dishes, the plates were incubated on ice for 20 min and then washed once with PBS. For detachment, 250 µl Accutase solution (Capricorn) were added to the cells and incubated for 5 min at 37 °C. The cells were then collected in PBS by stringent up and down pipetting followed by a washing step in PBS at 500 × g for 5 min at RT. Up to 1.0 × 10⁵ cells were incubated in 20 µl PBS containing 1% FCS for 20 min at RT to block non-specific binding sites. Cells were stained with fluorescently-labeled antibodies directed against CD14 (#301803, 400 ng/sample), CD45 (#304011, 400 ng/sample), CD16 (#302005, 400 ng/sample), CD11b (#301305, 400 ng/sample), CD163 (#333605, 400 ng/sample), HLA-DRB1 (#362303, 400 ng/sample), CD206 (#321106, 400 ng/sample) CD86 (#305417, 400 ng/sample), CD80 (#305219, 200 ng/sample), CD51 (#327907, 400 ng/sample, all from Biolegend), or the respective isotype controls at the same concentration (#400207, #400121, #400110, #400331, #400113 from Biolegend) for 20 min at RT. Fluorescence was recorded at the FACSymphony A1 flow cytometer (BD) and data was analyzed with FlowJo (v10.7, BD).
ImmunofluorescenceOsteoclasts, which were seeded on glass coverslips, were washed twice with PBS and fixed in 4% Paraformaldehyde (PFA) for 15 min at RT. Cells were incubated in PBS containing 0.3% BSA and 0.05% Saponin for 30 min to block non-specific binding sites and permeabilize the cells. To visualize the actin cytoskeleton, cells were stained with FITC-conjugated Phalloidin (1:1000, #P5282, Sigma) for 2 h at RT. Samples were mounted in mounting medium with DAPI (#ab104139, Abcam) and osteoclasts visualized on a BZ-X800 fluorescence microscope (Keyence) at 10 × magnification. High resolution images were obtained using confocal microscopy at the LSM 800 Airy Scan confocal microscope (Zeiss). Quantification of the multinuclear cells was performed with ImageJ (v1.5.3).
TRAP stainingThe staining for tartrate-resistant acid phosphatase (TRAP) in osteoclasts was performed with the Leukocyte Acid Phosphatase kit (Sigma-Aldrich) according to the manufacturer's protocol. Signals were visualized on an IX83 microscope (Olympus) with a 10 × objective.
Bone resorptionTo measure the capacity of osteoclasts to dissolve bone mineral, cells were either directly seeded and differentiated in 24-well plates coated with a proprietary synthetic inorganic bone mimetic matrix (Corning) or differentiated to macrophages for 7 days prior to seeding and terminal differentiation on the matrix. The wells had been equilibrated with growth medium prior to cell seeding. After a total differentiation period of 14 days, the wells were washed once with PBS and treated with 5% sodium hypochlorite for 5 min at RT. After a second washing step in PBS, the wells were dried and imaged via brightfield imaging (AE31E, Motic). To measure the capacity of osteoclasts to degrade organic bone matrix, cells were seeded and differentiated as described above on bovine cortical bone slices (FisherScientific) which had been washed twice in PBS and equilibrated in culture medium for at least 1 h prior to cell seeding. At day 14, medium was changed and cells incubated for another 72 h. The supernatant was collected and used for the determination of type I collagen degradation products using the CrossLaps for Culture ELISA (ids) according to the manufacturer’s instructions. The bone slices were either used for electron microscopy or toluidine blue staining to visualize the resorption pits. To this end, cells were disrupted by treatment with 1% Triton X-100 in H2O for 15 min and slices washed once in dH2O prior to staining for 4 min in 1% toluidine blue + 1% sodium borate 10-hydrate in H2O. Slices were washed extensively in H2O and imaged at the BZ-X800 microscope (Keyence). The pit area was quantified using ImageJ (v1.5.3).
Electron microscopyBone slices were fixed in 2% (v/v) formaldehyde and 2.5% (v/v) glutaraldehyde in 100 mM cacodylate buffer, pH 7.4, at 4 °C overnight. After washing in PBS, samples were post-fixed in 0.5% (v/v) osmium tetroxide and 1% (w/v) potassium hexacyanoferrate (III) in 0.1 M cacodylate buffer for 2 h at 4 °C followed by washing with dH2O. After dehydration in an ascending ethanol series from 30 to 100% ethanol, specimens were two times incubated in propylene oxide each for 15 min and embedded in Epon using flat embedding molds. Ultrathin sections were cut with an ultramicrotome, collected on copper grids and negatively stained with 2% uranyl acetate for 10 min. Electron micrographs were taken at 60 kV with a Veleta camera system in combination with the Radius software system (emsis, Muenster, Germany).
Cell viability assayCell viability of osteoclasts was analyzed with the Annexin V-FITC Apoptosis Detection Kit with 7-AAD (#640922, Biolegend) according to the manufacturer’s instructions. Fluorescence was recorded on a FACSymphony A1 flow cytometer (BD) and data was analyzed with FlowJo (v10.7, BD).
Western blottingOsteoclasts and their precursors were lysed in RIPA buffer (50 mM Tris, 150 mM NaCl, 0.1% SDS, 0.5% sodium deoxycholate, 1% Triton X-100, pH 7.2) supplemented with both protease (Sigma) and phosphatase (Roche) inhibitors. To determine the protein concentration, a Lowry assay (Bio-Rad) was performed. 20 µg of cell lysate were separated by SDS-PAGE (10% gel) and transferred onto a nitrocellulose membrane. To block non-specific binding sites, membranes were incubated in TBST (137 mM NaCl, 20 mM Tris pH 7.6, 0.1% (v/v) Tween-20) + 3% bovine serum albumin (BSA) for 1 h at RT. Subsequently, membranes were incubated with primary antibodies against CD51 (#sc-376156, 1:500), CD61 (#sc-365679, 1:500), MMP9 (#sc-393859, 1:500), RANK (#sc-374360, 1:1000), Cathepsin K (#sc-48353, 1:1000, all from Santa Cruz) and Tubulin (#11224–1-AP, 1:1000, Proteintech) overnight at 4 °C followed by incubation with the corresponding HRP-coupled secondary antibody (#7074 or #7076, 1:10,000, cell signaling) for 1 h at RT. The chemiluminescent signals were detected with ECL West Pico on a ChemoStar imager (Intas).
RNA isolation and quantitative real-time PCR (qPCR)Total RNA was isolated from the cells using the High Pure RNA isolation kit (Roche) according to the manufacturer’s instructions. 1 µg of RNA was reversely transcribed to cDNA with the iScript cDNA synthesis kit (Bio-Rad). Gene expression was measured by standard SYBR green detection on a QIAquant® 384 (Qiagen) using 10 ng of cDNA per sample. Primer sequences (5'-3') are as follows: CTSK (forward: TGTACCCTGAGGAGATACTG, reverse: CCAAATTAAACGCCGAGAG), TNFRSF11A (forward: GTACCAGTGAGAAGCATTATGAG, reverse: GAGGTAGTAGTGCATTTAGAAGAC), MMP9 (forward: ACCTGAGAACCAATCTCAC, reverse: GTAACCATAGCGGTACAGG), ITGAV (fw: CATTCTACTTGACTGTGGTG, rv: TTCTCCTTGATTCTGAGCC), ACP5 (forward: TGCAAGACATCAATGACAAGAG, reverse: CGGTCAGAGAATACGTCCT), DCSTAMP (fw: CAAAGATTCATTTCTGGCTTCC, rv: AATAGTGACTGCCATCCTAGAC), NFATC1 (fw: TCCTCTCCAACACCAAAGTC, rv: AAGTTCAATGTCGGAGTTTCTG), CA2 (fw: GATCAAGCAACTTCCCTGAG, rv: ACTGAATCAATCTGTAAGTGCC), ATP6V0A1 (fw: CGGGACATGATTGACTTAGAG, rv: CCTGGTTTGTGTTGATTTCCT), MMP14 (fw: GAAGGATGGCAAATTCGTC, rv: GAGCAGCATCAATCTTGTC), MMP9 (fw: ACCTGAGAACCAATCTCAC, rv: GTAACCATAGCGGTACAGG), GNB2L1 (forward: AACCCTATCATCGTCTCCT, reverse: CAATGTGGTTGGTCTTCAG), HPRT1 (forward: TATGCTGAGGATTTGGAAAGG, reverse: CATCTCCTTCATCACATCTCG). Gene expression was normalized on the two housekeeping genes HPRT1 and GNB2L1.
RNA-Sequencing (RNA-Seq) analysisSequencing was performed at the Core Facility Genomics of the Medical Faculty Muenster. Quality and integrity of total RNA was controlled on Agilent Technologies 2100 Bioanalyzer (Agilent Technologies). Poly(A) mRNA were purified from 300 ng total RNA using Poly(A) mRNA Magnetic Isolation module Kit (NEB E7490L, New England Biolabs). The RNA-Seq library was prepared with NEBNext Ultra™ II Directional RNA Library Prep Kit for Illumina (New England Biolabs). The libraries were sequenced on Illumina NextSeq 2000 using NextSeq2000 P3 Reagent Kit with single-end reads with a length of 72 base pairs (bp) and an average of 27.9 M reads per RNA sample. Pre-processing of the raw reads involved adapter trimming using TrimGalore (v0.6.6) in conjunction with Cutadapt (v4.4). The specific adapter sequence targeted for removal during trimming was AGATCGGAAGAGCACACGTCTGAACTCCAGTCAC. Subsequently, reads shorter than 30 bp were filtered out. The trimmed reads were mapped to the CHM13 reference human genome (v2.0) and the alignment was performed using STAR (v2.7.3a). Gene-level counts were generated using featureCounts from subread (v2.0.2), incorporating strand-specific information (reverse strandedness). The resulting raw reads count table indicated an average alignment rate of 74.6%. Differential expression analysis was carried out using the ALDEx2 pipeline [16]. This analytical approach ensures robust exploration of differential expression patterns and provides a comprehensive understanding of the compositional nature of the RNA-Seq data in the context of this study.
Statistical analysisAll experiments were performed with at least three biological replicates. Statistical significance was calculated with GraphPad Prism (v9.2.0) using an unpaired t-test for comparison of two groups or a one-way ANOVA with Fisher’s LSD test for comparison of multiple groups, unless stated otherwise. P-values < 0.05 were considered as significant (****p < 0.0001, ***p < 0.001, **p < 0.01, *p < 0.05, ns = not significant). All figures in the current study were generated with GraphPad Prism (v9.2.0) or OMERO (v5.14.1) in case of the immunofluorescence images.
留言 (0)