
記住我


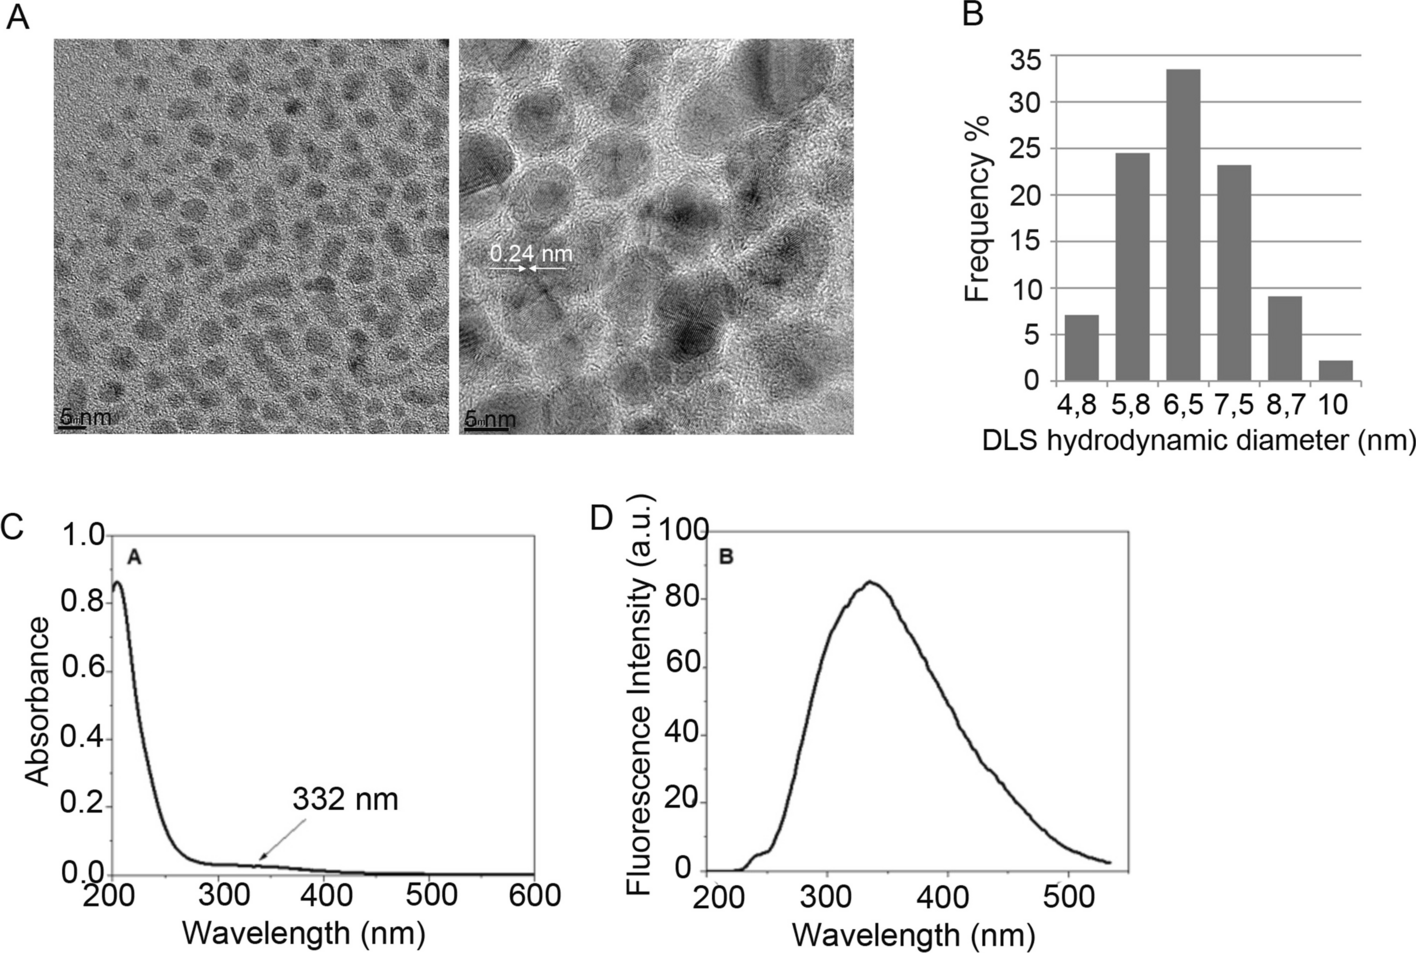


Carbon-based nanoparticles (CDs) were generated hydrothermally as described in "Preparation of carbon dots" section. CDs show a spherical and very uniform morphology, with an average size of less than 5 nm (Fig. 1A) and a hydrodynamic diameter below 10 nm (Fig. 1B). This synthetic method allows the nanoparticles to have the typical graphitic structure, as shown in Fig. 1A. Layers of sp2-hybridized hexagonal carbon rings make up graphite. The HR-TEM images show a distinct 0.24 nm lattice fringe, revealing that the CDs produced from citric acid likewise have a graphite origin [11, 29].
Fig. 1
A HR-TEM images of the CDs generated after the reaction of citric acid at 200 °C at two magnifications (scale bar 5 nm). B Histogram frequency of DLS measurements of the mean hydrodynamic diameter (nm) found in CD suspensions. C UV/vis and D fluorescence spectra of the CDs generated from citric acid
The optical properties of the CDs were further examined. The UV/vis spectrum of CDs shows a small band at 332 nm (Fig. 1C) that can be attributed mainly to the n-p* electronic transition of the surface carbonyl groups (C = O) [30]. Photoluminescence (PL) spectra are one of the most crucial properties of CDs in biomedical applications, although some applications, such as cell tracking, require fluorescence emission by CDs. Many cell biology applications of gene delivery use fluorescent reporter genes or engineered fluorescent fusion proteins to further follow the effects of exogenous gene constructors on cell function, and thus, CD PL spectra should not interfere with the detection of widely used fluorescent reporter genes, such as GFP, YFP or RFP.
In this study, we used a retroviral bicistronic vector encoding GFP and the oocyte-enriched factor Sox15 for cell reprogramming after overexpression on target cells [27]. Detection of the GFP reporter gene is used for tracking cells expressing the reprogramming factor Sox15 and thus the reprogramming process over time. The fluorescence emission spectra of CDs showed a PL band at 340 nm (Fig. 1D), a typical behavior when CDs are obtained from citric acid at 200 ºC [30], thus confirming that it does not interfere with the detection of the GFP emission peak at ~ 510 nm [28].
Biofunctional approach for cation carbon dot (CCD) generationEffect of CDs on cell viabilityTo generate CCDs by electrostatic binding of PEI, we incubated different amounts of CDs with PEI with agitation for 3 h at 25 °C.
We used a biofunctional approach to establish the CD:PEI ratio for CCD generation.
We first established the optimal concentration of CDs for cell survival using the MTT assay, and 0.05 g/L allowed the highest cell viability (Fig. 2).
Fig. 2
Relative cell viability of the HEK293T cell line after 24 h of incubation with CDs at different concentrations. (n = 5, mean values ± SD. Student’s t-test was applied for statistical significance: *P < 0.05 ***P < 0.001)
Optimization of CCD generation by electrostatic PEI bindingSecond, we used our previously optimized control parameters of cell transfection via PEI polyplexes using a PEI:DNA mass ratio of 3:1—7.5 of PEI with 2.5 µg of DNA plasmid pMX-per mL of final cell medium per well of a 6-well plate (p6) [27, 28] as the standard starting point for CD:PEI:DNA ratio optimization.
We calculated the optimal amount of CDs to combine with PEI using these two parameters and the optimal amount of CDs for cell survival (50 µg/mL) with the µg of PEI needed in the abovementioned control polyplex transfection (7.5 µg). Therefore, we set our starting test mass ratio CD:PEI: µg as 20:3.
We thus prepared CCDs by mixing different amounts of CDs with a fixed amount of PEI to obtain different ratios: 10:3, 20:3, 40:3, 100:3 and 200:3.
After 30 min, we combined electrostatically generated CCDs with plasmid DNA at the described fixed amount (2.5 µg per p6 well) to maintain the PEI:DNA mass ratio at 3:1, vortexed briefly and added them to cell media to test the cell transfection efficiency (Fig. 3A).
Fig. 3
A Schematic of CCD preparation and cell transfection B Transfection efficiency measured as the % of GFP-positive cells analyzed by flow cytometry of HEK293T cells plated in p6 wells and transfected with CCDs generated by incubation of CDs with PEI at different mass ratios and mixed with a fixed amount of DNA. PEI at a 3:1 mass ratio with DNA was used as a control (orange) (n = 7, mean values ± SD. Student’s t-test was applied for statistical significance: ***P < 0.001). C Representative fluorescence microscopy images of transfected HEK293T cells with CCDs (20:3 mass ratio condition) or PEI (scale bar = 100 µm). D Transfection efficiency measured as the % of GFP-positive cells analyzed by flow cytometry of MenSC cells plated in p6 wells and transfected with CCDs (20:3 mass ratio condition). E Representative fluorescence microscopy images of MenSCs transfected cells with CCDs or PEI (scale bar = 100 µm)
We found 20:3:1 as the most efficient gene delivery condition, increasing more than 4 times the “positive transfection standard” PEI polyplex transfection efficiency (Fig. 3) and reaching over 80% GFP-positive cells measured by flow cytometry and visualized by fluorescence microscopy.
To confirm we reached the maximum transfection efficiency, we used different starting concentration of CD showing low cell toxicity (Fig. 2), 100 µg/mL and 25 µg/mL, combined with PEI at different mass ratio CD:PEI: 10:3, 20:3 and 40:3 (Supplementary Table S1), confirming they show lower efficiency than using 50 µg/mL of CD at 20:3 CD:PEI mass ratio. We also assayed to combine different amount of DNA with the CCD generated at the 20:3 CD:PEI mass ratio (Supplementary Table S2) and confirmed 1 µg of plasmid DNA (20:3:1 CD:PEI:DNA mass ratio) as the most efficient condition.
We confirmed the efficiency of CCD transfection also with primary cells. Primary cell cultures often show low transfection rates thus complicating their applications [31]. Mesenchymal cells can be obtained from different origins and present wide biomedical applications, of importance menstrual blood derived stromal cells (MenSCs) have recently emerged as cells with relevant regenerative, reparative, and protective properties of MenSCs and their therapeutic potential is being studied using recombinant protein expression among others technologies, however there are still very limited studies of transfection for gene delivery on MenSCs [32]. We confirmed CCD significantly increases MenSC cell transfection (Fig. 3D,E), opening the venue to assay these particles for different primary cell cultures gene overexpression.
CCD size characterizationThe appropriate surface charge and particle size of the DNA complexes are crucial for gene delivery. It is commonly accepted that complexes within the size range of 40 ∼ 200 nm may encounter better endocytosis [33]. Below 100 nm, the size of the nanoparticle plays a less important role in possible routes of uptake, as the geometry of different endocytic pathways can readily accommodate small nanoparticles.
The size of the CCDs 30 min after preparation was measured by TEM and DLS (Fig. 4). While CDs were visualized as single dots less than 10 nm in diameter (Fig. 1), generated CCDs aggregated to form over 50 nm diameter structures (Fig. 4A) with an average DLS diameter of approximately 100 nm (Fig. 4B).
Fig. 4
A TEM images of a 50 g/L CCD suspension prepared as described by 3 h of mixing CDs with PEI at a 20:3 optimized mass ratio (scale bar 50 nm), 30 min after preparation B Histogram frequency of DLS measurements of the mean hydrodynamic diameter (nm) found in CCD suspensions 30 min after preparation
CCD size and DLS diameter slightly increased over time but remained below ∼200 nm 2 h and 8 h after CCD preparation (Supplementary Figures S1A-D) and formed bigger aggregates of ∼ 1 μm after 24 h (Supplementary Figures S1E,F). We confirmed that transfection efficiency inversely correlated with CCD size (Supplementary Figures S1G) and kept 30 min as the optimal time to use for cell transfection.
Effect of CCDs on cell viabilityWe then confirmed that the use of CCDs improved cell viability compared to PEI and, as expected, slightly decreased cell viability compared to naked CDs, as PEI has been widely shown to affect cell survival [34, 35] (Fig. 5A).
Fig. 5
A Relative cell viability after 24 h of incubation with CDs at 0,05 g/L, CCDs at a 20:3 CD:PEI mass ratio and PEI at 0,016 g/L using the MTT assay. (n = 9, mean values ± SD. Student’s t-test was applied for statistical significance: * P < 0.05 *** P < 0.001. B Agarose gel electrophoresis of the complexes at different mass ratios
We also evaluated the relative cell viability (%RCV) when using CCD generated at different concentrations of CD and CD:PEI mass ratio (Supplementary Table S1), again showing maximum both cell transfection and cell viability with CCD generated with CD:PEI 20:3 mass ratio shown in Fig. 5A.
A gel retardation assay was used to confirm the interaction between the CCDs and DNA. As shown In Fig. 5B, DNA could be completely trapped in the loading slot by both PEI polymers and generated CCDs, while naked CDs were unable to bind DNA that migrated along the lane, similar to unbound DNA.
The zeta potential of the complexes was evaluated and found to increase from − 0.456 mV in CDs to + 18.2 mV in CCDs, confirming their positive charge after electrostatic coating with PEI, which allows efficient interaction with DNA. CCDs present a smaller charge than PEI polyplexes (+ 35 mV), and this effect may explain the decreased damage to cell membranes, thereby reducing the cytotoxicity observed when using CCDs (Fig. 4A) [36,37,38].
Evaluation of CCDs for the generation of retroviral particlesWe used our adjustable protocol for the generation of CCDs for the challenging generation of retroviral particles through plasmid cotransfection at a different scale to confirm the robustness of the method.
For efficient retroviral production, 100 mm diameter cell culture dishes, whose surface area is 6 × higher than that of p6 wells, are generally used, implying scaling the total amount of DNA to 15 µg. Additionally, double the amount of transgene-encoding plasmid is combined with packaging and envelope plasmids in a 2:1:1 molecule:molecule ratio to increase viral production [39]. According to their molecular weight, we used 7 μg of transgene-encoding plasmid (bicistronic pMX-GFP-Sox15, 6750 bp), 5.7 μg of packaging protein-encoding plasmid (pCMV-GAG-POL, 11 kbp) and 2.3 μg of envelope protein-encoding plasmid (pCMV-VSV, 6050 bp). We then followed our optimized CCD generation, maintaining the efficient CD:PEI:DNA ratio to 20:3:1, thus combining 45 µg of PEI with 300 µg of CDs to generate CCDs that were then mixed with DNA before cell transfection on HEK293T packing cells.
We first confirmed that CCDs significantly increased cell transfection efficiency after scaling up the assay, as shown by flow cytometry quantification of GFP-positive cells (Fig. 6A). Then, proper retroviral particle production was analyzed. For this, cell culture supernatant was recovered 24 h after transfection and was used to transduce cells. Retroviral particles containing the transgene constructor are able to infect target cells, integrate into their genome and express exogenous GFP and Sox15 genes. Viral supernatant coming from CCD transfection showed the highest transduction efficiency of both HEK293T (Fig. 6B,C) and MenSCs (Fig. 6D,E), measured as the % of GFP positive cells (Figs. 6B,D) and as the level of fluorescence intensity measured by flow cytometry (Supplementary Figure S2) indicating the highest production of viral particles after CCD transfection.
Fig. 6
A Transfection efficiency measured as the % of GFP-positive cells analyzed by flow cytometry of HEK293T cells plated in 100 mm diameter dishes and transfected with CCDs generated by incubation of CDs with PEI at a 20:3 mass ratio and mixed with a fixed amount of DNA to obtain the optimized 20:3:1 mass ratio. The standard transfection using PEI at a 3:1 mass ratio with DNA was used as a control (orange) (n = 11, mean values ± SD). Student’s t-test was applied for statistical significance: ***P < 0.001) B Viral transduction efficiency measured as the % of GFP-positive cells analyzed by flow cytometry of HEK293T cells after incubation with viral-containing supernatant secreted by HEK293T cells after three vector cotransfection using either CCD or PEI conditions (n = 9, mean values ± SD. Student’s t-test was applied for statistical significance: ***P < 0.001) C Representative fluorescence microscopy images of viral transduced HEK293T cells as in (B) (scale bar = 100 µm). D Viral transduction efficiency measured as the % of GFP-positive cells analyzed by flow cytometry of MenSC cells after incubation with viral-containing supernatant secreted by HEK293T cells after three vector cotransfection using either CCD or PEI conditions (n = 3, mean values ± SD. Student’s t-test was applied for statistical significance: ***P < 0.001) E Representative fluorescence microscopy images of viral transduced MenSC cells as in (D) (scale bar = 100 µm)
Effective internalization of DNA by cells is a crucial factor for the transfection process. Cell endocytosis is a complex process that has yet to be completely defined despite significant progress in the understanding of different endocytic routes [33]. The mechanism that allows the content of endocytosed vesicles to escape their degradation by late endosome and lysosome activity, which is the most common destiny of endocytosed vesicles, is not completely understood [33, 40]. If DNA does not escape from endosomes before reaching lysosomes, it is probably lost for gene expression, and the DNA in recycling endosomes is also most likely lost for the purposes of transfection. However, several reviews mention the possibility of vesicles shuttling between lysosomes and the Golgi or the ER, which would give the endocytosed DNA a last chance to escape degradation [40, 41]. In addition, it has been demonstrated that endosomal release of synthetic compounds such as DNA polyplexes can be facilitated via the covalent linkage of polyethylenimines to melittin analogs [42, 43] or through a proton sponge mechanism, a hypothesis describing that PEI/DNA complexes could promote proton and chloride influx into endosomes leading to disruption of endosomes and release of DNA into the cytosol [44], thus explaining the efficiency of our PEI-coated CCD-mediated transfection method that further enables gene expression of plasmid-encoded transgenes whose functionality was proven optimal even for demanding viral production of transfected cells.
The interaction of nanocarriers with plasma membrane is highly dependent on a myriad of factors including particle size, shape, surface structure, charge, lipophilicity, nature of nanocarrier and cell type involved in internalization [45, 46]. We hypothesize that the coating of CD with PEI generates CCD whose structure has a great impact on cell membrane interaction and/or internalization as the interaction of nanoparticles with cell membrane plays a crucial role in endocytosis and intracellular trafficking.
留言 (0)